OPEN SOURCE WEB-BASED SOLUTIONS FOR DISSEMINATING AND ANALYZING
FLOOD HAZARD INFORMATION AT THE COMMUNITY LEVEL
Meriam Makinano-Makinano-Santillan, Jojene R. Santillan*, Edsel Matt O. Morales
Caraga Center for Geo-informatics, Caraga State University, Butuan City, 8600, Philippines - (mmsantillan, jrsantillan)@carsu.edu.ph
Commission IV, WG IV/9
KEY WORDS: Web-based Solutions, Flood hazards, Information Dissemination, Community-level Hazard Assessment, Flood EViDEns
ABSTRACT:
We discuss in this paper the development, including the features and functionalities, of an open source web-based flood hazard information dissemination and analytical system called “Flood EViDEns”. Flood EViDEns is short for “Flood Event Visualization and Damage Estimations”, an application that was developed by the Caraga State University to address the needs of local disaster managers in the Caraga Region in Mindanao, Philippines in accessing timely and relevant flood hazard information before, during and after the occurrence of flood disasters at the community (i.e., barangay and household) level. The web application made use of various free/open source web mapping and visualization technologies (GeoServer, GeoDjango, OpenLayers, Bootstrap), various geospatial datasets including LiDAR-derived elevation and information products, hydro-meteorological data, and flood simulation models to visualize various scenarios of flooding and its associated damages to infrastructures. The Flood EViDEns application facilitates the release and utilization of this flood-related information through a user-friendly front end interface consisting of web map and tables. A public version of the application can be accessed at http://121.97.192.11:8082/. The application is currently expanded to cover additional sites in Mindanao, Philippines through the “Geo-informatics for the Systematic Assessment of Flood Effects and Risks for a Resilient Mindanao” or the “Geo-SAFER Mindanao” Program.
* Corresponding author
1. INTRODUCTION
Flood EViDEns, short for “Flood Event Visualization and Damage Estimations”, is an application that was developed by the Caraga State University Phil-LiDAR 1 Project to address the needs of local disaster managers in the Caraga Region in Mindanao, Philippines in accessing timely and relevant flood hazard information before, during and after the occurrence of flood disasters. The idea behind Flood EViDEns is all about geospatially-informed decision making before, during and after the occurrence of flood disasters. To formulate these decisions, local disaster managers must have access to localized flood hazard information that depicts not only the different scenarios of flooding hazards but also other equally important layers like the hazard levels and spatial extent of flooding, the elements that are exposed, and the impacts that a particular scenario of flood event will brought to the community.
The ‘community’ being referred here refers to the “barangay” which is the smallest unit of governance in the Philippines. Essentially, through Flood EVIDENs, barangay disaster managers would be able to visualize and determine how many houses would be flooded should a particular flood event will occur in the future.
A similar application for web-based flood hazard impact assessment in the Philippines is the ‘Project NOAH’ or the “Project Nationwide Operational Assessment of Hazards” (http://noah.dost.gov.ph). Project NOAH is capable of portraying scenario-based flood hazard maps, including
determining the number of structures and populations that can be affected should a particular flood scenario will occur. However, the visualization and impact assessment that can be made by Project NOAH is limited to the city/municipal level.
The development of Flood EViDENs and its deployment for operational use by the LGUs becomes a necessity because most of the Local Government Units (LGUs) in the Caraga Region do not have the capability to generate these flood hazard information, and even the hardware and software to conduct visualization and analysis should these layers of information are provided to them.
The conceptual basis and overviews of the initial version of Flood EViDENs is reported in Santillan et al. (2015). However, much of what has been reported in that paper refers to the ‘near -real time’ or ‘dynamic’ version of Flood EViDEns.
2. AREAS OF APPLICATIONS
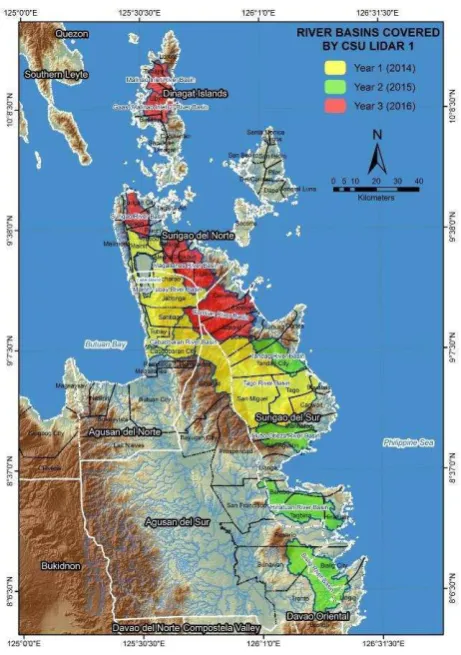
The Flood EViDEns web application covers barangays in 41 cities/municipalities within the twelve (12) highly flood prone river basins of Caraga Regions, Mindanao, Philippines (Figure 1). These river basins are actually the project areas of the CSU Phil-LiDAR 1 Project.
Figure 1. The twelve river basins in Caraga Region, Mindanao, Philippines covered by the Flood EViDEns application.
3. DEVELOPING THE WEB APPLICATION
3.1 Generating the Scenario-based, Static Flood Hazard Information for Web-based Visualization and Analysis
Flood hazard information corresponding to various historical and hypothetical scenarios (i.e., flooding due occurrence of rainfall events of different return periods of 2, 5, 25, 50 and 100 years) were generated for each of the 12 river basins through the use of flood simulation software/programs, particularly the Hydrologic Engineering Center Hydrologic Modelling System (HEC HMS) version 3.5 and HEC River Analysis System (HEC RAS) version 5 (Makinano-Santillan and Santillan, 2015).
Various geospatial datasets were utilized in the development of flood simulation models (Figure 2). In HEC HMSmodel development, a 10-m Synthetic Aperture Radar (SAR) Digital Elevation Model (DEM) was used for sub-basin delineations and for derivation of topography-related parameters of the model such as slope and elevation. Images acquired by the Landsat 8 satellite were also utilized to derive a landcover map using Maximum Likelihood classification. The landcover map is necessary for the derivation of land-cover-related model
parameters such as surface roughness coefficient, and runoff/infiltration capacities. River width and cross-section data obtained from field surveys as well as those extracted from 1-m resolution LiDAR-derived Digital Terrain Model (DTM) were also used to estimate the channel routing parameters of the model. For HEC RAS model development, river bed topography (obtained from bathymetric surveys), sea bed topography, LiDAR DTM, building footprints (with top elevation) extracted from LiDAR Digital Surface Model (DSM), and the same landcover map derived from Landsat 8 OLI satellite image were used as major inputs.
For each historical flooding event and for each rainfall return period, the HEC HMS-based hydrologic model computes for the volume of water coming from the upstream watersheds. Rainfall Intensity Duration Frequency (RIDF) curves generated by the Philippine Atmospheric Geosphysical and Astronomical Services (PAGASA) are used as input into the HEC HMS to determine the volume of rainfall that is necessary to compute discharge hydrographs for specific locations in the river basin, specifically at those locations where the upstream watersheds ends and the floodplain portions begin. The discharge hydrographs depict the volume of water per unit time (in m3/s) that drains into the main river at these locations. These hydrographs are then used as basis to generate water level forecasts, and as inputs into the HEC RAS two-dimensional (2D) hydraulic model to generate the flood depth and hazard maps for each rain return period. HEC RAS utilizes river and flood plain geometric data (from topographic and hydrographic surveys and LiDAR Digital Terrain Model - DTM), land-cover and surface roughness (from remotely-sensed images), and
Figure 2. Some of the geospatial datasets used in the development of the flood models. (from Santillan et
discharge hydrographs in order to generate flood depth maps. which, in turn are further processed to generate flood hazard levels by categorizing flood depths into low (depth <0.5 m), medium (0.5 ≤ depth ≤ 1.5 m), and high (depth > 1.5 m) hazards. The flood hazard maps produced from this process are in GIS shapefile format (one file each for the current flood hazard map, and forecasted flood hazard map).
For each river basin, there were two historical and five hypothetical flood hazard shapefiles computed. The historical events include that of the Tropical Storms ‘Seniang’ and ‘Agaton’ flooding in 2014. The hypothetical scenarios correspond to floods caused by rainfall events with return periods of 2, 5, 25, 50 and 100 years.
The flood hazard shapefiles are then used as inputs to the back-end of Flood EViDENs.
3.2 Generating the Flood Hazard Exposure Datasets for Impact Assessment can be identified like schools, hospitals and other identifiable built-ups are also included by means of manually inputting its building name and code in the attribute table and validated using field surveys and use of online web maps. Residential buildings were identified and validated by interview and ocular survey done by the partner LGUs. The information gathered from the survey was also used in attribution of digitized residential building. Detailed information of household like the number of household members, their birthdate, educational attainment, relation to the family head and their occupation were also recorded into a “.csv” file and joined into the GIS shapefile’s attribute table. An image of the building was also taken during the survey and linked to each building in the shapefile. The building shapefiles and photographs were then used as inputs into the back-end of Flood EViDEns.
3.3 Developing the Back-end and Front-end of Flood EViDEns
The back-end of Flood EViDEns was developed using the following:
• Django (GeoDjango module) – is a high-level Python Web framework that encourages rapid development and clean, pragmatic design. framework. Models (transformed as table in the database) were created first and generated using “ogrinspect” command from Django shell. The ogrinspect management command will inspect the given OGR-compatible DataSource (e.g., the flood shapefile) and will output a GeoDjango model with the given model name. After the creation of model, “syncdb” command was used to create tables on the PostgreSQL database and by
using the “Layer Mapping” utility of Django, shapefile is transformed as Multipolygon and loaded in the database.
Once data models were created, Django automatically gives a database-abstraction API (Application Program Interface) that lets you create, retrieve, update and delete objects. All the textual statistics like the estimated number of affected structures (according to flood hazard level) and the detailed number of affected structures (with its building name, building type, etc.) were generated by executing a query (intersects or ST_Intersects in PostGIS) using Django Object-relational mapping (ORM). On the other hand, map visualization is handled using GeoServer. Its data is from the PostgreSQL database also. Web Map Service (WMS) is used for flood hazard maps and Web Feature Service (WFS) for the affected structures. This is because WMS allows GeoServer to use GeoWebCache which makes the visualization faster and WFS which outputs a vector layer when rendered, is used to zoom-in to the location of the structure. Each flood hazard maps were configured individually and styled using Styled Layer Descriptor (SLD). SLD is an XML-based markup language for Geospatial data styling in GeoServer.
For its front-end, the following were used:
• JavaScript Libraries (Openlayers API, Highcharts, JQuery, Google Maps)
• Bootstrap - a popular HTML, CSS, and JS framework for developing responsive, mobile first projects on the web.
The entire user-interface (UI) of the application is configured using Bootstrap framework with its predefined styles (Cascading Style Sheet) and JavaScript functions. The interaction between the user and the application is handled by JQuery; a lightweight JavaScript library which makes HTML document traversal and manipulation, event handling, animation, and Ajax much simpler. Several JavaScript functions were also written like to read “.csv” files for the water level forecast and loading of flood hazard maps and the affected structures and displaying of the statistics. All map interactions were handled by Openlayers API like zooming-in and out, to toggle full screen and especially in showing information when an affected structure is clicked. interface of the application as accessed through a web browser.
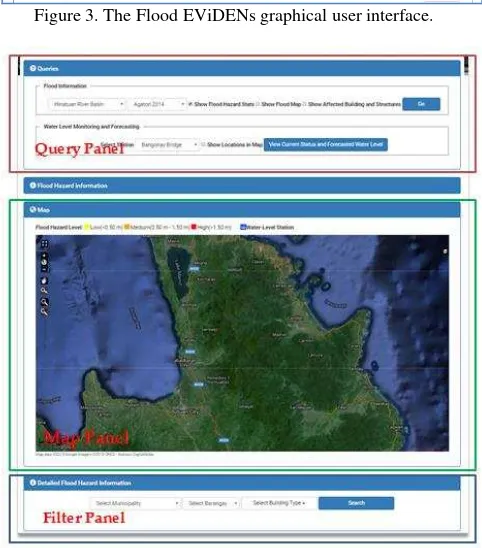
Figure 3. The Flood EViDENs graphical user interface.
Figure 4. Major panels of the Flood EViDENs GUI.
The ‘Query’ Panel mainly controls the flood hazard and water level information that you want to be displayed. This also controls the visualization of flood hazard maps and the affected structures. The panel contains options, checkboxes and a Go button. Mainly, these are the necessary inputs needed for the system run a query.
• Select Locality– consists of options/dropdown list of the river basins in which these are the project area of CSU Phil-LiDAR 1.
Select Flood Event – this depends on the selected locality or river basin; contains available historical and hypothetical flood events.
• Show Flood Hazard Stats– if checked, it will display flood hazard information depending on the selected locality and flood event.
• Show Flood Map – if checked, it will display flood hazard map on the map panel depending also on the selected locality and flood event.
• Show Affected Building and Structures– if checked, it will display the affected buildings and structures on the map panel depending on the selected locality and flood event.
The 'Filter Flood Hazard Information’ panel consists of select option for municipality, barangay under it, building types and a search button. Depending on the select river basin, a dropdown list of municipality within it will populate the option. Barangay option also depends on the selected municipality.
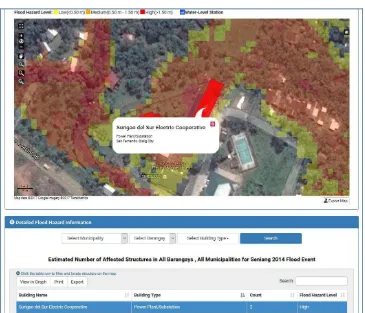
Depending on the query, map visualization will be displayed on the ‘Map’ panel. It has also map controls and a button to export it (does not include Google Map base layer) and works by clicking it (Figure 5).
Figure 5. Map Controls
5. EXAMPLE APPLICATION
Figure 6. A table containing the total number of affected structures per barangay according to hazard level that is generated when Flood EViDEns is used to generated hazard statistics.
Figure 8. A graph can also be generated based on the computed flood hazard statistics.
6. CONCLUSIONS
In this paper we presented the development, including the features and functionalities, of an open source web-based flood hazard information dissemination and analytical system called “Flood EViDEns”.
The web application made use of various free/open source web mapping and visualization technologies (GeoServer, GeoDjango, OpenLayers, Bootstrap), various geospatial datasets including LiDAR-derived elevation and information products, hydro-meteorological data, and flood simulation models to visualize various scenarios of flooding and its associated damages to infrastructures. The Flood EViDEns application facilitates the release and utilization of this flood-related information through a user-friendly front end interface consisting of web map and tables.
The information provided by Flood EViDEns is very important as it can increase awareness and responsiveness of the communities residing in a certain barangay to the impending flood disaster. Providing this kind of information during a heavy rainfall event is useful as it could assist in preparation for evacuation, in easily identifying areas that need immediate action, in identifying areas that should be avoided, and in estimating the severity of damage to people and infrastructure as flooding progresses.
A public version of the application can be accessed at
http://121.97.192.11:8082/. The application is currently being expanded to cover additional sites in Mindanao, Philippines through the “Geo-informatics for the Systematic Assessment of
Flood Effects and Risks for a Resilient Mindanao” or the “Geo -SAFER Mindanao” Program.
ACKNOWLEDGEMENTS
This work is one of the extended R&D activities of the Geo-SAFER Mindanao (“Geo-informatics for the Systematic Assessment of Flood Effects and Risks for a Resilient Mindanao”), a research program supported and funded by the Philippine Council for Industry, Energy and Emerging Technology Research and Development of the Department of Science and Technology (PCIEERD DOST). We gratefully acknowledge PCIEERD DOST for the financial support. We would also like to thank the anonymous reviewers for their helpful comments and suggestions.
REFERENCES
Makinano-Santillan, M., Santillan, J.R., 2015. Flood hazard mapping of river basins in Caraga Region, Mindanao, Philippines through the CSU Phil-LIDAR 1 Project. In: 36th Asian Conference on Remote Sensing, Quezon City, Metro Manila, Philippines.
Santillan, J.R., Morales, E.M.O., Makinano-Santillan, M., 2015. Flood EViDEns: a web-based application for near-real time flood event visualization and damage estimations. In: 36th Asian Conference on Remote Sensing, Quezon City, Metro Manila, Philippines.