MANAGEMENT EFFECTS ON GROUND COVER "CLUMPINESS": SCALING FROM
FIELD TO SENTINEL-2 COVER ESTIMATES
P. Scarth 1, * and R. Trevithick 2
1 Joint Remote Sensing Research Program, School of Geography, Planning and Environmental Management, University of
Queensland, St Lucia, QLD 4072, Australia – [email protected]
2 Remote Sensing Centre, Department of Science, Information Technology and Innovation, Ecosciences Precinct, Dutton Park, QLD
4102, Australia– [email protected]
KEY WORDS: Ground Cover, Clumping, Grazing, Great Barrier Reef, Erosion, Remote Sensing
ABSTRACT:
Significant progress has been made in the development of cover data and derived products based on remotely sensed fractional cover information and field data across Australia, and these cover data sets are now used for quantifying and monitoring grazing land condition. The availability of a dense time-series of nearly 30 years of cover data to describe the spatial and temporal patterns in landscape changes over time can help with monitoring the effectiveness of grazing land management practice change. With the advent of higher spatial resolution data, such as that provided by the Copernicus Sentinel 2 series of satellites, we can look beyond reporting purely on cover amount and more closely at the operational monitoring and reporting on spatial arrangement of cover and its links with land condition. We collected high spatial resolution cover transects at 20 cm intervals over the Wambiana grazing trials in the Burdekin catchment in Queensland, Australia. Spatial variance analysis was used to determine the cover autocorrelation at various support intervals. Coincident Sentinel-2 imagery was collected and processed over all the sites providing imagery to link with the field data. We show that the spatial arrangement and temporal dynamics of cover are important indicators of grazing land condition for both productivity and water quality outcomes. The metrics and products derived from this research will assist land managers to prioritize investment and practice change strategies for long term sustainability and improved water quality, particularly in the Great Barrier Reef catchments.
1. INTRODUCTION
High sediment loads and associated nutrients in runoff from grazing lands in the Great Barrier Reef catchments is a major contributor to the degradation of water quality entering the Reef lagoon. The sediment loss from hillslopes is heavily dependent on patch configuration (Ludwig et al., 2007). Patches control water flow (Northup et al., 2005, Ludwig et al. 1994 in Northup et.al., 2005), and the location of low and high cover patches has been found to be significant in contributing to erosion and runoff (Bartley et al., 2006). Ecosystems self-organise as water infiltrates faster into bare ground (Reitkirk et al., 2002), resulting in rapid decline of the landscape and an increase in ‘leakiness’ (Tongway and Ludwig 1997, in Northup et al., 2005).
Patch dynamics are strongly influenced by grazing pressure. At the regional scale grazing intensity is the greatest driver of patch dynamics outside of precipitation (Zhe et.el., 2013). Higher concentration of nutrients in patches than in surrounding bare areas (Northup et al., 2005), results in more palatable regrowth and preferential grazing (Cid and Brizuela, 1998). Lower stocking rates tend to preserve patch structure, resulting in more stable patches (Cid and Brizuela, 1998, Northup, 2005). While moderate and heavy stocking leads to generation of patches of differing forage quantity and quality (Cid and Brizuela, 1998). Heavier grazing pressures produce less standing crop and more dispersion of tussocks (Northup et.al, 2005).
An understanding of patch dynamics is therefore desirable from the perspective of both managing water quality and also sustainable grazing and productivity.
While there has been significant progress in the development of cover data and derived products based on remotely sensed fractional cover information and field data across Australia, there are limitations using remote sensing to map small and linear patches at a sub pixel scale. To accurately map patches Lechner et al. (2009) found that the raster grid needed to be many times smaller than the patch size. At the 30 m Landsat scale, and even at finer scales, such as with newer satellites like Sentinel-2, mapping may still miss most of these patches.
An alternative to mapping patches is to use spatial variance analysis to characterise the ‘clumpiness’ of patches. This work will use punctual variograms calculated from high-density field sampling and compare these with variograms calculated across entire paddocks derived from Sentinel-2 cover estimates.
2. STUDY AREA
The study site for this project is located within the Burdekin catchment in QLD, Australia (Figure 1). The Burdekin is a priority Great Barrier Reef catchment. Grazing is the primary land use and the catchment is a major source of sediments and nutrients to the Reef lagoon (O’Reagain et.al., 2005). The study site is the Wambiana grazing trials, located on the Wambiana property south-west of Charters Towers. The region experiences around 690 mm of precipitation annually and the average annual temperature is 23 degrees.
on treatment stage. In addition to the grazing paddocks, there is a single exclosure, which has unfortunately been compromised by wild pigs.
Figure 1. Location of Wambiana grazing trials (red star) within Burdekin Catchment (shaded area), QLD Australia.
3. DATA 3.1 Field Data
Wambiana was visited during the first week of September 2016 and field data was collected at 12 plots across the grazing trials (Figure 2). The plots were located to capture as great a variety of grazing treatments and land type combinations as possible (Table 1). Where possible the plots were positioned in areas of low foliage projective cover to reduce the interference of the over story.
Field data collected was point intercept transect measurements of ground cover, using a modified version of the method described in Muir et al. (2011). This method consists of a star layout of three tapes, with cover data collected at each metre along the tape transects where it intercepts with a laser pointer beam. The modification of this method consisted of higher intensity sampling along the north-south transect, which was instead sampled at a 20 cm interval. Based on previous experimental transects, 20 cm intervals were determined to be a fine enough resolution for the development of the variograms, giving 500 point based cover samples over the 100 m transect. All sampling for these transects was performed by the same two experienced observers. This was done to reduce observer bias, which is minimised when using experienced field staff (Trevithick et al., 2012). For the purposes of this project, the other transects of each star, while collected, were not used in analysis.
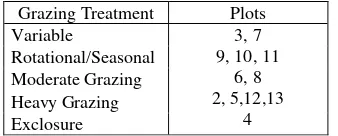
Grazing Treatment Plots
Variable 3, 7
9, 10, 11 6, 8 2, 5,12,13
4 Rotational/Seasonal
Moderate Grazing Heavy Grazing Exclosure
Table. 1. Grazing treatment associated with each field plot
Figure 2. Location of field plots within the Wambiana grazing trials and associated treatment type
3.2 Sentinel-2
All Sentinel-2 data over the study site acquired up to the end of 2016 was downloaded from the Amazon Sentinel-2 data service S3 bucket. The data was processed to terrain corrected surface reflectance using the method of Flood (2013). The data was then masked for cloud and cloud shadow using a python implementation of F-mask (Zhu and Woodcock, 2012). A correction factor to produce a Landsat like spectral response from the Sentinel surface reflectance was calculated following a similar method as outlined in Flood (2013). The Landsat based spectral and mixing method by Scarth et al. (2010) was then applied to produce fractional amounts of bare ground, green cover and non-green cover on a per pixel basis (Figure 3). Because we do not expect clumping to be as apparent in the wet season when there is a significant amount of green grass and very little bare ground, these wet season images (from November through to February) were removed from the analysis.
Figure 3. Example of fractional cover image produced from Sentinel-2 imagery over the Wambiana grazing trials (red: bare
4. METHODS
There are several methods we can use to describe the degree of spatial dependence of a random stochastic process. In this work, we assess the spatial autocorrelation structure using the variogram, which is the semivariance plotted against distance. This is calculated as one half of the observed average square difference in data values for every pair of locations at a separation distance h:
(1)
where xi = sample point
h = lag factor (distance between two sample points) N = number of points at distance h
Important features of the variogram include the range which is related to the size of the dominant objects, and the sill, which is inversely related to the density of the objects. The nugget represents the underlying variance that occurs at a scale smaller than the minimum sampling distance, or h.
Numerous authors have employed variograms for estimating forest structural attributes and measuring grassland structure and biomass but it was work by Jupp, Strahler and Woodcock (1989) using a simple disc model who explored the relationship between image variograms and discrete objects scene structure including how to scale from point based (or punctual) variograms to pixel based (or regularized) variograms.
The regularised variogram results from the convolution of a punctual variogram within the sensor's field of view. Jupp, Strahler and Woodcock (1989) shows how this regularisation typically lowers the overall variance and increases the range. Scaling theory (Harte et al., 2005) indicates that the differences in clumping are often self-similar across scales so we hope to see similar differences in the variograms at Sentinel scale as we would at the field scale.
This work will examine punctual variograms calculated from high-density field sampling and compare these with variograms calculated across entire paddocks derived from Sentinel-2 cover estimates.
5. RESULTS 5.1 Field Data
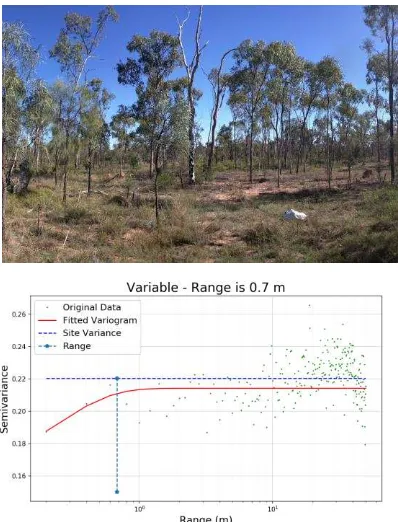
The variogram was computed using the equation above for each of the field transects and are summarised in Figures 4 to 6.
For the exclosure and paddocks with a low stocking rate, the field-based punctual variograms display a very small range, of the order of 30 to 50 cm, and a very high nugget. This indicates that at this scale the arrangement of groundcover is very close to random and exhibits very little clumping. For many of these sites the nugget is close to the calculated site variance showing that if there is spatial structure it is happening at a scale of less than our 20 cm sampling interval.
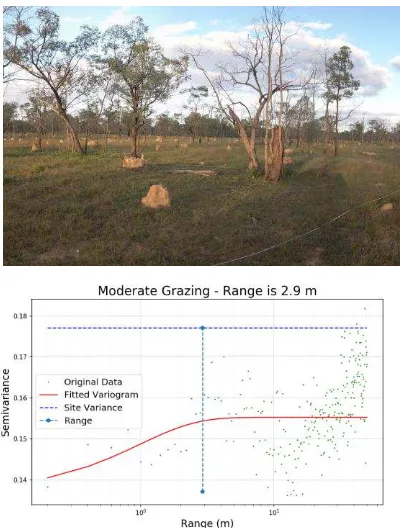
The paddocks with flexible stocking rates show slightly longer ranges in the order of 1 to 3 m. The cover in these paddocks is slightly clumped and less random than in the lightly grazed paddocks.
For the high stocking rate paddocks the typical range is 4 to 7 m indicating that the cover there is significantly clumped at this scale. These results are supporting the hypothesis that heavily grazed paddocks lead to more clumped vegetation.
For all the field sites, the sill height of the variogram approaches the theoretical site variance based on the ground cover mean. This then allows us to use the mean within a pixel as an estimate of the punctual variance within that pixel which should allow us to scale observations of groundcover with constraints on the variance.
Grazing Treatment ~ Mean Range
Variable 0.3
1.3 1.6 4 Rotational/Seasonal
Moderate Grazing Heavy Grazing
Table 2. Approximate mean range for each treatment type
Figure 5. Typical moderate stocking rate. Wamble 8 is moderate stocking and range is 2.9 m
Figure 6. Typical high stocking rate sites. Wamble 13 is high stocking and range is 4.1 m
5.2 Sentinel-2 Data
All paddocks were processed successfully over all time periods and variograms were computed out to 1000 m for all paddocks except for the exclosure, which was too small to find pairs pixels more than 400 m apart.
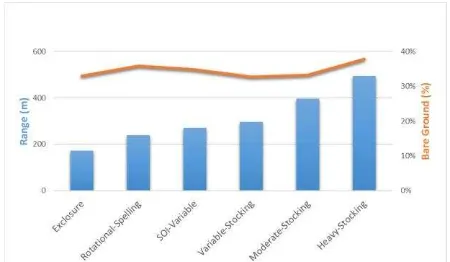
We see a similar pattern in the variogram range at the 10 m pixel size of Sentinel. For the examples shown below in Figure 7, the exclosure exhibits the shortest range at around 65 m followed by the lightly grazed paddocks at around 80 m with the moderate and heavy stocking paddocks doubling these ranges to 150 and 350 m respectively. When we processed multiple dates of Sentinel imagery and computed the mean range over a set of 10 images we see the same consistent pattern emerging with the exclosure showing the shortest range and the heavily stocked paddock exhibiting the greatest clumping.
Figure 8 also shows the mean bare ground for these paddocks and it can be seen that the amount of bare ground is not a good predictor of the paddocks stocking rate. This is consistent with the work done by Bastin et al. (2012) who showed that it was the relative difference between a pixel cover value and a reference value that was more important for predicting the condition of a region.
Figure 8. Mean bare ground (line) and spatial range (bars)
6. CONCLUDING REMARKS
This work shows an initial qualitative analysis of the similarities between field-based punctual variograms and regularised image based variograms using Sentinel-2 bare ground data. The patterns of vegetation clumping that we see in the field data are related to the grazing strategies applied across the paddocks. This clear that these grazing strategies cause clumping to occur at multiple scales from the relationship between the Sentinel-2 based variogram range and the grazing strategy.
Based on these results along with the development of an operational Sentinel-2 processing framework covering all of Queensland, future work will apply these methods across the entire Reef catchments system with the results being used and interpreted as part of a series of expert workshops looking at ways to better quantify land degradation and recovery across these systems, and how the land degradation impacts on the reef systems.
We also intend to interact more with water quality modellers as the concept of vegetation clumping is similar to the landscape leakiness work of Ludwig et al. (2007) where highly clumped landscapes tend to deliver more sediment off-site. We hope that the metrics and products derived from this research will assist land managers to prioritize investment and practice change strategies for long term sustainability and improved water quality, particularly in the Great Barrier Reef catchments.
ACKNOWLEDGEMENTS
We would like to thank the Office of the Great Barrier Reef (OGBR) within the Queensland Department of Environment and Heritage Protection for funding this research. Peter O'Reagain from DAF for his work in running the Wambiana trial over the past X years.The Lyons family for hosting us and providing invaluable discussions on land condition from a
grazier’s perspective.The many knowledgeable grazing science and extension staff from DAF, DSITI and DNRM for valuable erosion from Australia’s tropical semi-arid rangelands: influence of ground cover for differing space and time scales.
Hydrol. Process. 20, pp. 3317-3333
Bastin, G. and Scarth, P. and Chewings, V. and Sparrow, A. and Denham, R. and Schmidt, M. and O'Reagain, P. and Shepherd, R. and Abbott, B. 2012. Separating grazing and rainfall effects at regional scale using remote sensing imagery: A dynamic reference-cover method. Remote Sensing of Environment, 121 . pp. 443-457. doi:10.1016/j.rse.2012.02.021
Cid and Brizuela 1998. Heterogeneity in tall fescue pastures created and sustained by cattle grazing. Journal of Rangeland
Management. 51, pp. 644-649.
Flood, N., Danaher, T., Gill, T. and Gillingham, S. (2013) An Operational Scheme for Deriving Standardised Surface Reflectance from Landsat TM/ETM+ and SPOT HRG Imagery for Eastern Australia. Remote Sens. 2013, 5(1), 83-109. doi:10.3390/rs5010083
Harte, J., Conlisk, E., Ostling, A., Green, J. L. and Smith, A. B. 2005. A theory of spatial structure in ecological communities at multiple spatial scales. Ecological Monographs, 75, pp. 179– 197. doi:10.1890/04-1388
Jupp, D.L.B., Strahler, A.H., and Woodcock, C.E. 1989. Autocorrelation and regularization in digital images. II. Simple image models. IEEE Transactions on Geoscience and Remote Sensing 27 (3), pp. 247-258. McJannet., D. 2007. Patch Configuration Non-linearly Affects Sediment Loss across Scales in a Grazed Catchment in North-east Australia. Ecosystems. 10. pp. 839-845.
Muir, J, Schmidt, M, Tindall, D, Trevithick, R, Scarth, P and Stewart, JB, 2011, Field Measurement of fractional ground cover: a technical handbook supporting ground cover monitoring for Australia, prepared by the Queensland Department of Environment and Resource Management for the Australian Bureau of Agricultural and Resource Economics and Sciences, Canberra, November.
Northup, B.K., Brown, J.R. and Ash, A.J. 2005. Grazing impacts on spatial distribution of soil and herbaceous characteristics in an Australian tropical woodland. Agroforestry System, 65, pp. 137-150.
Northup, B.K., Dias, C.D., Brown, J.R. and Skelly W.C. 2005 Micro-patch and community scale spatial distribution of herbaceous cover in a grazed eucalypt woodland. Journal of Arid Environments, 60, pp. 509-530
O’Reagain, P.J., Brodie, J., Fraser, G., Bushell, J.J., Holloway, C.H., Faithful, J.W. and D. Haynes, D. 2005 Nutrient loss and water quality under extensive grazing in the upper Burdekin river catchment, North Queensland. Marine Pollution Bulletin, 51, pp. 37–50
Scarth, P., Röder, A., Schmidt, M., 2010b. Tracking grazing pressure and climate interaction - the role of Landsat fractional cover in time series analysis. In: Proceedings of the 15th Australasian Remote Sensing and Photogrammetry Conference (ARSPC), 13-17 September, Alice Springs, Australia. Alice Springs, NT.
Trevithick, R., Muir, J. and Denham, R, 2012, The effect of observer experience levels on the variability of fractional ground cover reference data. Proceeding of the 16th Annual ARSPC, Melbourne, Australia, August 31 - September 4th 2012.
Zhe Li, Ted Huffman , Brian McConkey, Lawrence Townley-Smith. 2013. Monitoring and modeling spatial and temporal patterns of grassland dynamics using time-series MODIS NDVI with climate and stocking data. Remote Sensing of Environment 138. pp. 232-244
Zhu, Z. and Woodcock, C.E. 2012. Object-based cloud and cloud shadow detection in Landsat imagery Remote Sensing of Environment 118 (2012) 83-94. Extra test performed to mask saturated cloud. Cloud shadow mask, from Fmask Landsat TM cloud algorithm. Zhu, Z. and Woodcock, C.E. 2012. Object-based cloud and cloud shadow detection in Landsat imagery