SYNTHESIS AND CHARATERISATION OF RICE HUSK SILICA BASED BOROSILICATE
(B2SiO5) CERAMIC BY
SOL-GEL
ROUTES
Simon Sembiring
Material Research Group, Department of Physics, Faculty of Mathematics and Natural Science, Lampung University Jl. Prof. Soemantri Brojonegoro No.1, Bandar Lampung
Received July 12, 2010; Accepted April 5, 2011
ABSTRACT
In this research, borosilicate ceramics were produced from rice husk silica. Preparation of borosilicate ceramics was conducted by mixing boron oxide sol from borax with silica sol extracted from rice husk. The boron oxide was produced by hydrolysis of borax using H2SO4 5%. The samples were synthesized with different compositions, with
the ratios of silica to boron oxide are 8:1, 8:2, 8:3 and 8:4. The samples were sintered at 900 °C. Functional groups were examined using FTIR spectroscopic technique. Structural and microstructural characteristics were examined by XRD and SEM, respectively. The chemical resistance of borosilicate is evaluated by gravimetric method using H2SO4, HCl, NaOH and KOH. The FTIR study revealed that the main functional groups are Si-O-Si, B, and
B-O-Si. The x-ray diffraction (XRD) study revealed that the main crystalline phases are borosilicate (B2SiO5) and boron
oxide (B2O3). SEM investigations clearly demonstrated that the smaller particle size was found with increasing in
boron oxide concentration. From the chemical resistance test carried out, it was obtained that the produced borosilicate possessed high resistance to acids and alkalis.
Keywords:rice husk, silica, borosilicate, FTIR, XRD, SEM
INTRODUCTION
Borosilicate (B2SiO5) glass or ceramic composite is
one of the promising material which has a wide range of applications because of its low thermal expansion [1], superior chemical resistance [2], and low dielectric constant i.e, approximately, = 4.8 at 1 MHz [3]. For these reasons, borosilicate is widely used as laboratory glassware, industrial piping, bulbs for hot lamps and electronic tubes. Besides these applications, borosilicate also plays an important role in the production of vycor glass at low-working temperature. The performance of borosilicate strongly depends on the structure and microstructure. As an example, the presence of crystoballite structure on the borosilicate was reported to enhance dielectric constant and thermal expansion coefficient [3]. In addition, decreasing borosilicate sintering temperatures is also important for circuit material, since higher temperatures would cause the circuit materials to be oxidized. Therefore, in order to decrease sintering temperature, various techniques have been used to fabricate borosilicate, such as slip casting [4], chemical precipitation [5], sol-gel [6-7], and melting [8]. The sol-gel process enables the production of ceramics material of high purity, homogeneity and superior properties at lower temperature than the other techniques. Considerable effort has also been devoted to the study of borosilicate as component of refractory material [7] for its high thermal and chemical stability. In
addition, borosilicate has a general use in thermal application because of its low thermal expansion, approximately 3.3 10-6/°C [9], i.e. element of filament for x-ray instrument [10], support in heat exchangers for gas turbine engines and furnaces [1]. Moreover, borosilicate is also used as an integrated circuit substrate because of its low dielectric constant [3].
[26]. In the present study, utilization of rice husk silica as a raw material for synthesizing borosilicate is also intended to create value added from rice farming. This study focuses on the synthesis and characterization of rice husk silica based borosilicate ceramic by sol-gel routes. The borosilicate ceramic was synthesized from rice husk silica and other water-based precursor materials following a simple step wet-chemical process. The borosilicate synthesized was characterized by functional group analysis (FTIR), structure (XRD), microstructure (SEM) and chemical resistance to acids and alkalis.
EXPERIMENTAL SECTION
Materials
Raw materials used for the experiments were rice husk as sources of silica and borax [(Na2)B4O7.10H2O]
as sources of boron oxide, respectively. Other chemicals used were KOH 5%, H2SO4 5%, HCl 5%, NaOH 5%,
distilled water, pH indicator, and filter paper.
Instrumentation
The equipments used in this study are a Perkin Elmer FTIR, an automated Shimadzu XD-610 X-ray diffractometer with CuK radiation (λ = 0.15418), produced at 40 kV and 30 mA, a Philips-XL scanning electron microscopy (SEM), and a microbalance Mettler Instrument AG, CH-8806 Greifensee-Zurich.
Procedure
Synthesis of borosilicate powders using the sol-gel method was performed in three steps, (i) preparation of silica and boron sols, (ii) preparation of borosilicate with various ratios of silica to boron oxide, and (iii) characterization and chemical resistance tests.
Preparation of silica and boron sols
Preparation of silica sol was conducted following the procedures that have previously been applied [13,16]. In the first step, rice husk was washed with hot water to remove contaminants of water soluble organic matters present, and then dried in the room temperature. The dried husk (50 g) were stirred in 500 mL of 5% KOH solution. The mixture was boiled in a baker glass for 30 min. The mixture was allowed to cool to room temperature and left for 24 h. The mixture was filtered to separate the filtrate which contains silica (silica sol). Boron sol was prepared by dissolving 100 g of borax into 500 mL solution of H2SO4 5%. The borax solution was
stirred in a beaker glass for 8 h.
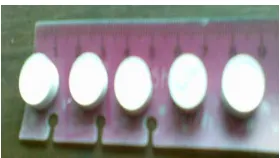
Fig 1.The pellets of borosilicate sintered at 900 °C
Fig 2. FTIR spectra of borosilicate samples with various boron oxide concentrations after sintered at 900 °C (a) 8:1, (b) 8:2, (c) 8:3 (d) 8:4 and (e) 8:5. The absorption peaks are assigned to functional groups of B-O-Si, B-O-B, Si-O-Si, and C-O
Preparation of borosilicate ceramic
To obtain the solid borosilicate, calculated quantities of silica sol were added under stirring to the appropriate volume of boron sol to give the ratios of silica and boron oxide as a mass ratio of 8:1, 8:2, 8:3 and 8:4. The mixture was heated at 90 °C under continuous stirring to transform the sample (sol) into gel. The gel was dried at 110 °C for 5 h and grounded into powder with the size of 125 m. The powder was pressed in a metal die with the pressure of 3 ton to produce cylindrical pellet, and then the pellet was sintered at 900 °C (Fig. 1).
Characterization
the samples was determined for the amount of weight reduction after being kept 24 h at 25 °C in three replicates, using H2SO4, HCl, NaOH and KOH at
concentration of 10%.
RESULT AND DISCUSSION
Characterization with FTIR
The FTIR spectra of all samples scanned over the wave number range of 4000 to 400 cm-1are compiled in Fig. 2, showing the functionality of the samples with various boron oxide contents, after sintered at 900 °C. Several absorption bands are observed at the wave numbers of 2361, 1624, 1095, 793, 618, and 467 cm-1. The strong peak in the range 1095–1092 cm-1 is assigned to stretching vibration of silica, corresponding to the specific structural of siloxane bond Si-O-Si due to the deformation of Si-O bond, as has been observed by others [27-28]. In addition, two the significant absorption peaks at 467 and 793 cm-1 were observed, which were commonly attributed to the symmetric and asymmetric stretching vibrations of B-O-Si, due to the incorporation of boron atoms and vibration of tetrahedral SiO4 entity
B(OSi) [29-30]. The shoulder peak at the range of 618–630 cm-1was assigned to the extensive asymmetric stretching vibration of B-O-B. The formation of B-O-B on the surface indicates the transformation of borax to boron oxide. In previous analyses [31-34] it is suggested that B-O-B bond occurs through the stretching vibration of tetrahedral BO4, after sintered at 900 °C. Beside that,
vibration band in the range of 1616–1624 cm-1suggests the presence of O-H bond, associated with bending vibration of the water molecules trapped in the matrix of the silica [7,20,35]. In addition, vibration band of C-O appeared around 2361 cm-1 is considered as related to residual carbon from organic components such as cellulose, of the rice husk [35-37].
Characterization with XRD
To gain information on structure development, the samples were analyzed using XRD technique. The phases were identified with the PDF diffraction pattern database (1997), published by the International Centre for Diffraction Data (ICDD) [38], comparing the diffraction lines with the standard PCPDF files using search-match method. The XRD patterns for all samples are shown in Fig. 3. As expected, the XRD pattern of the samples indicated the presence of borosilicate (B2SiO5
)-PDF-42-0382 and boron oxide (B2O3)-(PDF-44-1085), with the
most intense peaks observed at 2 = 23.16° and 2 = 31.92°. The existence of these two phases is also supported by the FTIR results, which confirm the presence of Si-O-B and B-O-B functional groups. As can
Fig 3.XRD pattern of borosilicate samples with various boron oxide concentrations after sintered at 900 °C, (a) 8:1, (b) 8:2, (c) 8:3 (d) 8:4 using CuK radiation ( = 1.5048 Å). The peaks are labeled B for borosilicate (PDF-42-0382) and Q for boron oxide (PDF-44-1085)
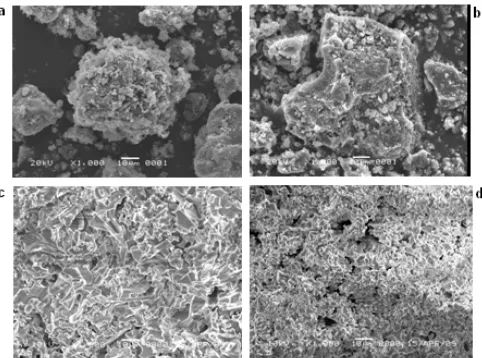
Fig 4.SEM images of borosilicate samples with various boron oxide concentrations after sintered at 900 °C, (a) 8:1, (b) 8:2, (c) 8:3 (d) 8:4
be seen in Fig. 3, the borosilicate was detected in all of the sintered samples. This finding implies that the reaction between tetrahedral of SiO4 and BO4 to
produce borosilicate took place at temperatures applied, which is in agreement with the results previously reported [10,30,39-40].
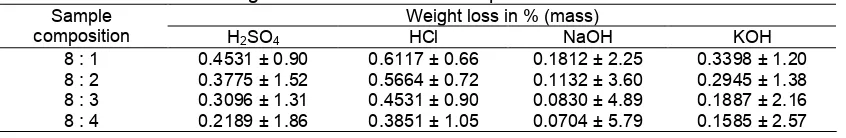
Table 1.Weight loss of borosilicate samples in acids and alkalis Weight loss in % (mass)
Sample
composition H2SO4 HCl NaOH KOH
8 : 1 0.4531 ± 0.90 0.6117 ± 0.66 0.1812 ± 2.25 0.3398 ± 1.20 8 : 2 0.3775 ± 1.52 0.5664 ± 0.72 0.1132 ± 3.60 0.2945 ± 1.38 8 : 3 0.3096 ± 1.31 0.4531 ± 0.90 0.0830 ± 4.89 0.1887 ± 2.16 8 : 4 0.2189 ± 1.86 0.3851 ± 1.05 0.0704 ± 5.79 0.1585 ± 2.57
Characterization with SEM
To evaluate the surface morphology, the samples were further characterized using SEM. The micrographs of the samples with different composition are shown in Fig. 4 a-d, respectively. The surface morphology of the samples is highly influenced by the boron oxide content. As can be seen, increased content of boron oxide was found to result in more homogeneous surface marked by smaller particle size and more evident grain boundary. In the two first samples (Fig. 4a and 4b), the presence of clusters was clearly observed, indicating that the surface is highly heterogeneous, most likely with localized distribution of the borosilicate and boron oxide on the surface.
In the sample with the composition of 8:3 (Fig. 4c), the feature observed indicates the homogeneous surface with homogeneous distribution of both phases, and therefore, the two phases were detected using XRD technique as previously mentioned. In the last sample (Fig. 4d) the homogeneous surface is also observed, however with smaller particles sizes than those observed in the sample of 8:3 compositions (Fig. 4c). Apart from this similarity, the two samples also displayed a significant different regarding the existence of the boron oxide. As previously mentioned, in the last sample, no boron oxide was detected according to the XRD technique. Combining the XRD and SEM results lead to the conclusion that the surface of the last sample (silica to boron oxide with the ratio of 8:4) is fully covered by the borosilicate phase and therefore hinders the detection of boron oxide using the XRD method.
Chemical Resistance Evaluation
Another characterization of the samples carried out in this study is chemical resistance testing toward acids and alkalis. The resistance was defined in term of weight loss at pressed in % by mass, after the samples were subjected to the acids and alkalis. The average results form three replicate experiments are presented in Table 1, together with standard deviation of the measurements.
As can be seen in Table 1, the weight loss of the samples decreases with increasing boron oxide content in both acids and alkalis solution. With respect to these results, it is concluded that the higher the content of
boron oxide, the better the resistance of the sample toward acids and alkalis. It is also observed that the weight loss in alkali (NaOH and KOH) is lower than that in acid (H2SO4 and HCl), suggesting that the
borosilicate synthesized are more resistance to alkalis.
CONCLUSION
In this paper, synthesis and characterization of borosilicate prepared using rice husk silica and borax were investigated. The results obtained clearly demonstrate that borosilicate ceramic could be produced using rice husk silica and borax as raw material. On the basis of FTIR analyses, reaction between silica and boron oxide to produce borosilicate was confirmed by the presence of Si-O-Si, B-O-B, and B-O-Si functional groups. X-ray diffraction analysis revealed the presence of borosilicate (B2SiO5) and
Boron oxide (B2O3) phases in the ratio of silica and
boon oxide at 8:1, 8;2, 8:3, but only borosilicate (B2SiO5) phase for 8:4. An irregular and agglomerated
morphology of the particles were observed by SEM for 8:1 and 8:2 samples, and small size distribution of the particle was found for the 8:3 and 8:4 samples. It was also found that borosilicate ceramic has high chemical resistance toward acids and alkalis.
ACKNOWLEDGEMENT
The author is grateful to Directorate General Higher Education Republic of Indonesia for research funding provided through Hibah Competence research grant program. The author would also like to express gratitude and appreciation to Prof. Dr. Sue Churchill and Prof. Dr. John Wilhoit from The University of Kentucky, for their kindness to review this manuscript during the Workshop on Academic Writing, held in The University of Lampung on 14-16 June, 2010.
REFERENCES
1. Monteiro, R.C.C, and Lima, M.M.R.A, 2003,J. Eur. Ceram. Soc., 23, 11, 1813–1818.
2. Zawrah, M.F., and Hamzawy, E.M.A., 2002,
Ceram. Int., 28, 2, 123–130.
4. Du, L.S., Allwardt, J.R., Schmidt, B.C., and Stebbins, J.F., 2004,J. Non-Cryst. Solids, 337, 2, 196–200. 5. Yoon, O.S, Kim, K.S, Kim, S, Shim, S.H, and Park,
J.G., 2007,Mater. Forum, 544, 960–964.
6. Soraru, G.D., Babonneu, F., Gervais, C., and Dallabona, N., 2000, J. Sol-Gel Sci. Technol., 18, 11–19.
7. Liu, F., Guo, X.F., and Yang, G.C., 2001, J. Mater. Sci., 36, 3,579–585.
8. Wolf, P.F., Mc-millan, Stebbin, J.F., Mc-millan, P.F., and Dingwell, 1995,J. Am. Miner. Soc., 505, 2345– 2349.
9. Greenhut, V.A, 1991, ASM International, Materials Park, OH, USA, 4, 298–311.
10. Iwadate, Y., Hattori, T., Igarashi, K., and Mochinaga, J, 1989,J. Mater. Sci. Lett., 8, 9, 1079–1081.
11. Della, V.P., Kuhn, I., and Hotza, D., 2002, Mater. Lett., 57, 4, 818–821.
12. Yalcin, N., and Sevinc, V., 2001, Ceram. Int., 29, 219–224.
13. Daifullah, A.A.M., Awwad, N.S., and El-reefy, S.A., 2004,Chem. Eng. Process., 43, 193–201.
14. Hamdan, H., Muhid, M.N., Endud, S., Listiorini, E., and Ramli, Z., 1997,J. Non-Cryst. Solids, 211, 126– 131.
15. Real, C., Alcala, M.D., and Criado, J.M., 1996, J. Am. Ceram. Soc., 79, 2012–2016.
16. Sembiring, S., 2007, Prosiding, Dies Natalis
Universitas Lampung, 43, 203–209.
17. Sembiring, S., and Karo-Karo, P., 2007,Jurnal Sains dan Teknologi, Mipa Unila, 13, 233–239.
18. Ikram, N., and Akhter, M., 1988,J. Mater. Sci., 23, 7, 2379–2381.
19. Naskar, M.K., and Chatterjjee, M., 2004, J. Eur. Ceram. Soc., 24, 3499–3507.
20. Kurama, S., and Kurama, H., 2006,Ceram. Int., 32, 1–4.
21. Sembiring, S., 2008, Prosiding Seminar Nasional Sains dan Teknologi II, Universitas Lampung, 2, 193–198.
22. Sembiring, S., Manurung, P., and Karo-Karo, P., 2009, Jurnal Fisika dan Aplikasinya, FMIPA ITS, 5, 090107.
23. Rahman, I.A., 1994,Ceram. Int., 20, 195–199. 24. Romero, J.N., and Reinggo, F.R., 1996, J. Mater.
Sci., 31, 779–784.
25. Bose, S., Acharya, H.N., and Banerjee, H.D., 1993,
J. Mater. Sci., 28, 5461–5468.
26. Chatterjee, M., and Naskar M.K., 2006, J. Ceram. Int., 32, 623–632.
27. Daifullah, A.A.M., Girgis, B.S., and Gad, H.M.H., 2003,J.Mater. Lett., 57, 1723–1731.
28. Adam, F., Kandasamy, and Balakrishnan, S., 2006,
J. Colloid Interface Sci., 304, 137–143.
29. Azooz, M.A., Aiad, T.H.M.A., Elbatal, F.H., and Eltabii, G., 2008, Indian J. Pure Appl. Phys., 46, 880–888.
30. Mansour R., Lafjah M., Djafri, F., and Bengueddach A., 2007,J. Korean Chem. Soc., 51, 178–185.
31. Kundu, V., Dhiman, R.L., Maan, A.S., and Goyal, D.R., 2008, Adv. Condens. Mater. Phys, 25, 324– 328
32. Stoch, P., 2008,Opt. Appl, 38, 134–139
33. Siqueira, R.L., Yoshida, I.V.P., Pardini, L.C., and Schiavon, M.A., 2007,J.Mater. Res., 10, 147–151. 34. Peak, D., Luther, G., and Sparraks, D., 2003,
Geochim. Cosmochim. Acta, 67, 2551–2560. 35. Khabuanchalad, S., Khemthong, P.,
Prayoonpokarach, S., and Wittayakun, J., 2008,
Suranaree J. Sci. Technol., 15, 3, 225–231.
36. Ndazi, B.S., Karlsson, S., Tesha, J.V., and Nyahumwa, C.W., 2006,Composites Part A, 29, 1– 11.
37. Adam F., and Hann, C.J., 2004,J. Colloid Interface Sci., 280, 55–61.
38. ICDD, Material Data Inc (1997), Livermore, CA. 39. Goncalves, M.R.F, and Bergmann, C.P., 2006,
Constr. Build. Mater.,30, 1–7.