Chapter III
Chapter III
Chapter Outline
Chapter Outline
1) Overview
1) Overview
2) Research Design: Definition
2) Research Design: Definition
3) Research Design: Classification
3) Research Design: Classification
4) Exploratory Research
4) Exploratory Research
5) Descriptive Research
5) Descriptive Research
i. CrossSectional Design
i. CrossSectional Design
ii. Longitudinal Designii. Longitudinal Design
iii. Advantages and Disadvantages of iii. Advantages and Disadvantages of Longitudinal Longitudinal and CrossSectional Designs
and CrossSectional Designs
6) Causal Research
6) Causal Research
7) Relationships Among Exploratory, Descriptive, and
7) Relationships Among Exploratory, Descriptive, and
Causal Research
8) Potential Sources of Error8) Potential Sources of Error
i. Random Sampling Errori. Random Sampling Error
ii. Nonsampling Errorii. Nonsampling Error
a. Nonresponse Errora. Nonresponse Error
b. Response Errorb. Response Error
9) Budgeting and Scheduling9) Budgeting and Scheduling 10) Marketing Research Proposal
10) Marketing Research Proposal
11) International Marketing Research 11) International Marketing Research 12) Ethics in Marketing Research
12) Ethics in Marketing Research
13) Internet and Computer Applications 13) Internet and Computer Applications 15) Focus on Burke
15) Focus on Burke
14) Summary 14) Summary
15) Key terms and Concepts
15) Key terms and Concepts
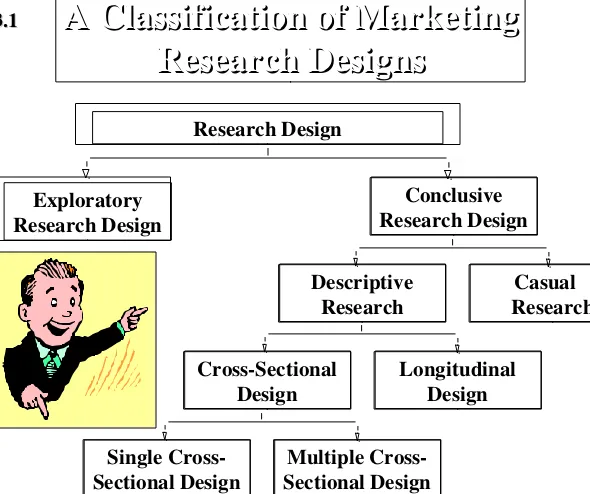
Research Design
Conclusive Research Design
Descriptive
Research ResearchCasual
CrossSectional
Design Longitudinal Design
Single Cross
Sectional Design Sectional DesignMultiple Cross Exploratory
Research Design
A Classification of Marketing
A Classification of Marketing
Research Designs
[image:4.720.75.665.17.511.2]Research Designs
Fig. 3.1
Objective:
Character istics:
Findings /Results:
Outcome:
To provide insights and understanding.
Information needed is defined only loosely.
Research process is flexible and unstructured. Sample is small and non
representative. Analysis of primary data is qualitative.
Tentative.
Generally followed by further exploratory or conclusive research.
To test specific hypotheses and examine relationships.
Information needed is clearly defined. Research process is formal and structured. Sample is large and representative. Data analysis is quantitative.
Conclusive.
Findings used as input into decision making.
Exploratory
Exploratory ConclusiveConclusive
Difference between Exploratory and
Conclusive Research
Table 3.1
Objective Objective::
Characteristics Characteristics::
Methods Methods::
Discovery of Discovery of ideas and ideas and insights insights Flexible, Flexible, versatile versatile Often the front Often the front end of total end of total research design research design Expert surveys Expert surveys Pilot surveys Pilot surveys Secondary data Secondary data Qualitative Qualitative research research Describe market Describe market characteristics or characteristics or functions functions Marked by the prior Marked by the prior formulation of formulation of specific specific hypotheses hypotheses Preplanned and Preplanned and structured design structured design Secondary data Secondary data Surveys Surveys Panels Panels Observation and Observation and other data other data Determine cause Determine cause and effect and effect relationships relationships Manipulation of Manipulation of one or more one or more independent independent variables variables Control of other Control of other mediating mediating variables variables Experiments Experiments Exploratory
Exploratory DescriptiveDescriptive CausalCausal
A Comparison of Basic Research Designs
A Comparison of Basic Research Designs
Table 3.2
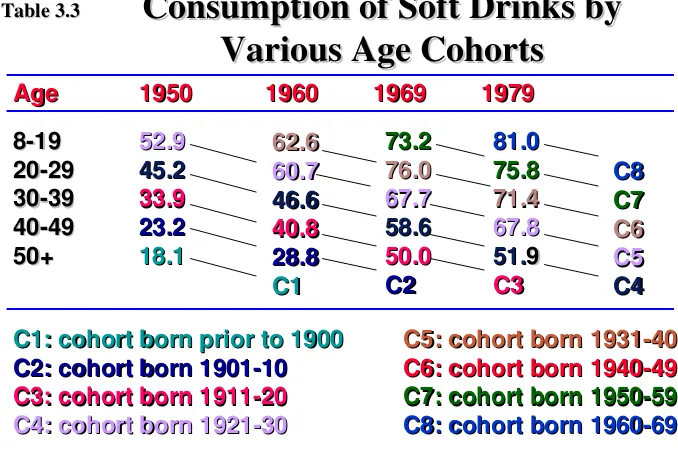
819 819 2029 2029 3039 3039 4049 4049 50+ 50+ Age
Age 19501950 19601960 19691969 19791979 52.9 52.9 45.2 45.2 33.9 33.9 23.2 23.2 18.1 18.1 62.6 62.6 60.7 60.7 46.6 46.6 40.8 40.8 28.8 28.8 C1 C1 73.2 73.2 76.0 76.0 67.7 67.7 58.6 58.6 50.0 50.0 C2 C2 81.0 81.0 75.8 75.8 71.4 71.4 67.8 67.8 51.
51.99
[image:7.720.29.707.27.479.2]Evaluation
Evaluation
Criteria
Criteria CrossSectional DesignCrossSectional Design Longitudinal DesignLongitudinal Design
Detecting Change Detecting Change Large amount of data collection Large amount of data collection Accuracy Accuracy Representative Sampling Representative Sampling Response bias Response bias + + + + + + + + + + Note: A “+” indicates a relative advantage over the Note: A “+” indicates a relative advantage over the other design,
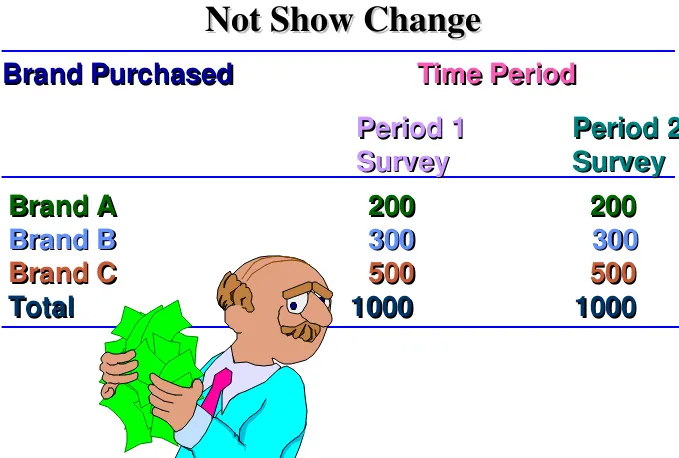
Brand Purchased
Brand Purchased
Time Period
Time Period
Period 1
Period 1
Period 2
Period 2
Survey
Survey
Survey
Survey
Brand A
Brand A
200
200
200
200
Brand B
Brand B
300
300
300
300
Brand C
Brand C
500
500
500
500
Total
Total
1000
1000
1000
1000
CrossSectional Data May
CrossSectional Data May
[image:9.720.22.701.57.515.2]Not Show Change
Not Show Change
Table 3.5
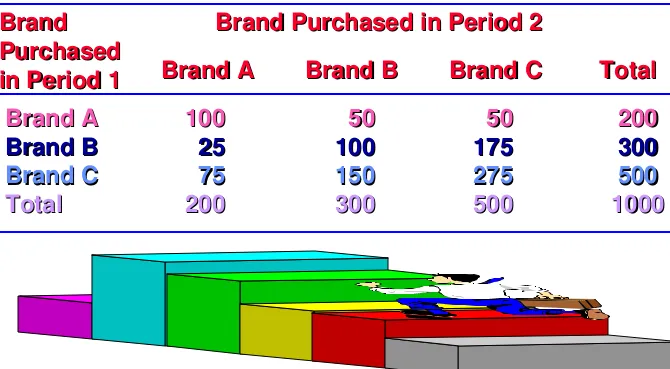
Brand Brand Purchased Purchased in Period 1 in Period 1 Brand Purchased in Period 2 Brand Purchased in Period 2 Brand A
Brand A Brand BBrand B Brand CBrand C Total Total Brand A Brand A Brand B Brand B Brand C Brand C Total Total 100 100 2525 7575 200 200
5050 100 100 150 150 300 300
5050 175 175 275 275 500 500
200200
[image:10.720.31.701.140.509.2]RIP 3.1
RIP 3.1
The National Association of Stock Car Auto Racing
The National Association of Stock Car Auto Racing
(NASCAR) in the past has appealed to Southerners
(NASCAR) in the past has appealed to Southerners
with lower incomes that work in laborertype jobs
with lower incomes that work in laborertype jobs. . NASCAR, in an attempt to increase its audience, NASCAR, in an attempt to increase its audience, chose to makeover its stereotyped image and used chose to makeover its stereotyped image and used
exploratory and descriptive research to
exploratory and descriptive research to generate generate ideas for reaching a more affluent market.
ideas for reaching a more affluent market.
Extensive focus groups revealed that: Extensive focus groups revealed that:
(1) NASCAR had a rural sports image,
(1) NASCAR had a rural sports image,
(2) that this image was not necessarily
(2) that this image was not necessarily
negative, and
negative, and
(3) companies that supported sports were
(3) companies that supported sports were
viewed positively
viewed positively.. NASCAR conducted exploratory
NASCAR conducted exploratory
research to identify ways to penetrate
research to identify ways to penetrate
the nonrace market, reach younger
the nonrace market, reach younger
fans, and build its brand image
fans, and build its brand image
across the nation.
RIP 3.1 Contd.
RIP 3.1 Contd.
Survey research showed that Survey research showed that 29% of fans had income over
29% of fans had income over
$50,000
$50,000
27% worked as professionals or
27% worked as professionals or
managers
managers. .
73% had a positive rural sports
73% had a positive rural sports
image of NASCAR
image of NASCAR , ,
71% of fans purchased products of
71% of fans purchased products of
companies that support the sport
NASCAR, of course, sought to increase these
NASCAR, of course, sought to increase these
percentages and developed marketing plans
percentages and developed marketing plans
that would build on the image of NASCAR as a
that would build on the image of NASCAR as a
rural sport by emphasizing that most of America
rural sport by emphasizing that most of America
is suburbs and small towns.
is suburbs and small towns.
NASCAR moved to
NASCAR moved to
reach all of America,
reach all of America,
not just the traditional
not just the traditional
Southern market.
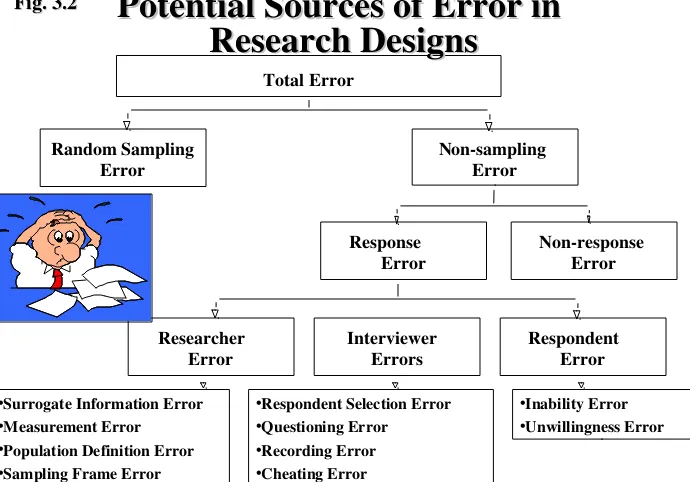
Nonsampling Error
Nonresponse Error
Interviewer
Errors Respondent Error Researcher
Error
Total Error
Random Sampling Error
•Surrogate Information Error •Measurement Error
•Population Definition Error •Sampling Frame Error •Data Analysis Error
•Respondent Selection Error •Questioning Error
•Recording Error •Cheating Error
•Inability Error
•Unwillingness Error
Response Error
Potential Sources of Error in
Potential Sources of Error in
[image:15.720.16.706.29.511.2]Research Designs
Research Designs
Fig. 3.2
Marketing Research at
Marketing Research at CiticorpCiticorp is typical in that it is is typical in that it is used to measure consumer awareness of products, used to measure consumer awareness of products, monitor their satisfaction and attitudes associated monitor their satisfaction and attitudes associated with the product, track product usage and diagnose with the product, track product usage and diagnose problems as they occur. To accomplish these tasks problems as they occur. To accomplish these tasks Citicorp makes extensive use of exploratory, Citicorp makes extensive use of exploratory, descriptive, and causal research. Often it is descriptive, and causal research. Often it is advantageous to offer special financial packages to advantageous to offer special financial packages to specific groups of customers. In this case, a financial specific groups of customers. In this case, a financial
package is being designed for senior citizens. package is being designed for senior citizens.
The following
The following seven step processseven step process was taken by was taken by marketing research to help in the design.
marketing research to help in the design.
Citicorp Banks on Exploratory, Descriptive, and
Citicorp Banks on Exploratory, Descriptive, and
Causal Research
Causal Research
RIP 3.2
1) A taskforce was created to better define the market
1) A taskforce was created to better define the market
parameters to include all the needs of the many
parameters to include all the needs of the many
Citicorp branches. A final decision was made to
Citicorp branches. A final decision was made to
include Americans 55 years of age or older, retired and
include Americans 55 years of age or older, retired and
in the upper half of the financial strata of that market
in the upper half of the financial strata of that market..
RIP 3.2 Contd.
2)
2) Exploratory research in the form of secondary data Exploratory research in the form of secondary data analysis of the mature or older market was then
analysis of the mature or older market was then
performed and a study of competitive products was performed and a study of competitive products was
conducted
conducted. Exploratory qualitative research involving . Exploratory qualitative research involving
focus groups was also carried out in order to determine
focus groups was also carried out in order to determine
the needs and desires of the market and the level of
the needs and desires of the market and the level of
satisfaction with the current products.
satisfaction with the current products.
In the case of senior In the case of senior citizens, a great deal citizens, a great deal
of diversity was found of diversity was found
in the market. This in the market. This
was determined to be was determined to be
due to such factors as due to such factors as affluence, relative age, affluence, relative age,
and the absence or and the absence or
3) The next stage of research was brainstorming. This
3) The next stage of research was brainstorming. This
involved the formation of many different financial
involved the formation of many different financial
packages aimed for the target market. In this case, a
packages aimed for the target market. In this case, a
total of 10 ideas were generated.
total of 10 ideas were generated.
RIP 3.2 Contd.
4) The feasibility of the 10 ideas generated in step 3 was then tested. The ideas were tested on the basis of
whether they were possible in relation to the business. The following list of questions was used as a series of hurdles that the ideas had to pass to continue on to the next step.
• Can the idea be explained in a manner that the target market will easily understand it?
•
• Is there an available description of a specific target market for the proposed product?
• Does the research conducted so far indicate a
potential match for target market needs and is the idea perceived to have appeal to this market?
• Is there a feasible outline of the tactics
and strategies for implementing the program?
• Have the financial impact and cost of the program been thoroughly evaluated and determined to be in line with company practices?
In this study, only one idea generated from the
brainstorming session made it past all the listed
hurdles and on to step 5.
RIP 3.2 Contd.
5) A creative workplan was then generated. This plan was to emphasize the competitive advantage of the proposed product as well as better delineate the specific features of the product.
RIP 3.2 Contd.
RIP 3.2 Contd.
6) The previous exploratory research was now
followed up with descriptive research in the form of mall intercept surveys of people in the target market range. The survey showed that the list of special
Greenfield Online Research Center, Inc. Greenfield Online Research Center, Inc. (http://www.greenfieldonline.com), based in (http://www.greenfieldonline.com), based in Westport, Connecticut, is a subsidiary of the Westport, Connecticut, is a subsidiary of the Greenfield Consulting Group. The Online Greenfield Consulting Group. The Online Research Center conducts focus groups, Research Center conducts focus groups, surveys, and polls over the Internet. The surveys, and polls over the Internet. The company has built up a “panel” of close to company has built up a “panel” of close to 200,000 Internet users, from which it draws 200,000 Internet users, from which it draws survey samples. The samples may be used for survey samples. The samples may be used for descriptive research designs like single or descriptive research designs like single or multiple cross sectional designs, as well as multiple cross sectional designs, as well as longitudinal designs. Causal designs can also longitudinal designs. Causal designs can also be implemented. Respondents may also be be implemented. Respondents may also be
chosen from the registered Internet users. chosen from the registered Internet users. The Green Field of Online Research
The Green Field of Online Research RIP 3.3
Internet users wishing to take part in surveys and Internet users wishing to take part in surveys and other projects begin by registering online at the other projects begin by registering online at the company’s Web site. The registration consists of a company’s Web site. The registration consists of a “signup survey” that asks for email address, type of “signup survey” that asks for email address, type of computer used, personal interests and information computer used, personal interests and information about the respondent’s household. Once an Internet about the respondent’s household. Once an Internet user is registered, Greenfield Online matches the user user is registered, Greenfield Online matches the user with research studies that are wellsuited to his or her with research studies that are wellsuited to his or her
interests. interests.
Incentives to take part in focus groups or special Incentives to take part in focus groups or special surveys are offered by the companies whose products surveys are offered by the companies whose products or services are being researched. This incentive is or services are being researched. This incentive is cash or valuable prizes. Incentives are also offered to cash or valuable prizes. Incentives are also offered to Internet users to encourage them to register with Internet users to encourage them to register with Greenfield’s Internet panel. New registrants Greenfield’s Internet panel. New registrants automatically qualify for prizes that are awarded in automatically qualify for prizes that are awarded in
monthly drawings. monthly drawings.
RIP 3.3 Contd.