11 (2001) 89 – 104
Multinational corporations versus domestic
corporations: a comparative study of R&D
investment activities
Sung C. Bae
a,*, Seungwook Noh
baDepartment of Finance,College of Business Administration,Bowling Green State Uni6ersity, Bowling Green,OH43403,USA
bInternational Business Di6ision,Hyundai Motor America,Fountain Valley,CA92728,USA
Received 4 November 1998; accepted 18 October 1999
Abstract
This paper empirically examines the effect of the degree of a firm’s multinationality on the firm’s R&D activities. In particular, based on the Internalization (and the Eclectic) approach to the development of multinational corporations this paper examines whether R&D investment influences the market value of firms differently between domestic corporations (DCs) and multinational corporations (MNCs). This paper further investigates how differ-ently firm-related factors based on the Tobin’s Q theory affect a firm’s R&D investment between DCs and MNCs. The results show that R&D expenditures as a percentage of sales are, on average, significantly greater for MNCs than for DCs, indicating that MNCs are on average more R&D intensive. After controlling for firm and market-related factors, R&D expenditures are found to have a persistently positive effect on the market value of both DCs and MNCs, with a more pronounced effect for MNCs. These findings are consistent with the predictions by the Internalization theory. The results further show that there exist notable differences in R&D determinants between DCs and MNCs. While prior-year R&D expendi-tures and cash flows are significantly positively related to current-year R&D expendiexpendi-tures for both DCs and MNCs, prior-year debt ratio has a significant negative impact on DCs’ current-year R&D expenditures, but has little impact on MNCs’ R&D expenditures. These results suggest that a firm’s degree of multinationality plays an important role in determining the firm’s R&D expenditures. © 2001 Elsevier Science B.V. All rights reserved.
www.elsevier.com/locate/econbase
* Corresponding author. Tel.: +1-419-3728714; fax:+1-419-3722875. E-mail address:[email protected] (S.C. Bae).
JEL classification:F21; F23
Keywords:R&D investments; Multinational corporations; Domestic corporations
1. Introduction
Corporate research and development (R&D) investment plays a pivotal role in a firm’s future growth. Finance and economics literature has documented that a firm’s R&D investment has a positive and consistent influence on the market value of the firm (see Chan et al., 1990; Doukas and Switzer, 1992; Chauvin and Hirschey, 1993; Szewczyk et al., 1996). For example, Chauvin and Hirschey report a significant and positive relationship between market values and R&D expendi-tures of roughly 1500 US firms over a 3-year period from 1988 through 1990. While the evidence on the effectiveness of R&D investments is abundant, little attention has been given to the R&D activities between multinational corporations (MNCs) and domestic corporations (DCs). This study intends to fill this gap.
MNCs may have different R&D activities than DCs for several reasons. Accord-ing to the Internalization theory and the Eclectic theory (e.g. Buckley and Casson, 1976; Dunning, 1977; Rugman, 1981; Buckley, 1989), an MNC is created whenever markets are internalized across national boundaries; a firm’s location strategy is determined mainly by the interplay of comparative advantage, barriers to trade, and regional incentives to internalize, and the firm will be multinational whenever these factors make it optimal to locate different stages of production in different nations. Hence, MNCs operate an international intelligence system for the acquisi-tion and collecacquisi-tion of basic proprietary knowledge relevant to R&D, and for the exploitation of the commercially applicable knowledge generated by R&D. There-fore, the possession of proprietary information is the key reason why MNCs can survive the competition of DCs in host countries. The theory predicts that the more research-intensive firms will be more multinational than the average, or vise versa. It is also conceivable that MNCs have a broad market environment and have affiliates located in multiple economies, compared to DCs which operate in one economy, hence providing better diversification opportunities for MNCs. These characteristics of MNCs could lead to higher R&D investments for MNCs than for DCs.
On the other hand, MNCs are exposed to additional risk including political risk and foreign exchange risk, which would not exist in a domestic market. These characteristics of MNCs may limit the amount of R&D that MNCs can invest. Whether and how corporate R&D investment is related with the extent to which a firm’s operations are internationalized is an empirical matter.
influence a firm’s R&D investment between DCs and MNCs. Two alternative classification criteria of foreign sales ratio and foreign tax ratio are used to distinguish between MNCs and DCs.
The results of this paper show that, consistent with the Internalization theory, the average R&D expenditures as a percentage of sales are significantly greater for MNCs than for DCs. Regression analysis shows that after controlling for firm and market-related factors, R&D investment has a persistently positive effect on the market value of both DCs and MNCs, with a more pronounced effect for MNCs. These results indicate that while capital markets value long-term investment of both domestic and multinational firms highly, the association between a firm’s R&D investment and value is stronger for MNCs than for DCs. The results further show that there are notable differences in R&D determinants between DCs and MNCs. For both DCs and MNCs current-year R&D expenditures are significantly posi-tively related to prior-year R&D expenditures and cash flows. On the contrary, prior-year debt ratio has a significant negative impact on DCs’ current-year R&D expenditures, but has little impact on MNCs’ current-year R&D expenditures. These results suggest that a domestic firm with a relatively high debt ratio in the prior year is less likely to invest in R&D in the current year than an MNC with a similar debt ratio.
Section 2 reviews related studies and develops testing hypotheses on R&D activities of MNCs vs. DCs. Section 3 discusses the data, and Section 4 presents the research methodology and empirical results, with conclusions in Section 5.
2. Related studies and development of testing hypothesis
A number of previous studies have examined the effect of a firm’s R&D investment on its market value. Chan et al. (1990) find that share-price responses to 95 announcements of increased R&D spending are significantly positive even when the announcement occurs in the face of an earning’s decline. These results suggest that investors look beyond the short term earning’s impact of major strategic investment when valuing a firm’s stock. Chauvin and Hirschey (1993) also find a significant and positive relationship between R&D expenditures and market value of approximately 1500 US firms over a 3-year period from 1988 through 1990. Their results suggest that investors evaluate the R&D effort of firms with a long-term perspective. Szewczyk et al. (1996) document significant positive an-nouncement effects associated with increases in firms’ R&D and investment oppor-tunities. They also report a significant relationship of the market’s response to R&D announcements to the firm’s debt ratio and the level of institutional ownership.
The second set of studies examines different characteristics between MNCs and DCs. Lee and Kwok (1988) question whether US-based MNCs have different capital structures than US-based DCs, and, if so, what causes the differences. Their study uses the foreign tax ratio (foreign income taxes divided by total income taxes) as a measure of a firm’s multinationality.1 Considering several international envi-ronmental variables, they examine two capital structure determinants — agency costs and bankruptcy costs. Their results show that while MNCs tend to have lower bankruptcy risk, are less leveraged, and have higher agency costs of debt than DCs, the difference in these factors largely disappears when the size effect is controlled. Michel and Shaked (1986) evaluate the differences in financial characteristics and performance between MNCs and DCs.2
Their results show that while DCs have superior risk-adjusted, market-based performance to MNCs, MNCs are more capitalized and less risky than DCs; the average S.D. of stock returns and the average systematic risk (beta) of DCs are significantly higher than those of MNCs. Horst (1972) shows that among US-based firms, firm size distinguishes MNCs from DCs. Blomstrom and Lipsey (1991), however, provide contrasting evidence on firm size; they find that once a firm has overcome initial barriers to foreign production, size has no effect on the fraction of the firm’s resources devoted to foreign activity. Given the different characteristics between MNCs and DCs in many aspects documented in previous studies, MNCs may have different R&D activities than DCs. The Internalization theory and the Eclectic theory of the international business literature provide theoretical bases for the development of MNCs that a firm’s internalization of markets leads to the internationalization of the firm (see Buckley and Casson, 1976; Dunning, 1977; Rugman, 1981; Buckley, 1989). Accord-ing to the theory, an MNC is created whenever markets are internalized across national boundaries, providing a firm with firm specific advantages in knowledge and proprietary information.3
This firm specific know-how has both a stock and a flow component; the stock, a result of past intra-firm investment in R&D, is added to by a flow of new proprietary information and continuing R&D expenditures. This know-how advantage would enable MNCs to transform the output of R&D into a new form of production at a lower cost than DCs (mainly owing to economies of scale) and to reduce communication costs between R&D, production
1In the study of Lee and Kwok (1988), the DC sample consists of companies with a foreign tax ratio
of less than 1%, and the MNC sample includes companies with a foreign tax ratio greater than 25%.
2Their sample consists of 58 MNCs and 43 DCs, which are all publicly held manufacturing companies
selected from Fortune 500 companies. The MNC sample includes firms with both foreign sales being at least 20% of total revenues and direct investments in at least six countries outside the US.
3The Internalization approach to modern theory of the MNC rests on two general axioms: (1) firms
and marketing. Moreover, this know-how constitutes a barrier to entry to the industry because potential entrants have to incur costs in order to compete with know-how possessing firms (Porter, 1980).
As Buckley and Casson (1976) argue, the theory postulates that a firm’s location strategy is determined mainly by the interplay of comparative advantage, barriers to trade, and regional incentives to internalize, and hence the firm will be multina-tional whenever these factors make it optimal to locate different stages of produc-tion in different naproduc-tions. Indeed, there are certain markets in which the incentive to internalize is particularly strong. For example, the production of knowledge through R&D, and its implementation in new processes or products, are lengthy projects which require detailed long-term appraisal and careful short-term synchro-nization; hence, effective planning requires internalization of the market. MNCs operate an international intelligence system for the acquisition and collection of basic proprietary knowledge relevant to R&D, and for the exploitation of the commercially applicable knowledge generated by R&D.
In sum, the internalization paradigm predicts that because both a firm’s multina-tionality and growth are linked to the firm’s R&D through the internalization of knowledge, the more research-intensive firms will exhibit higher rates of growth and profitability and will be more multinational than the average, and the value of the firm will vary directly with the scale of R&D. It is also conceivable that unlike DCs, MNCs have a broad market environment and have affiliates located in multiple economies. The performance of these multiple economies gives rise to diversifica-tion opportunities for MNCs, which would in turn generate more stable cash flows for MNCs (Lee and Kwok, 1988). In addition, since cash flows of MNCs are internationally diversified, MNCs are in a better position than DCs to support higher debt (Michel and Shaked, 1986). Owing to these characteristics of MNCs, MNCs would be able to support higher R&D investment than DCs would.
On the other hand, MNCs are exposed to additional risk such as political risk and foreign exchange risk, which would not exist in a domestic market (Michel and Shaked, 1986). Furthermore, in view of international market imperfections and the complexity of international operations and corporate governance systems, agency costs would be higher to monitor a firm’s activities for MNCs (Lee and Kwok, 1988) than for DCs. Therefore, these additional risk and costs associated with the operations of MNCs would limit the amount that MNCs can invest on their R&D projects. Whether and how corporate R&D investment is related with the extent to which a firm’s operations are internationalized is an empirical matter and is explored in this paper.
3. Data
foreign tax ratios was obtained from Standard and Poor’s Compustat Industrial tapes.
In classifying the sample firms into the MNC and DC subsamples, two criteria were used for each firm: foreign sales ratio (foreign sales divided by total sales) and foreign tax ratio (foreign income taxes divided by total income taxes). As a domestic firm foresees growth potential in international operations, the firm needs to take a full advantage of its overseas markets and, hence, needs to produce abroad as well as sell abroad. Thus, as the firm expands its operations across borders, it could be classified as a MNC (Eiteman et al., 1995, p. 4). This classification is, however, vague since a very small sized company can be a MNC if it has overseas operations. Previous studies have used size (Horst, 1972), foreign sales (Michel and Shaked, 1986), foreign tax (Lee and Kwok, 1988), and outward direct foreign investment (Koechlin, 1995) to distinguish between MNCs and DCs. In particular, a firm’s foreign sales ratio has been widely used as a measure of MNCs because other data are less easily available. Foreign sales, however, include both sales by foreign subsidiaries and sales related to exports from the parent company. Using this measure may lead to mixing international trade with interna-tional investment. To avoid this potential problem and as a way to ensure the robustness of empirical evidence, this paper employs both foreign sales ratio and foreign tax ratio as classification criteria.
In this paper, the DC sample consists of companies which have a foreign tax ratio of less than 1% (Lee and Kwok, 1988) or which have a foreign sales ratio of less than 10 percent over the period examined. The MNC sample includes compa-nies with a foreign tax ratio greater than 25% (Lee and Kwok, 1988) or with a foreign sales ratio greater than 20% (Michel and Shaked, 1986).
The final sample for this study consists of either 563 or 498 manufacturing firms depending on the classification criteria of foreign sales ratio and foreign tax ratio, respectively.4 Of the total 563 firms based on foreign sales ratio, 250 belong to the DC sample and 313 to the MNC sample. Of the total 498 firms based on foreign tax ratio, 294 belong to the DC sample and 204 to the MNC sample.
4. Research methodology and results
4.1. Measuring effects of R&D in6estment on market 6alue of MNCs and DCs
This section examines the influence of R&D activities on market values of firms between MNCs and DCs. The market value of a firm may also be affected by factors other than R&D such as cash flows, growth, and risk (Chauvin and Hirschey, 1993). Given below are discussions on these three factors which are used as control variables in cross-sectional regression analysis.
4Since R&D investments are heavily concentrated in manufacturing firms, non-manufacturing firms
1. Cash flow: a firm’s current cash flow is used as an indicator of the firm’s ability to generate future cash flows. Cash flow is measured as operating income before depreciation minus interest expenses, taxes, preferred dividends and common dividends and is expressed as a percentage of total assets.
2. Growth: a firm’s future growth may affect positively the firm’s market value if investments are expected to make above-normal rates of return. Growth is measured as the least-squares estimate of the 5-year rate of growth in sales for each firm.
3. Risk: a firm’s valuation influence may be associated with the degree of stability that the firm’s stock returns exhibit. Risk is measured as the S.D. of a firm’s monthly stock returns over a 2-year period.5
Based on these considerations, the following cross-sectional regression model is estimated separately for MNC and DC samples to examine the influence of R&D investment on the market value of firm i:
MVBVi=b0+b1(Cash Flow)i+b2(Growth)i+b3(Risk)i+b4(R&D)i+ei
(1)
where MVBV, market to book value of equity, is measured as the product of common stock price and common shares outstanding plus book value of preferred stock, divided by book value of equity, and R&D is measured as R&D expenditures divided by sales.6
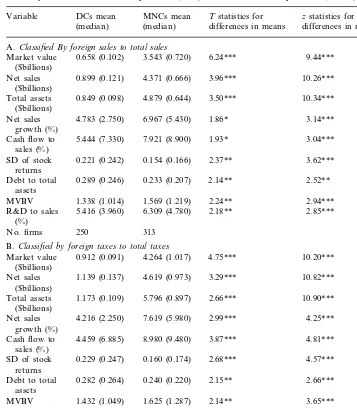
Table 1 presents summary statistics for sample firms. Regardless of the classifica-tion employed, the average size of MNCs proxied by market value, net sales, and total assets is significantly greater than that of DCs. It is also shown that MNCs, on average, have higher sales growth, greater cash flow to total assets, lower risk (measured by S.D. of monthly stock returns over a 2-year period), and lower debt to total assets than DCs. The statistics on median values of these variables show similar evidence. These findings are in general consistent with those documented in previous studies (e.g. Michel and Shaked, 1986; Lee and Kwok, 1988).
Regardless of the classification used, R&D expenditures as a percentage of sales (often known as R&D intensity) are greater for MNCs than for DCs, and the difference is statistically significant at least at the 0.05 level in both the standard
t-test and the non-parametric Wilcoxon two-sample test. These results indicate that MNCs are on average more R&D intensive than DCs, consistent with the predic-tion by the Internalizapredic-tion theory of the internapredic-tional business literature.
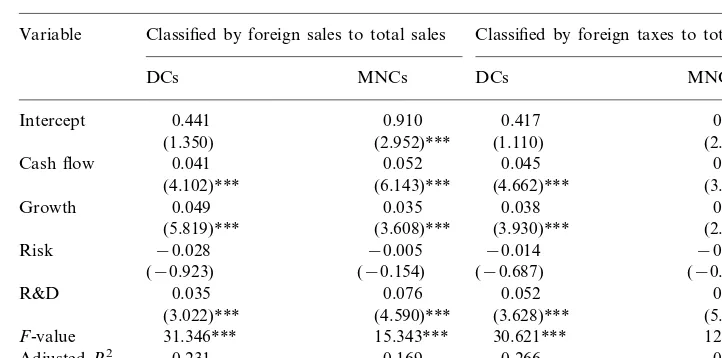
Table 2 shows regression results of market value of MNCs and DCs classified by foreign sales ratio and foreign tax ratio. The results show that after controlling for
5In order to check for robustness of regression results, a firm’s risk was also measured by two other
alternatives: the earnings volatility over a 5-year period and a firm’s beta representing its systematic risk. The regression analyses using these alternative risk measures provided results qualitatively similar to those using stock return volatility.
6While a firm’s absolute market value was used in previous studies (e.g. Chauvin and Hirschey, 1993),
Table 1
Summary statistics of domestic corporations (DCs) and multinational corporations (MNCs)a
MNCs mean
Variable DCs mean Tstatistics for zstatistics for differences in means
(median)
(median) differences in medians
A. Classified By foreign sales to total sales
Market value 0.658 (0.102) 3.543 (0.720) 6.24*** 9.44*** ($billions)
10.26*** 3.96***
Net sales 0.899 (0.121) 4.371 (0.666) ($billions) Debt to total 0.289 (0.246) 0.233 (0.207) 2.14**
assets
B.Classified by foreign taxes to total taxes
10.20*** 0.912 (0.091)
Market value 4.264 (1.017) 4.75*** ($billions)
10.82*** Net sales 1.139 (0.137) 4.619 (0.973) 3.29***
($billions)
MVBV 1.432 (1.049) 1.625 (1.287) 3.65***
2.25**
5.194 (3.770) 6.165 (4.655) 2.41**
R&D to sales (%)
No. firms 294 204
aThe sample in A consists of 563 US manufacturing firms (250 DCs which have a foreign sales ratio
less than 10% and 313 MNCs which have a foreign sales ratio greater than 20%); the sample in B consists of 498 US manufacturing firms (294 DCs which have a foreign tax ratio less than 1% and 204 MNCs which have a foreign tax ratio greater than 25%); market value is measured by the product of common stock price and the common shares outstanding plus the book values of preferred stock; net sales growth is the average of 5-year sales growth; MVBV is measured by a firm’s market value divided by book value of equity; SD of stock returns is measured as S.D. of a firm’s monthly stock returns over a 2-year period.
Table 2
Regression analysis of market value of domestic corporations (DCs) and multinational corporations (MNCs)a
MVBVi=b0+b1(Cash Flow)i+b2(Growth)i+b3(Risk)i+b4(R&D)i+ei
Classified by foreign taxes to total taxes Classified by foreign sales to total sales
Variable
aThe dependent variable, MVBV, is measured by the product of common stock price and the
common shares outstanding plus the book value of preferred stock, divided by the book value of equity; cash flow is measured as net income plus depreciation divided by total assets; growth is measured as 5-year sales growth; risk is measured as the S.D. of month stock returns over a 2-year period; R&D is measured as R&D expenditure divided by sales.
*** Significance at the 0.01 level; ** Significance at the 0.05 level; * Significance at the 0.10 level.
potential factors which might influence a firm’s market value, the relationship between R&D and the firm’s market value is positive and significant at the 0.01 level for both DC and MNC sample firms. These findings strongly support the notion that corporate R&D investment helps enhance the firm’s market value, regardless of whether the firm belongs to a DC or MNC group.
marketing (Buckley, 1989). The results are also in line with the observation that the link between domestic firms and domestic investment remains quite tight (Koechlin, 1995).
Table 2 also shows that there are differences on the effects of other control variables on the market value of a firm. To be more specific, both Cash Flow and Growth have significant positive impacts on the market value of a firm, regardless of the degree of a firm’s multinationality; a firm’s sales growth, however, generates a much greater impact on the market value of DCs than MNCs. It is also worthwhile to note that unlike DCs, the intercept terms for MNCs are all significant at the 0.01 level, suggesting that additional variables might be needed to fully count for the market values of MNCs.
4.2. Measuring determinants of R&D in6estment for MNCs and DCs
This section investigates whether the degree of a firm’s multinationality is associated with financial and market-related factors as determinants of the firm’s R&D investment. As MNCs and DCs operate in different environments and are exposed to different types of risk, different factors are expected to affect their long-term investment such as R&D.
R&D can be considered as an element of corporate investment. The Tobin’s Q theory is widely used to explain the cross-sectional investment behavior of firms (Tobin, 1969; Poterba and Summers, 1983). According to the Tobin’s Q theory, a firm should invest when the marginal benefit of investing exceeds the marginal cost. Variables commonly suggested to influence the costs of investing are stock returns, debt ratio, cash flow, and taxes. Based on the Q theory, the following four variables are used as indicators of R&D activity of a firm.
1. Stock returns: positive stock returns of a firm may signal the firm’s growth opportunities, and an increase in R&D would help take advantage of growth opportunities. Hence, a firm’s stock returns are expected to be positively related to its future R&D expenditure (Lach and Schankerman, 1989).
2. Debt ratio: R&D investment can be regarded as an intangible asset. When there are costs of financial distress, intangible assets quickly lose value and cannot be easily used to satisfy debtor claims. Thus, it would be sub-optimal for firms that are involved in R&D activities to carry a high debt ratio (Smith and Warner, 1979). Therefore, a negative relationship is expected between a firm’s debt ratio and its R&D investment.
3. Cash flow: cash flow is expected to be positively related to a firm’s future R&D investment. Fazzari et al. (1988) and Whited (1992) provide empirical evidence that a firm’s internally generated cash flow has a significant positive effect on corporate capital expenditure.
As a firm’s R&D activity in a given year would be, to a large extent, influenced by — or adjusted by — the firm’s characteristics discussed above in the previous year, an analysis of regressing the firm’s current year’s R&D expenditure against its previous year’s attributes would provide more meaningful evidence.7 Hence, R&D investment of firm iis examined with lagged independent variables in the following regression model:
R&Di=g0+g1R&D(−1)i+g2DEBT(−1)i+g3ASR(−1)i+g4CF(−1)i
+g5TAX(−1)i+hi (2)
where X(−1) denotes a 1-year lagged variable of X, R&D is measured as R&D expenditures divided by sales, DEBT (debt ratio) as book value of debt divided by book value of total assets, ASR (stock return) as annual stock returns in domestic currency, CF (cash flow) as net income plus depreciation divided by total assets, and TAX (taxes) as corporate income taxes divided by total assets.
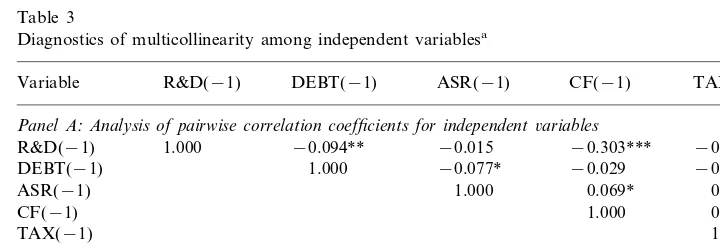
Before examining the determinants of R&D investment for MNCs and DCs through regression analysis, it is worthwhile to investigate the presence of multi-collinearity among independent variables in Eq. (2). Panel A of Table 3 presents the Pearson correlation coefficients along with their significance levels. As one would expect, R&D(−1) is highly correlated with DEBT(−1), CF(−1) and TAX(−1). In addition, the other four variables are also highly correlated with each other. Therefore, it may be difficult to separate the influences of these variables on R&D. However, examination of pairwise simple correlation coefficients will not neces-sarily disclose the existence of relations among groups of independent variables.
Table 3
Diagnostics of multicollinearity among independent variablesa
R&D(−1) DEBT(−1)
Variable ASR(−1) CF(−1) TAX(−1)
Panel A:Analysis of pairwise correlation coefficients for independent6ariables
R&D(−1) 1.000 −0.094** −0.015 −0.303*** −0.168*** −0.077* −0.029 −0.022
DEBT(−1) 1.000
ASR(−1) 1.000 0.069* 0.031
1.000 0.054* CF(−1)
TAX(−1) 1.000
Panel B:Multicollinearity diagnostics using6ariance inflation factor(VIF) 0.206
0.385
0.816 0.151
R2 0.649
1.626 1.178
5.435 2.849
VIF 1.259
aR2is the coefficient of multiple determination when each independent variable is regressed on the
other independent variables in the model; VIF=(1−R2)−1.
* Significance at the 0.10 level. ** Significance at the 0.05 level. *** Significance at the 0.01 level.
7Regressions of R&D investment were also run using concurrent year’s independent variables. The
Hence, additional diagnostics were performed for multicollenarity by examining variance inflation factors (VIFs). These factors measure how much the variances of the estimated regression coefficients are inflated compared to the variances when the independent variables are not linearly related. It can be shown that the VIF for an estimated regression coefficient, g%k, is: (VIF)k=(1−R2
k)
−1
, k=1, 2, . . ,n, where n represents the number of independent variables. R2
k is the coefficient of
multiple determination when thekth independent variable is regressed on the other independent variables in the model. Hence, VIFk is equal to 1 when R
2
k=0, i.e.
when the kth variable is not linearly related to the other independent variables. A VIF value in excess of 10 is often taken as an indication of severe multicollinearity (see Neter et al., 1990).
Panel B of Table 3 reportsR2
and VIF values for each independent variable. VIF values range from 1.178 for TAX(−1) to 5.435 for R&D(−1), but none of the VIFs is in excess of 10, indicating no severe multicollinearity among groups of independent variables. A further examination of the mean of the VIF values provides additional evidence supporting that multicollinearity among independent variables in Eq. (2) does not seem to be unduly influencing the estimates of regression coefficients.8
Table 4 shows regression results of R&D investment for MNCs and DCs classified by both foreign sales ratio and foreign tax ratio. A total of five lagged independent variables explain more than 78% of variations in a firm’s current year R&D investment for both DCs and MNCs, with substantially greater explanatory power for MNCs than for DCs.
Looking first at the results based on the classification criteria of foreign sales ratio, prior year R&D investment, R&D(−1), is positively related with current-year R&D investment for both DCs and MNCs, and the relationship is statistically significant at the 0.01 level. These results indicate that greater prior-year R&D expenditure leads to greater current-year R&D expenditure, consistent with the evidence documented in Bhagat and Welch (1995). Prior-year cash flow, CF(−1), is also significantly positively related to current-year R&D expenditures, which lends support for the notion that a firm’s internally generated cash flows are the most likely source of R&D investment. These findings are consistent with the empirical evidence documented in Fazzari et al. (1988) and Whited (1992).9
Notable differences are, however, found for the relationships of a firm’s R&D to its capital structure (measured by the firm’s debt ratio) between DCs and MNCs. While prior-year debt ratio, DEBT(−1), is negatively related to current-year R&D
8The mean of the VIF values provides information about the severity of the multicollinearity in terms
of how far the estimated regression coefficients are from the true coefficients. Mean VIF values considerably larger than 1 are indicative of a serious multicollinearity problem (Neter et al., 1990). The mean of the VIF values in the regressions is 2.469, which is not regarded as considerably larger than 1.
9These results are in sharp contrast to those by Bhagat and Welch (1995), who found that a firm’s
Table 4
Regression analysis of determinants of R&D investment for domestic corporations (DCs) and multinational corporations (MNCs)a
R&Di=g0+g1R&D(−1)i+g2DEBT(−1)i+g3ASR(−1)i+g4CF(−1)i+g5TAX(−1)i+hi
Classified by foreign taxes to total taxes Classified by foreign sales to total sales
Variable
No. firms 250 313 294 204
aR&D is measured as R&D expenditures divided by sales; DEBT (debt ratio) is measured by book
value of debt divided by book value of total assets; ASR (stock return) is measured as annual investment return; CF (cash flow) is measured as net income plus depreciation divided by total assets; TAX is measured as corporate income taxes divided by total assets; X(−1) is a 1-year lagged variable ofX.
*** Significance at the 0.01 level. ** Significance at the 0.05 level; * Significance at the 0.10 level.
expenditures for both DCs and MNCs, the relationship is statistically significant at the minimum level of 0.10 for DCs only. Hence, a domestic firm with a higher debt ratio in the prior year is less likely to invest in R&D projects in the current year than an MNC does. The evidence on the significant negative relationship between DEBT(−1) and R&D for DCs is consistent with the implications of Myers (1977) and Smith and Warner (1979) and with the empirical findings of Bhagat and Welch (1995). Indeed, as a debt may bring in financial distress costs, a domestic firm with a relatively high debt ratio would be less likely to finance its future growth opportunities through debt financing. On the contrary, the degree of financial leverage in the prior year appears to have little, if any, negative impact on the R&D expenditures for MNCs. As MNCs are on average less leveraged than DCs, MNCs would be more capable of investing in R&D projects through additional debt financing without endangering their capital structure position.
however, statistically significant at the 0.10 level. Hence, these findings indicate that prior-year stock returns and taxes do not play a significant role in determining current-year R&D expenditures for either DCs or MNCs. The findings on the insignificant relationship between TAX(−1) and R&D are consistent with those in Bhagat and Welch (1995).
Turning to the regression results for sample firms classified by foreign tax ratio, the estimated regression coefficients of explanatory variables are in line with those for firms classified by foreign sales ratio with respect to their signs and significance levels. To be more specific, R&D(−1) and CF(−1) have significant (at the 0.01 level) positive coefficients for both DCs and MNCs; CF(−1) has significant (at least at the 0.05 level) negative coefficients for both DCs and MNCs; DEBT(−1) carries negative signs for both DCs and MNCs, but is significant at the 0.01 level only for DCs. The other two variables, ASR(−1) and TAX(−1), carry mixed signs, but neither of the two coefficients is statistically significantly different from zero at the 0.10 level. Hence, the regression results of R&D determinants remain robust, regardless of the classification criteria for a firm’s multinationality.
5. Summary and conclusions
A firm’s R&D investment plays a pivotal role in the firm’s innovation activities, representing future growth opportunities. This paper has first developed a testing hypothesis built upon the Internalization (and the Eclectic) theory of the develop-ment of MNCs, and then empirically examined the effects of the degree of a firm’s multinationality on the firm’s R&D activities. The results show that R&D expendi-tures as a percentage of sales are, on average, greater for MNCs than for DCs, and the difference is statistically significant. Regression analysis shows that after con-trolling for firm and market-related factors, R&D investment has a persistently positive effect on the market value for both DCs and MNCs, with a more pronounced effect for MNCs. These results indicate that while long-term invest-ments of firms such as R&D are valued highly in capital markets regardless of their multinationality, they make relatively more contributions to the market values of MNCs. Hence, a firm’s degree of multinationality plays, at least to some extent, a role in determining the effect of R&D investment. These findings are in general consistent with the predictions by the Internalization theory of the multinational operations.
The results further show that there exist similarities but, at the same time, notable differences in R&D determinants between DCs and MNCs. For both DCs and MNCs current-year R&D expenditures are significantly positively related to prior-year R&D expenditures and cash flows. A firm’s prior-prior-year debt ratio is, however, significantly negatively related to the current-year R&D expenditures only for DCs. Hence, the degree of financial leverage appears to have little impact on MNCs’ R&D expenditures.
effectiveness of R&D investments for DCs and MNCs across different nations. The evidence from this analysis would provide additional insights into the importance of a firm’s multinationality in promoting the nation’s overall innovation activities.
Acknowledgements
We wish to thank Hoje Jo, Stephen E. Skomp, and an anonymous referee of the Journal for their helpful comments. Bae gratefully acknowledges research support from the Ohio Board of Regents Research Challenge Grant Program. The usual disclaimer applies.
References
Bhagat, S., Welch, I., 1995. Corporate research & development investments: international comparisons. Journal of Accounting and Economics 19 (Mar – May), 443 – 470.
Blomstrom, M., Lipsey, R.E., 1991. Firm size and foreign operations of multinationals. Scandinavian Journal of Economics 93 (Jan), 101 – 107.
Buckley, P.J., 1989. The Multinational Enterprise: Theory and Applications. Macmillan, London. Buckley, P.J., Casson, M., 1976. The Future of the Multinational Enterprise. Holmes & Meier, New
York.
Chan, S.H., Martin, J.D., Kensinger, J.W., 1990. Corporate research and development expenditures and share value. Journal of Financial Economics 26 (August), 255 – 276.
Chauvin, K.W., Hirschey, M., 1993. Advertising, R&D expenditures and the market value of the firm. Financial Management 22 (Winter), 128 – 140.
Doukas, J., Switzer, L.N., 1992. The stock market’s view of R&D spending and market concentration. Journal of Economics and Business (May), 95 – 114.
Dunning, J.H., 1977. Trade, location of economic activity and the multinational enterprise: a search for an eclectic approach. In: Ohlin, B., Hesselborn, P.O., Wkjkman, P.M. (Eds.), The International Allocation of Economic Activity. Macmillan, London.
Dunning, J.H., Bansal, S., 1997. The cultural sensivity of the eclectic paradigm. Multinational Business Review 5 (Winter), 1 – 16.
Eiteman, D.K., Stonehill, A.I., Moffett, M.H., 1995. Multinational Business Finance, 7th edition. Addison-Wesley, Menglo Park, CA.
Fazzari, S.M., Hubbard, R.G., Petersen, B.C., 1988. Financing constraints and corporate investment. Brookings Papers on Economic Activity 1, 141 – 195.
Horst, T., 1972. Firm and industry determinants of the decision to invest abroad. Review of Economics and Statistics 54, 258 – 266.
Koechlin, T., 1995. The globalization of investment. Contemporary Economic Policy 13 (January), 92 – 100.
Lach, S., Schankerman, M., 1989. Dynamics of R&D and investment in the scientific sector. Journal of Political Economy 97, 880 – 904.
Lee, K.C., Kwok, C.Y., 1988. Multinational corporations vs. domestic corporations: International environmental factors and determinants of capital structure. Journal of International Business Studies 19 (Summer), 195 – 217.
Michel, A., Shaked, I., 1986. Multinational corporations vs. domestic corporations: Financial perfor-mance and characteristics. Journal of International Business Studies 17 (Fall), 89 – 99.
Poterba, J.M., Summers, L.H., 1983. Dividend taxes, corporate investment and ‘Q’. Journal of Public Economics 22, 135 – 167.
Rugman, A.M., 1981. Inside the Multinationals: The Economics of Internal Markets. Columbia University Press, New York.
Smith, C.W., Warner, J.B., 1979. On financing contracting: an analysis of bond covenants. Journal of Financial Economics 7, 117 – 161.
Szewczyk, S.H., Tsetsekos, G.P., Zantout, Z., 1996. The valuation of corporate R&D expenditures: evidence from investment opportunities and free cash flow. Financial Management 25 (Spring), 105 – 110.
Whited, T.M., 1992. Debt, liquidity constraints, and corporate investment: evidence from panel data. Journal of Finance 47, 1425 – 1460.