365
The Role of Service Marketing Elements on Customer Loyalty towards Garuda
Indonesia
Andrian Gunawan
International Business Management Program, Petra Christian University Jl. Siwalankerto 121-131, Surabaya
E-mail: [email protected]
ABSTRACT
Service Marketing mix is one of many important factors for service based companies to be able determining the strategy of the company. The elements in the service marketing mix is believed to lead to customer loyalty toward a brand. Garuda Indonesia, which is one of the airline companies in Indonesia, has to compete with other airline companies in order to attract customers and keep them loyal to their product. In this research, the data is obtained by using simple random sampling method by distributing questionnaires to some respondents in Surabaya. Then, the data is analyzed by using Multiple Linear Regression Analysis. The result is expected to be able showing that the service marketing mix has a significant influence on customer loyalty.
Keywords: Service Marketing Mix, Customer Loyalty, 7Ps, Multiple Linear Regression
ABSTRAK
Bauran pemasaran jasa merupakan merupakan salah satu faktor penting bagi perusahaan jasa untuk dapat menentukan strategy perusahaan. Elemen-elemen dalam bauran pemasaran jasa diyakini dapat membawa menuju loyalitas pelanggan terhadap suatu merk. Garuda Indonesia yang merupakan salah satu perusahaan penerbangan di Indonesia, harus bersaing dengan perusahaan penerbangan lain untuk menarik minat pelanggan dan membuat mereka tetap loyal terhadap produk mereka. Data dalam penelitian ini diperoleh menggunakan metode simple random sampling dengan mendistribusikan kuesioner kepada sejumlah responden di Surabaya. Data t e r s e b u t kemudian dianalisa dengan menggunakan Regresi Linear Berganda . Hasil penelitian menunjukkan bahwa bauran pemasaran jasa mempunyai pengaruh yang signifikan terhadap loyalitas pelanggan.
Kata Kunci: Bauran Pemasaran Jasa, Loyalitas Pelanggan, 7Ps, Regresi Linear Berganda
INTRODUCTION
Nowadays, as transportation takes important role in daily lives, it has been demanded to be rapid, reliable yet affordable (Ishutkina & Hansman, 2008). Air transportation is the most preferable media because it is matched with those criterias needed. This brings advantages for the business of air transportation or aviation industry. Furthermore, according to Prideaux (1999), without air transport, tourist destination will be highly restricted to road and sea transport.
The trend is also occurred in Indonesia. Aviation industry in Indonesia is considered as prospective domestic industry (Saraswati & Hanaoka, 2013). As Indonesia enriches with 17,508 islands and total population of more than 237 million, transportation is very crucial to connect people especially air-based transportation. Proved by the increasing number of passengers from the past years, it has been spotted as an opportunity by domestic and foreign airline companies. Moreover, the infrastructure of air
transportation in Indonesia is the best among other kinds of transportation.
As the airline industry is prospective, each airline companies will have to formulate their strategies in order to attract the customers. The strategy of 7Ps will be used in this research, because it is believed as essential tool to measure the performance in service based industry including airline industry. In 7Ps, the companies can choose in which aspects they want to differentiate for example in product, place, promotion, price, physical evidence, process, or people. By using the best combination of 7Ps strategy, service-based firm is believed to be able influencing the customers to make repeat purchases and become loyal customers toward the company (Khan & Mahmood, 2014).
366
share of airline in Indonesia both in the domestic and International. The market share of domestic is dominated by Lion Air, while the market share of international is dominated by Air Asia, in which both of them are low cost airlines. It is implicitly stated that Garuda Indonesia as full service airlines still could not dominate those low-cost airlines. Therefore, the issue to be solved is how Garuda Indonesia managed to improve their performance in order to dominate the market both in domestic and international. The researcher will look upon their applying strategy of service marketing mix toward the customer loyalty.
The focus area of this research is Surabaya, which categorizes as one of the biggest cities in Indonesia. Surabaya is considered as populous city, with 3 million inhabitants. Most of them are people research namely service marketing mix (7Ps) theory and customer loyalty theory.
The Theory of Service Marketing Mix (7Ps)
According to Cambridge Dictionary (n.d.), Service Marketing Mix is “a selection of services developed to offer customers a choice within a particular range, with its elements namely product, price, place, promotions, participants, physical evidence, and process.”
The definitions and indicators of each variables in the 7Ps are adopted from several authors. Product is the combination of goods and services that offered by the firm to the target market (Kotler & Armstrong, 2010). Price is the amount the consumer must exchange to receive the offering (Friesner, 2014). Place is the distribution channels that are primarily set up to perform economic functions in society, bridging the gap between production and consumption (Kotler, Armstrong, Wong, & Saunders, 2008). Promotion is a range of activities that implemented by the firms’ marketers to inform their products and attract potential customers to buy (Singh, 2012). Physical evidence is the environment in which the service is delivered, where the firm and customers interact, and any tangible components to facilitate the performance or communication of the service (Azila-Gbettor, Kwodjo Avorga, Danku, & Atatsi, 2013). Process is concerning of how far the firm can go as a customer-oriented and systematic procedures to pursue a successful service delivery process. It is represented in the day-to-day operations, mechanism, and flow of activities (Ramseook-Munhurrun, Lukea-Bhiwajee, & Naidoo, 2010). People is the one of the key factors that can distinguish service marketing from physical product
marketing and include as a main parameter to rate in the service marketing mix (Booms and Bittner, 1981).
The Theory of Customer Loyalty
According to Kotler and Keller (2008), customer loyalty is “a deeply held commitment to re-buy or re-patronize a preferred product or service in the future despite situational influences and marketing efforts having the potential to cause switching behavior”.
The research of Kotler and Keller (2009) has shown that the indicators of customer loyalty are as follows, willingness to keep buying the product/service over a long time, willingness to do positive word-of-mouth, willingness to propose an idea for the company to develop the product.
The purpose of research is to know whether service marketing simultaneously has significant impact on customer loyalty and to identify which 7Ps variable influenced the most on customer loyalty towards Garuda Indonesia. The service marketing mix elements represent the overall marketing strategy adopted by the company, in this case is Garuda Indonesia. The 7Ps, which consist of product, price, place, promotions, physical evidence, people, and process, are believed to have impacts to the customers’ satisfaction towards the certain brands (Thamrin, 2012). As the 7Ps are believed to be able representing the strategy of the firm, therefore, the combination of these elements can lead to acquire customer loyalty in the end (Mohsan, Nawaz, Khan, Shaukat, & Aslam, 2011). More numbers in loyal customers will give a benefit as it can make long-term sustainability for the firm. Whilst the company loses one customer to be loyal to their product, it leads them to switch to other brands. Therefore, the researcher believes that service marketing mix variables are essential for the company to improve customer loyalty.
The hypothesis of this research will be as follows: H1: Service Marketing Mix simultaneously has
significant influence on the Customer Loyalty of Garuda Indonesia
H2: Product, Price, Place, Promotion, Physical
Evidence, Process, and People have significant influence on the Customer Loyalty of Garuda Indonesia
367
customer satisfaction, and it is proven in the result of strong coefficient of determination (R-Square) of customer satisfaction, in which 85% of customer satisfaction can be explained by the variation of indicators in the 7Ps.
The second research is from Mamoun N. Akroush, (2011). He analyzes the quantitative empirical study of service marketing mix towards the business performance which includes financial performance and customer performance. The authors did comprehensive research to the motor insurance companies in Jordan. 164 questionnaires were distributed, with 146 of them were valid. The results were strong and positive relationship between service marketing mix elements and business performance. In customer performance, which related in the focus of service marketing mix towards the customer loyalty. The data were collected from 150 customers of 6 branches of 3 prominent private banks in 3 big cities of Rajasthan. As the result, all independent variables in the 7Ps lead to customer loyalty and each of them have different important roles. The most influential variable that leads to customer loyalty is process, or in this case, the smoothness of transactions in the bank. Following process, there are people, physical evidence, product, place, pricing, and promotion. Furthermore, the combination of 7Ps variables can simultaneously lead to customer loyalty.
Those supporting theories and three previous researches have been adopted by the researcher as the background and content are relevant with this study.
RESEARCH METHOD
The explanatory method will be used as the purpose of this study to analyze the relationship between service marketing mix (7Ps) and customer loyalty of Garuda Indonesia as well as determining the variable which has strongest impact. The researcher will collect data from samples in certain area to test the determined hypothesizes based on supporting theories as the basis. Hereby are the indicators that will be used to measure the variables in the 7Ps as well as customer loyalty.
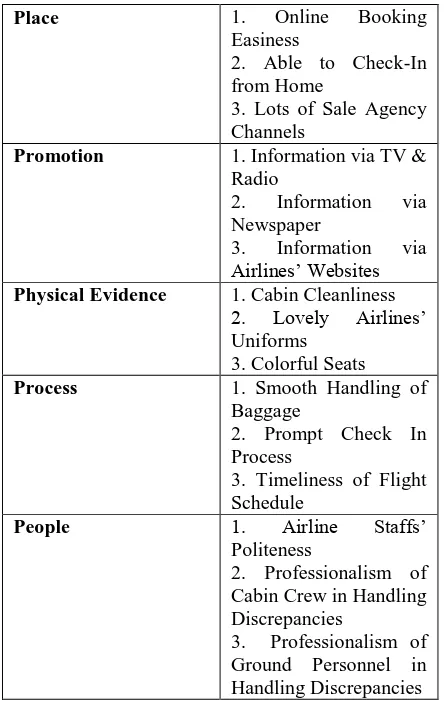
Table 1. Indicators of Independent Variables
7Ps Indicators
Product 1. Safety
2. Offer More Schedules 3. Spacious Seat
Price 1. Appropriate Price
2. Special Package
Promotion 1. Information via TV & Radio
2. Information via Newspaper
3. Information via Airlines’ Websites Physical Evidence 1. Cabin Cleanliness
2. Lovely Airlines’
2. Professionalism of Cabin Crew in Handling Discrepancies
3. Professionalism of Ground Personnel in Handling Discrepancies
The indicators of customer loyalty are adopted from the theory of Kotler & Keller. However, there is one indicator added from Rai and Srivastava (2012) because it is believed that it is able to measure the customer loyalty and related to this study. In the end, the indicators of customer loyalty in this study are as follows, willingness to keep buying the product/service over a long time, willingness to do positive word-of-mouth, willingness to propose an idea for the company to develop the product, willingness to resist the switching behavior to other brands.
There are two types of data used in this study, nominal and interval data. The first type is nominal, for example the gender of respondents, which is coded with 1 or 2 that each represents man or woman. The other questions besides gender are the range of age, occupations, purpose of travel, intensity of travelling by air transportation, experience in using Garuda Indonesia.
368
independent variables, which further will be calculated to get the average score representing in each variables.
Then, this research will gather the data from two sources, primary and secondary. The primary data will be acquired from the primary sources which represents an opinion or position of an individual (Cooper & Schindler, 2014). In this research, primary sources include the raw data from the respondents who fill in the questionnaire regarding the case of this research. The respondents include people who aged equal to or more than 21 years old and have ever bought and experience flying with Garuda Indonesia. The data will be obtained by spreading the questionnaires to the respondents through self-administrated and online questionnaires, in which the respondents are asked to honestly and sincerely fill in the questionnaires developed by the researcher in order to get the most accurate information for the research.
The researcher will use Google Docs as the online questionnaire to be disseminated. In the questionnaire, there are two type of questions which are multiple choice questions or screening questions and 5-point Likert scale questions.
The other one is secondary sources, which can be taken from the existing relevant studies (Cooper & Schindler, 2014). The researcher can get the information from trustable journal, article, websites, or books. This secondary data are mostly about the historical background, supporting theories, airline industry overviews, and the company analysis, in this case, Garuda Indonesia. The combination of those two sources are believed by the researcher to be able producing valuable outcome in the analysis of the impacts from service marketing mix (7Ps) to customer satisfaction as well as customer loyalty with or without mediation effect.
In term of sampling, the researcher decides to use probability sampling, with simple random sampling method, which everyone in the population have the equal chances to be picked as samples (Cooper & Schindler, 2014). The researcher will use the population of Surabaya, where the researcher resides, to pick the samples of who have become the customers of Garuda Indonesia.
Specifically, the samples to be taken are people who are ever bought the tickets and experience the flights with Garuda Indonesia. The main reason of choosing Surabaya as the research focus is because it is considered as one of the most populous cities in Indonesia, as well as a city with most of its people are from middle to middle up social class, in which become the main target market of Garuda Indonesia. The proportions of researcher distributed the questionnaires are 50 self-administrated and 75 using Google Docs into several places such as airport, malls, tour and travel fair.
Regarding the age range of respondents, the researcher limits the age range is starting from 21 years old and above. The reasons behind are because the
researcher is believed that target people of airlines industry is broad and people in this minimum age will be the ones who are fully understand to answer the questions (Kankaew, 2013). So, the samples of this research will be all of people within the age of 21 years old and above, who ever bought the tickets and experience the flights with Garuda Indonesia, and reside in Surabaya. As the sample will be taken from those following criteria by using simple random sampling method, all people with these provisions will have the same chance of being picked as the samples of the research (Cooper & Schindler, 2014).
The number of samples taken in this research is 125 as it has to follow the rule of minimum sample size from Pallant (2005), which is using the formula of [50 + 8 (IV)] or turns out to got the minimum sample size of 106 samples.
First of all, those data have to pass the validity and reliability test. The validity test can be done by comparing the value of r in each indicators from the questionnaire (r-data) with the value of r stated in the table (r-table) (Ghozali, 2013). The r-data can be seen in the SPSS output when computing the value of Cronbach Alpha, precisely in the column of corrected item-total correlation. On the other hand, r-table is taken from r value of 2-tailed r table with the degree of freedom of n-2, with n represents the number of samples. The r-data must be higher than r-table in order to result in valid indicators in the research.
Then, the reliability test is conducted bylooking at the correlation between variables which can be measured directly with Cronbach’s Alpha. The higher or closer to 1 in the Cronbach’s Alpha means that the measuring instrument is better in term of reliability. The standard of the variable can be called as reliable is 0.7 (Ghozali, 2013).
After that, the data can be analyzed by using classic assumption tests, which include normality, autcorrelation, multicollinearity, and heteroscdasticity test.
In order to conduct normality test statistically, the researcher uses Kolmogorov-Smirnov test, in which looking the significance value has to be higher than 0.05 in this research in order to pass the normality test.
As the researcher takes more than 100 samples, Lagrange Multiplier test will be used as the measurement of autocorrelation in this research. Durbin-Watson test, which is a commonly used by lots of researches, is suitable for smaller scope of the research within or less than 100 samples. The Lagrange Multiplier test, which will be conducted using SPSS, will use the residuals value to find the lag residuals 2 (res_2). Then, the researcher will look at the significance value, if it shows the number above 0.05, the researcher passes the autocorrelation test (Ghozali, 2013).
369
variable can explain other independent variable. The tolerance factor measures the variability of chosen independent variable that is not explained by other independent variable. In order to indicate multicollineary in the research, the tolerance factor value must not exceed 0.1.
On the other hand, VIF explains how much the variance of an estimated regression coefficient increases if the independent variables are correlated (Ghozali, 2013). The value of VIF is inversely proportional to the tolerance factor. Higher tolerance value is equal to low VIF.
Last but not least, the heteroscdasticity test, will use Park test, in which the the parameter coefficients of all independent variables should be not significant or having the P-value more than the significant level of 0.05 in order to pass the test.
Next, in order to answer the questions of this research, the researcher has to look into the Goodness-of-Fit, which includes F-test, t-test, and adjusted R-square.
As the research is going to use the 95% confidence level, therefore, the significance level (α) to be looked at is 5%. In the F-test analysis, it can be done by comparing value with the table. The value of F-value has to be greater than F-value in F-table, in order to reject the null hypothesis and lower than the value in F-table to accept the null hypothesis. Besides, the significance F also has to be lower than 0.05 in order to reject the null hypothesis (Ghozali, 2013).
The t-test can be done by comparing t-value to the t-critical value in the table. If the t-value is greater than the t-table, the researcher has to reject the null hypothesis (Ghozali, 2013). The easiest way is by looking at the significance t (P-value), which should be lower than 0.05, in this research.
The last is the adjusted R-square, which has the measurement range from 0 to 1. The lower the value, meaning that the independent variables are not strong enough in explaining the dependent variable. If the value is closer to 1, the independent variables are believed to be able providing most of the information about the dependent variable (Ghozali, 2013).
RESULTS AND DISCUSSION
From 125 copies of questionnaires, 114 of them are categorized as valid, the rests are not valid because some respondents never use and experience Garuda Indonesia.
Table 2. ANOVA Table
Model Sum of Squares df Mean Square F Sig.
1 Regression 56.192 7 8.027 71.884 .000a
Residual 11.837 106 .112
Total 68.029 113
a. Predictors: (Constant), AVGPeople, AVGPhysEvid, AVGPlace,
AVGProcess, AVGPrice, AVGPromotion, AVGProduct
b. Dependent Variable: AVGCustLoyal
From the ANOVA table, it is shown that service marketing mix (7Ps) simultaneously has significant influence toward customer loyalty, proven at the significance F (P-value) is lower than 0.05 and F-value is 71.834, which is higher than 2.0096. Then, it is confirmed by another previous research from Hani Al-Dmour, Zu`bi M. F. Al-Zu`bi, and Dana Kakeesh in 2013, that has shown the relationship between service marketing mixes (7Ps) toward customer loyalty. The result, which is also supported by significance F (P-value) and F value, has shown that 7Ps have a positive significant effect on customer loyalty. As it has been explained before, service marketing mix is essential to be used to measure the customer loyalty for service based companies.
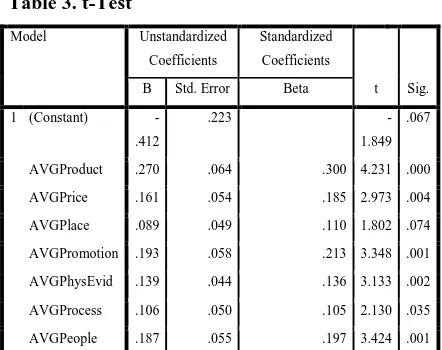
Table 3. t-Test
Model Unstandardized
Coefficients
Standardized
Coefficients
t Sig.
B Std. Error Beta
1 (Constant)
-.412
.223
-1.849 .067
AVGProduct .270 .064 .300 4.231 .000
AVGPrice .161 .054 .185 2.973 .004
AVGPlace .089 .049 .110 1.802 .074
AVGPromotion .193 .058 .213 3.348 .001
AVGPhysEvid .139 .044 .136 3.133 .002
AVGProcess .106 .050 .105 2.130 .035
AVGPeople .187 .055 .197 3.424 .001
a. Dependent Variable: AVGCustLoyal
After that, from the table of t-test, , it can be seen that place is the only variable that show significance F (P-value) more than 0.05, meaning it is not passing the t-test, or it can be said that in this case, the variable of place individually has no significance influence on customer loyalty. On the other hand, the variable of product, price, promotion, physical evidence, process, and people individually has significance influence on customer loyalty.
370
Niharika Maharishi and Nitin Bhardwaj, retail banking might have strategy to put numerous branches in order to be reachable by lots of customers and as the result they will be loyal to the banks which are near to their homes. As their strategy to put many branches in some areas is not implemented by their competitors, it leads them to have significant influence of place variable toward the customer loyalty of retail banking.
On the other hand, product is the variable that has biggest impact on customer loyalty towards Garuda Indonesia. According to Ahmed and Rahman (2015), it is affirmed that product is the core variable that the company can offer to the market, therefore, the product itself should be not ordinary and able to give solution to the market needs. Product is very important for every companies because it is a competitive tool for their growth and continuations as well as it can help them to gain opportunities that lead to increased market share and penetrate new markets. Therefore, the researcher suggests that Garuda Indonesia can improve and offer more on the product in order to provide the best service for the customers and compete with the competitors.
In this case, Garuda Indonesia can focus on the indicators of product in the questionnaires, in which they have to guarantee their flight safety, offer choices for the flight destinations, as well as the comfort of the seats while enjoying the flights.
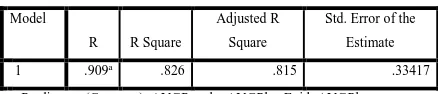
Table 4. Model Summary
Model
R R Square
Adjusted R
Square
Std. Error of the
Estimate
1 .909a .826 .815 .33417
a. Predictors: (Constant), AVGPeople, AVGPhysEvid, AVGPlace,
AVGProcess, AVGPrice, AVGPromotion, AVGProduct
It can be seen from the adjusted r square from this model is only 81.5%, therefore, there must be other factors that can lead to customer loyalty besides service marketing mix (7Ps).
For example, as customer loyalty deal with consumer behavior, there are possibilities that other related factors can lead to customer loyalty in the service based companies. According to Rani (2014), consumer behavior can also be affected by four factors, which are cultural, social, personal, and psychological. According to Kotler and Keller (2009), the influences of family, friends, siblings, and reference groups are having impacts on consumer behavior. Therefore, it is assumed by the researcher that those factors have the possibilities becoming the other reasons to achieve customer loyalty beside service marketing mix (7Ps).
CONCLUSION
In conclusion, the statements of research problem that should be answered in this research are whether the service marketing mix (7Ps) simultaneously has significant impact toward customer loyalty of Garuda Indonesia
and whether service marketing mix (7Ps) individually has significant impact toward customer loyalty of Garuda Indonesia. After collecting the supporting theories, developed the questionnaires and conducting the analysis, it turns out that the first problem has shown that service marketing mix (7Ps) simultaneously has significant impact toward customer loyalty of Garuda Indonesia based on the result of F-test in this research. However, according to t-F-test, the second problem shows that not all the variables of 7Ps have significant impact toward customer loyalty of Garuda Indonesia. The variable of place is not significant on customer loyalty towards Garuda Indonesia.
After the research problems have been answered, based on the research benefit, the researcher should come up with proper strategy for Garuda Indonesia, regarding on how the company can be efficient and effective in achieving customer loyalty in the airline industry. From the discussion of the result, it can be seen that Garuda Indonesia should focus on the variables in which the customers concern the most, which is product. Based on this research, product needs to be improved and focused on in order to achieve customer satisfaction and loyalty. The second influential variable is promotion, therefore, Garuda Indonesia needs to do effective promotions in every marketing channels such as communication media, printed media, and company’s website. Then, the variable of people, which become the most important factor in service industry because it can measure how good the service is, resulted in the customers’ feedbacks or critics. Following them, there are also price, physical evidence, and process that also contribute significant impact toward customer loyalty. The researcher has realized that there is limitation in this research, which are limited coverage area.
The limitation of this research is limited coverage area of the research. This research, which is only gathered the samples from Surabaya, is indeed very limited to represent the customers of Garuda Indonesia as they are spread around Indonesia and even abroad.
371
REFERENCES
Ahlberg, K. (2005). Pricing in Industrial Markets : A case study at Ovako Steel AB. Sweden: Lulea University of Technology.
Ahmed, S., & Rahman, M. H. (2015). The Effects of Marketing Mix on Customer Satisfaction : A Literature Review From Islamic Perspectives. Turkish Journal of Islamic Economics, 17-30. Al-Dmour, H., F. Al-Zu`bi, Z. M., & Kakeesh, D. (2013). The Effect of Services Marketing Mix Elements on Customer-Based Brand Equity: An Empirical Study on Mobile Telecom Service Recipients in Jordan. International Journal of Business and Management Vol 8 No 11, 13-26.
Angelova, B., & Zekiri, J. (2011). Measuring Customer Satisfaction with Service Quality Using American Customer Satisfaction Model (ACSI Model). International Journal of Academic Research in Business and Social Sciences.
Angkasa Pura. (2015). Angkasa Pura Website. Retrieved from Angkasa Pura Website: http://www.angkasapura2.co.id/id/tentang/sej arah
Asiegbu, I. F., Igwe, P., & Akekue-Alex, N. (2012). Physical Evidence and Marketing Performance of Commercial Airlines in Nigeria. American International Journal of Contemporary Research, 136-149.
Aviation Analysis. (2013, November 1). Retrieved
from Centre for Aviation:
http://centreforaviation.com/analysis/merpati -nusantara-airlines-faces-crisis-should-indonesia-pull-the-plug-136618
Azila-Gbettor, E. M., Kwodjo Avorga, S. M., Danku, L. S., & Atatsi, E. A. (2013). Physical Evidence and Quality Service Delivery in Public Hospitals in Ghana. International Review of Management and Marketing, 153-163.
Bieger, T., & Wittmer, A. (2006). Air Transport and Tourism - Perspectives and Challenges for Destinations, Airlines, and Governments. Journal of Air Transport Management. Borden, N. H. (1958). The Concept of Marketing Mix.
Harvard Business School - Journal of Advertising Research .
Business Dictionary. (n.d.). Retrieved from Business Dictionary:
http://www.businessdictionary.com/definitio n/customer-satisfaction.html
Business Dictionary. (n.d.). Retrieved from Business Dictionary:
http://www.businessdictionary.com/definitio n/customer-loyalty.html
Business Dictionary . (n.d.). Retrieved from Business
Dictionary :
http://www.businessdictionary.com/definitio n/services-marketing-mix.html
Cooper, D. R., & Schindler, P. S. (2014). Business Research Methods Twelfth Edition. USA: McGraw-Hill/Irwin.
E.Constantinides. (2006). The Marketing Mix Revisited : Towards the 21st Century Marketing. Journal of Marketing Management, 407-438.
Friesner, T. (2014, May 2). Marketing Teacher. Retrieved from Marketing Teacher Web Site: http://www.marketingteacher.com/marketing -mix/
Garuda Indonesia. (2013). Connecting Diversity. Annual Report.
Garuda Indonesia Websites. (2014). Retrieved from http://www.garudaindonesia.com.sg/about-us/awards.shtml
Ghozali, I. (2013). Aplikasi Analisis Multivariate Dengan Program IBM SPSS 21 Update PLS Regresi Edisi 7. Semarang: Badan Penerbit Universitas Diponegoro.
Goldsmith, R. E. (1999). The personalized marketplace : beyond the 4Ps. Marketing Intelligence & Planning , 178-185.
Gustavsson, S., & Lundgren, E. (2005). Customer Loyalty. Sweden: Lulea University of Technology.
Haig, M. (2003). Brand Failures.
Indonesia-Investments. (2015). Garuda Indonesia. Retrieved from Indonesia-Investments:
http://www.indonesia- investments.com/business/indonesian-companies/garuda-indonesia/item211 Indonesia's Aviation & Airports Sector. (2014). Global
Business Guide Indonesia.
Ishutkina, M., & Hansman, J. (2008). Analysis of Interaction between Air Transportation and Economic Activity. MIT Internation Center of Air Transportation.
Kankaew, K. (2013). Importance-Performance Analysis in Airlines Service Quality : A Case Study of Legacy Airlines in Thailand. The International Conference on Tourism, Transport, Logistics 2013. Paris: UP Organizer and Publication Co., Ltd.
Khan, S. M., & Mahmood, R. (2014). Impact of Service Marketing Mixes on Customer Perception : A Study on Eastern Bank Limited, Bangladesh. European Journal of Business and Management, 164-172.
Kotler, P. (2000). Marketing Management. India: Prentice Hall.
372
Kotler, P., & Armstrong, G. (2010). Principle of Marketing 13th Edition. Pearson Prentice Hall, 222.
Kotler, P., & Armstrong, G. (2011). Principle of Marketing 14th Edition. New Jersey: Prentice Hall.
Kotler, P., & Keller, K. L. (2008). Marketing Management 13th Edition. Prentice Hall. Kotler, P., & Keller, K. L. (2009). Marketing
Management. New Jersey: Pearson Education, Inc.
Kotler, P., & Keller, K. L. (2009). Marketing Management 14th Edition. New Jersey: Prentice Hall.
Kotler, P., Armstrong, G., Wong, V., & Saunders, J. (2008). Principle of Marketing (5th Edition). Lapian, S. J. (2014). Analysis of Garuda Indonesia Flight Service Performance through the Service Marketing Mix Framework. IOSR Journal Business and Management.
Lin, C.-C. (2003). The Role of Customer Perceived Value in Generating Customer Satisfaction : An E-Business Perspective. Journal of Research in Marketing & Entrepreneurship, 25-39.
Lin, S.-M. (2011). Marketing mix (7P) and performance assessment of western fast food industry in Taiwan: An application by associating DEMATEL and ANP. African Journal of Business Management, 10634-10644.
McKinsey & Company. (2012). The archipelago economy: Unleashing Indonesia's Potential . McKinsey Global Institute.
Mohsan, F., Nawaz, M. M., Khan, M. S., Shaukat, Z., & Aslam, N. (2011). Impact of Customer Satisfaction on Customer Loyalty and Intentions to Switch : Evidence from Banking Sector of Pakistan. International Journal of Business and Social Science, 263-270. Mostaghel, R. (2006). Customer Satisfaction : Service
Quality in Online Purchasing in Iran. Sweden: Lulea University of Technology. Ong, A. Y. (2014, July 17). Retrieved from Global
Indonesian Voices (World Airlines Awards 2014):
http://www.globalindonesianvoices.com/144 91/garuda-indonesia-worlds-best-airline-cabin-crew/
Onwutalobi, & Claret, A. (2006). Understanding Marketing Mix in Air Asia Airline Bhd. Codewit.
P., S., & W., P. (2012). Distribution Channels and Their Roles in the Entreprise. Polish Journal of Management Studies, 143-150. Integrated Approach. Hillsdale, NJ: Lawrence Erlbaum Associates.
Prideaux, B. (1999). Tracks to Tourism: Queensland Rail Joins the Tourist Industry. International Journal of Tourism Research.
Qualtrics. (2012, December 3). Qualtrics. Retrieved from How to Measure Customer Satisfaction: Do you Overlook these 4 Key Customer
Satisfaction Measurements?:
https://www.qualtrics.com/blog/customer-satisfaction-measurement/
Qualtrics. (2012, December 3). Qualtrics. Retrieved from How to Measure Customer Satisfaction: Do you Overlook these 4 Key Customer
Satisfaction Measurements?:
https://www.qualtrics.com/blog/customer-satisfaction-measurement/
Rai, A. K., & Srivastava, M. (2012). Customer Loyalty Attributes : A Perspective. NMIMS Management Review, 61-62.
Ramseook-Munhurrun, P., Lukea-Bhiwajee, S. D., & Naidoo, P. (2010). Service Quality in the Public Service. International Journal of Management and Marketing Research. Rani, P. (2014). Factors Influencing Consumer
Behaviour. International Journal of Current Research and Academic Review , 52-61. Reichheld, F. F. (1996). The Loyalty Effect. Harvard
Business Review, 58-59.
Saraswati, B., & Hanaoka, S. (2013). Aviation Policy in Indonesia and Its Relation to ASEAN Single Aviation Market . Proceedings of the Eastern Asia Society for Transportation Studies.
Silverman, S. N. (1995). An Historical Review and Modern Assessment of the Marketing Mix Concept. 7th Marketing History Conference Proceedings (p. 27). United States: University of Pittsburgh.
Singh, M. (2012). Marketing Mix of 4P's for Competitive Advantage. IOSR Journal of Business and Management, 40-45.
Skytrax. (2015). The World's Best Airline Cabin Staff in 2014. Retrieved from World Airline
Award :
373
Suhartanto, D., & Noor, A. A. (2012). Customer Satisfaction in the Airline Industry : The Role of Service Quality and Price. Asia Tourism Forum Conference.
Thamrin, H. (2012). The Role of Service Marketing Mix and Ship Service Quality towards Perceived Value and Its Impact to Ship Passenger's Satisfaction in Indonesia. Global Journal of Management and Business Research.
Warner, R. (2013). Applied Statistic.