383
Impact of Pt. Central Proteinaprima Customer Relationship Management
towards Customer Loyalty In Sidoarjo Area
Ivandy Santoso
International Business Management Program, Petra Christian University Jl. Siwalankerto 121-131, Surabaya
E-mail: [email protected]
ABSTRACT
Customer Relationship Management is considered as an important factor that can impact customer loyalty in purchasing a product. In Sidoarjo, PT. Central Proteinaprima, a fish feed company, also competes with other companies to attract customer loyalty. This research is conducted with the aim to find out the effect of customer relationship management on customer loyalty. The data was gathered using simple random sampling by distributing questionnaires to 150 respondents in Sidoarjo. The data was analyzed by using Multiple Linear Regression Analysis. The result shows that customer relationship management simultaneously has significant impact on customer loyalty. Furthermore, the result also shows that interaction management, relationship development, quality of services, and behavior of employees have significant impact toward customer loyalty.
Keywords:Customer Relationship Management, Customer Loyalty
ABSTRAK
Manajemen hubungan pelanggan merupakan faktor penting yang dapat mempengaruhi loyalitas pelanggan dalam membeli suatu produk. Di Sidoarjo, PT. Central Proteinaprima, sebuah perusahaan pakan ikan juga bersaing dengan perusahaan-perusahaan lainnya untuk mendapatkan loyalitas pelanggan. Penelitian ini dilakukan untuk mengetahui efek dari manajemen hubungan pelanggan terhadap loyalitas pelanggan. Data diperoleh menggunakan metode simple random sampling dengan mendistribusikan kuesioner kepada 150 responden di Sidoarjo. Data kemudian dianalisa dengan menggunakan analisa regresi berganda. Hasil penelitian menunjukkan bahwa manajemen hubungan pelanggan secara keseluruhan mempunyai pengaruh yang signifikan terhadap loyalitas pelanggan. Selain itu, hasil penelitian menunjukkan manajemen interaksi, pengembangan relasi, kualitas servis, perilaku pegawai mempunyai pengaruh yang signifikan terhadap loyalitas pelanggan.
Kata Kunci: Manajemen hubungan pelanggan, loyalitas pelanggan.
INTRODUCTION
Indonesia is well known as the largest archipelago with the total area of 1,919,440 square kilometers from Indian Ocean to the Pacific Ocean (UNDP, 2011). As the country has the big area, Indonesia also supported by the water area which is around 93,000 square kilometers including sea, river, and other water area compare to the land area that is around 1,826,440 square kilometers (Havel, 2008). Knowing the condition, there must be a lot of natural products and resources in the land and water area of Indonesia, not to mention rice, corn, fish, coral, and other natural products. Focus on the natural products
from fisheries, Indonesia has big potential resource on it and Indonesia is one of the biggest seafood producers in the world. According to Ministry of Marine Affairs and Fisheries, the total amount of fishery product in Indonesia is around 15.26 million tons in 2012 a year (Indonesia, Global Business Guide, 2014).
384 Table 1. Total Area of Fishery in Indonesia
Source: (Badan Pusat Statistik, 2015) With the increasing of total fishery area in Indonesia logically there will be a lot of fish feed production to fulfill the demand of fishery product. In fact, one hectare (ha) of fishery area will need approximately 2.7 tons / hectare / month (K.R. Sari, personal communication, February 20, 2015). Refer to the fact, the prospect of fish feed business in Indonesia is very good. For example, fish feed needed in 2010 is around 30 million tons.
Refer to those total fish feed needed in a year, many players/ company in the market try to fulfill the needs of fish feed production in Indonesia, and also to improve it. The prospect of fish feed industry is also supporting the situation. Gabungan Pengusaha Makanan Ternak (GPMT) said that there will be increasing in sales of fish feed around 20% with amount of 1.2 million tons compare to last year that is 1 million tons (Kontan, 2012). Therefore there are some big, medium, and small company that produced animal feed and doing competition each other to grab the market.
Table 2. Net Sales of CPP and Competitors (in millions rupiah)
Source: (Central Proteina Prima; Japfa Comfeed Indonesia; Sierad Produce, 2011, 2012, 2013)
Seeing table 1.2., there is a competition among those producers to grab the market of animal feed product including food for fish. In order to deal with this competition, one of the way to win is by getting the loyal customer. Barnes said that the 20% of loyal customers will give benefit by 80% for the company than usual customers that are not loyal (Barnes, 2001). That loyal customer will bring more profit for the company, therefore each company try to win the competition by grabbing the customer’s loyalty. Customer loyalty in the context of marketing can be defined as a response to promise or uphold the commitments under the continuous relation and usually reflected on the ongoing purchase of the same provider (Tjiptono, 2000).
One of the way to increasing customer loyalty was using the concept of Customer Relationship Management (CRM). CRM become the key strategy to retain customers and business philosophy by placing the customer as a center of the activities and it is a key to achieve sustainable competitive advantage in the competition (Wang, 2004). CRM may help the company to increase their customer loyalty by many factors.
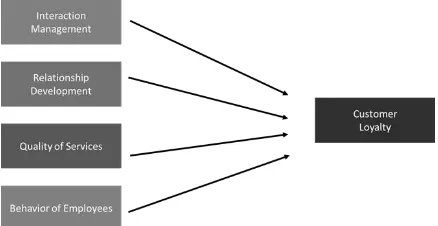
Previous research also stated that there are four critical elements that may affect customer loyalty. They are interaction management, relationship development, quality of services, and behavior of the employees (Sang Long & Khalafinezhad, 2013). Interaction management will find out how and when customers would like to interact with the organization, such as getting customer’s feedback. Relationship development connects the relationship between customer and supplier, including procedures, mechanisms, and schedules. Quality of service is showing the positive effect on customer satisfaction that will have significant relationship to customer loyalty. Those four factors will become the further variables that affect CRM in relationship with customer loyalty and being evaluated further.
LITERATURE REVIEW
The important and relevant concept in this research are fish feed industry, customer relationship management (CRM) and customer loyalty, where CRM consists of interaction management, relationship development, quality of services, and behavior of employees.
Customer Relationship Management
According to Brown S.W., (2000), CRM was a process get, maintain, and develop profitable customers which needs a great quality of service that could attract customers to increase their loyalty.
CRM also is a concept for managing a company’s interactions with customers, clients, and sales prospects. The objectives of CRM are to enhance company’s profit, income, and satisfaction level of customer, where to attain CRM, organization use set of tools, technologies, and procedures to support the relationship with customer to enhance sales. Therefore CRM is important for business in the company (Dowling, 2002, pp. 121-137).
Interaction Management
Brown and Gulycz (2002) stated that if a company wants to make a good and continuous relationship with customers, they must have different ways to interact with them including interaction along touch points and distribution channels. Moreover, the goal of doing those interaction is to find out how and when the customers would like to interact with the company (Prahalad & V, 2001). Those interaction should be fit in customer’s want and run smoothly using the touch point, where the touch point can be developed from the data or records of the previous customer. This touch points will be useful for distributing different products, services and communication with the customers (Peppers & Rogers, 1997).
According to the works of Lindgreen et al.
385 provide variety of entertainment and promotion to the customers, increase the interaction with customers by attractive ways such as using social network, record the customer purchasing trend to evaluate their bonuses and vouchers entitlement.
Relationship Development
Relationship development process will affect the connection that have been developed between two parties, customers and company. The most important activity to achieve relationship development is monitoring process such as service or complaint management (Brown & Gulycz, 2002). Procedures, mechanisms, schedules, and activities are the part of relationship activities in which the products and services have been delivered to customers.
According to the works of Hanley and Lindgreen et al., (2006), relationship development is implemented by a few methods such as inform customers about promotions, discounts and other facilities of the organizations, encourage customers to purchase more by showing appreciation, to convince customers that their feedback are taken seriously. Quality of Services
According to Gee, Coates, & Nicholson (2008) , it is shown that service quality has a positive and significant relationship on consumer satisfaction and also loyalty, not to mention also to the profitability of firms.
Hence, according to the works of Hanley (2008), quality of services could be implemented by a few methods such as meeting customer expectation of good service level and having many varieties of products, provide good quality products with reasonable price, to handle the customer complaints about the products and services tactfully.
Behavior of Employees
A good employee which really passionate and hold the company behavior and value will strengthen the connection between customer and company. However, when employee act through their own behavior, customers may give a bad evaluation to the company and may result to the negative perception of customer. In this case, an employee will bring to bear the impact on company’s reputation and attitudes (Coulter & Coulter, 2002).
According to the works of Hanley & Leahy (2008), the effect of positive employees’ behavior could be expressed by a few methods such as increase the speed of employees’ response to the customer, ensure employees are friendly and respectful to customer, employees to show care and concern to the customers.
Customer Loyalty
Customer loyalty is defined as the urge/ intention to make a repeat purchase behavior of company product/ services (Olson & Peter, 1993). Where Kotler & Keller (2009), stated that customer loyalty as a deeply commitment by customers to re-buy a preferred product or service in the future without considering influences of switching behavior. There are also some indicators that can be used to measure customer loyalty, such as the customer’s intention to keep buying a particular product/service, the customer’s intention to do cross-selling (action or practice of selling an additional product or service to an existing customer, ex: a notebook seller suggest the customer a mouse, and other accessories), the willingness of the customer to spread positive word-of-mouth about the product/service, the customer’s intention to offer ideas to the company regarding the development of the product/service. (Kotler & Keller, 2009)
Relationship between concepts
Customer relationship management (CRM) and customer loyalty are two major theories to conduct the research. In customer relationship management, researcher is using theories from Khalafinezhad & Long (2013), critical elements of CRM as a component that is represent CRM. Through these theories, researcher want to know the impact on customer loyalty. Those factors that give impact to customer loyalty are interaction management, relationship development, customer service and employees’ behavior.
As the critical elements that represent CRM in the company, interaction management will give impact to company that try to find out how the way to attract customer such as getting customer’s feedback, provide variety of entertainment and promotion to the customers, and also giving vouchers for customers. By those action, customer will be delighted and purchase the product again (Lindgreen, Palmer, Vanhamme, & Wouters, 2006). The after effect is customer will use those products more and it improve the loyalty of customers to company.
Relationship development also one of the way to increase customer loyalty by informing customer about promotion and discount, show appreciation to customer, and convince to customer that company really take the customer’s feedback seriously. All people are glad with discount and customer also happy when company really pay attention to what customer’s need (Zent, 2014), and that is why relationship development can improve the loyalty of customer.
386 to loyalty (Lindgreen, Palmer, Vanhamme, & Wouters, 2006).
Lastly, behavior of the employees will affect the customer loyalty since they are the symbol of company that is reflected by the way they handle customer positively, their friendliness, and their speed to handle problem (Coulter & Coulter, 2002). By those kind of approach, customer will feel that they are being cared and they feel the company’s value is really maintaining customer relationship. When the relationship between company and customer is good, it will be easy for company to grab customer’s loyalty. In conclusion those four variables give impacts to customer loyalty, hence the relationship of two concepts CRM and customer loyalty can be summarized into the following figure.
Figure 1. Relation between Concepts
RESEARCH METHOD
Quantitative data analysis is a measurement used in a study where the data can be calculated by the amount of certain units or expressed with numbers (Cooper & Schindler, 2014). Moreover this research concludes as reporting and explanatory research, which the researcher try to report the profile of respondents and explain the relationship between each variables using theories/ hypothesis. In this research, customer loyalty will be examined through the variables of customer relationship management. In addition, the relationship between variables will be analyzed using quantitative analysis. The quantitative analysis that being used is regression analysis and will be processed using SPSS 22 as the statistical tool.
The research will examine the impact of customer relationship management towards customer loyalty, hence there are several variables that can be classified as dependent and independent variables. Those variables are tested using 5- point of Likert scale.
According to Cooper and Schindler (2014), variable is defined as “a symbol of an event, act, characteristic, trait, or attribute that can be measured and to which we assign categorical values”. In this research the dependent variable is customer loyalty that is influenced by customer relationship management elements. Those customer relationship management elements become the independent variable. In order to measure customer loyalty of PT.
Central Proteinaprima, several indicators from Kotler and Keller (2009) will be used. Basically there are four indicators to be used in the dependent variable, however the second indicators that is “The customer’s intention to do cross-selling” is being excluded because PT Central Proteinaprima does not implement those activities to the customer. Hence there will be three indicators to be adapted in the questionnaire.
The dependent variables will be I will keep buying PT. Central Proteinaprima fish feed product, I will spread positive word-of-mouth about PT. Central Proteinaprima fish feed product, I will offer ideas to PT. Central Proteinaprima regarding the development of the product.
Beside dependent variable, this research also has independent variables which influence and cause an effect on dependent variable in positive and negative way (Cooper & Schindler, 2014). This research will test the individual impacts of each elements in customer relationship management. Table 3. Elements of Customer Relationship Management and Indicators
Code Interaction Management Indicators IM1 PT. Central Proteinaprima is getting
customer’s feedback
IM2 PT. Central Proteinaprima provides variety of entertainment to the customers IM3 PT. Central Proteinaprima provides
variety of promotion to the customers IM4 PT. Central Proteinaprima increases the
interaction with customers by attractive ways such as using social network IM5 PT. Central Proteinaprima records the
customer purchasing trend to evaluate their bonuses and vouchers entitlement Relationship Development Indicators RD1 PT. Central Proteinaprima informs
customers about promotions, discounts and other facilities
RD2 PT. Central Proteinaprima encourages customers to purchase more by showing appreciation.
RD3 PT. Central Proteinaprima convinces customers that their feedback are taken seriously
Quality of Services Indicators
QS1 PT. Central Proteinaprima is meeting customer expectation of good service level.
QS2 PT. Central Proteinaprima is having many varieties of products.
QS3 PT. Central Proteinaprima provides good quality products with reasonable price QS4 PT. Central Proteinaprima handle the
customer complains about the products and services tactfully
387 BE1 PT. Central Proteinaprima employees
increase the speed of responding the customer.
BE2 PT. Central Proteinaprima employees are friendly
This research is using three types of measurement scale which are nominal, ordinal, and interval scale. Nominal and ordinal scale are being used to see the pattern of demographic and sociological variables of the study like age, gender, place of living, education level and interval scale is to measure the respondent’s opinion related with independent and dependent variables.
This research will use probability sampling type which used simple random sampling as the sampling method. In this particular research, the population is customer of PT Central Proteinaprima located in Sidoarjo. The researcher use Sidoarjo as the location to conduct the research because Sidoarjo is the largest consumer of PT. Central Proteinaprima fish feed product (K.R. Sari, personal communication, February 20, 2015). Researcher will spread the questionnaire to customers that used PT. Central Proteinaprima product in Sidoarjo.
The data gathered during this research is coming from primary data and secondary data. The source of the primary data is collected through distributing questionnaires. The data is collected by distributing questionnaires to 150 respondents, specifically the customer of PT. Central Proteinaprima. The secondary data is taken from books, journals, interviews and websites regarding customer loyalty, CRM, and information of PT. Central Proteinaprima.
In addition, researcher also determine the sample size uses the formula developed by Pallant (2010), in which the sample size is influenced by the number of independent variables. The sample size (n) must be bigger than 50 + 8m, in which m is the number of independent variables. As there are four independent variables in this research, therefore the number of respondents must be more than 82 (50 + 8(4)). In fact, according to Ghozali (2011), the more respondents the researcher use, the result will be more relevant. Thus, the writers decide to use 150 respondents for this research. Questionnaires will be distributed and used to collect the data. Where the invalid questionnaires will be removed as a sample.
Sekaran and Bougie (2010) said that validity test is the test to measure how well a measuring instrument measures the concept that it is intended to measure. Ghozali (2011) also said that a questionnaire can be classified as a valid questionnaire if the questions are able to reveal something that will be measured by the questionnaire itself.
In conducting validity test, researcher will compare the value of r gotten from questionnaire data (r-data) for each indicator of variables with the value
of r available in the table (r- table) (Ghozali, 2011). In addition, this following hypothesis is proposed: H0: the score for each measurement tool is positively
correlated with construct's total score.
H1: the score for each measurement tool is not
positively correlated with construct's total score. If the r-data for all indicators higher than the r -table, the H0 is accepted means, the measurement tools
is valid. The r-data can be seen in the column of corrected item-total correlation that available in the output of the SPSS, gotten when researcher examines the Cronbach’s Alpha. r-table is the r value from the 2-tailed r table with the degree of freedom of n – 2, ( n = number of samples) (Ghozali, 2011).
Reliability test is a test to check how consistently a measuring instrument measures the concept that it is measuring. Ghozali (2011) also suggest a questionnaire is reliable if the answer of the sample to one of the statements is consistent or stable. This research will use the second method with using SPSS and test each variables and only accept variable with the amount of Cronbach Alpha > 0.7.
Santoso (2001) said that multiple linear regressions is a good model if they can fulfill classic assumption test.
Normality test is conducted to test whether residuals have normal distribution in the regression model or not, considering that t and F tests assume residual value to follow up normal distribution (Ghozali, 2011). In order to see residuals’ normality, it can be done by examining histogram that compares between observed data with the distribution close to normal distribution. The data will pass normality test when the histogram of the data creates a bell-shaped curve. (Ghozali, 2011)
In addition, to get more reliable and accurate result, it can be done by examining normal probability plot. Normal probability plot compares cumulative distribution with the normal distribution (Ghozali, 2011). The residual data is normally distributed when the plots follow the straight diagonal line. Furthermore, statistical test can be done to test the normality. Kolmogorov-Smirnov (K-S) test can be used as tools to see the normality (Ghozali, 2011). In order to test whether the residuals has normal distribution or not, this following hypothesis is proposed:
388 VIF is less than 10, thus there is no multicollinearity exist in the regression model. (Ghozali, 2011)
Heteroscedasticity test is aimed to check whether the variance of residuals among separate observations are different where a good regression model should be free from heteroscedasticity (Ghozali, 2011). According to Ghozali (2011), there are many ways to test the existence of heteroscedasticity such as scatterplot graph and Park test. This test will be used in this research to get the accuracy.
Autocorrelation test is used to check whether there is correlation between the residual in a particular period (t-period) and the residual in the previous period (t-1 period) in a regression model. Good regression model is free from autocorrelation problem (Ghozali, 2011). In this research, Durbin-Watson test will be used to check the existence of autocorrelation. Based on Santoso (2001), there are some criteria that needs to be fulfilled using Durbin-Watson (DW) test which are DW value below -2: positive autocorrelation occurs. DW value between -2 up to +2: no autocorrelation occurs. DW value higher than +2: negative autocorrelation occurs
F-test is used to know whether independent variables are influencing the dependent variable simultaneously in overall model. The hypothesis that will be tested using the F-test is:
H0: Independent variables simultaneously does not
have significant impact on dependent variables. (�
1= � 2=…= �k = 0)
H1: Independent variables simultaneously have
significant impact on dependent variables. (At least one �k ≠ 0, k = 1, 2,…, n)
Where the decision rule are if Significance F < 5% = independent variables as a whole (or simultaneously) have a significance effect towards dependent variable. (reject H0). If Significance F > 5% = independent
variables as a whole (or simultaneously) do not have a significance effect towards dependent variable (fail to reject H0) (Ghozali, 2011).
t-test will be implemented to know the influence of each independent variable towards the dependent variable. The hypothesis is shown below: H0 : Independent variables does not have significant
impact on dependent variables. (�k = 0)
H1: Independent variables have significant impact on
customer dependent variables. (�k ≠ 0, k = 1, 2,…, n)
Where the decision rule are if Significance t < 5% = independent variables individually have a significance effect toward dependent variable (reject H0). If
Significance t > 5% = independent variables individually do not have a significance effect toward dependent variable (fail to reject H0). (Ghozali, 2011).
R2 test is aimed to test how many percent of
dependent variable values can be predicted by the independent variable (Cooper & Schindler, 2014). The higher the R2, the better the model in explaining the
variability in dependent variable values. Ghozali
(2011) said that adjusted R2 is preferred in multiple
linear regression because it eliminates the bias due to the number of independent variables, hence it will be used in this research. The closer the value of adjusted R2 to 1, the higher the variation of dependent variables
are able to be explained by the independent variables (Ghozali, 2011).
RESULTS AND DISCUSSION
Researcher gathered the data by distributing questionnaires to the customer that ever used PT. Central Proteinaprima fish feed product. The researcher helps customer to fill the questionnaire since the majority of customer is not able to interpret the question. As the matter of fact, the matter of fact, out of 150 questionnaires that is distributed, 10 of them is invalid due to the customer’s place of living is not in Sidoarjo area and 3 of them are outlier data. Outlier data means the data is having a characteristics that is really extreme and different from other data. For example, all of the answer in the questionnaires is 1 (Ghozali, 2011).
Those 137 valid samples are gathered and used for processing the data using IBM SPSS version 22 software. Researcher conducted validity and reliability test for all items of the independent and dependent variables. Moreover, after the data is valid and reliable, it will be processed using classic assumption test (normality, multicollinearity, heteroscedasticity, and autocorrelation.
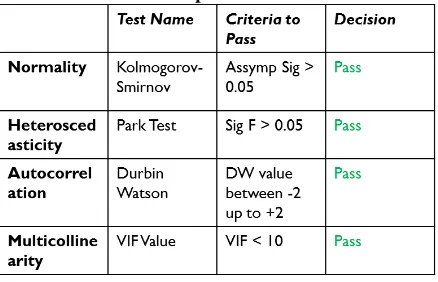
Knowing that all measurement items are valid and reliable, classic assumption test and multiple regression test is being conducted for further analysis. The result of classic assumption test is summed up in the following table:
Table 4. Classic Assumption Test
F-test is conducted to know whether independent variables are influencing the dependent variable simultaneously in overall model. The hypothesis are:
H0: Customer Relationship Management (Interaction
389 simultaneously does not have significant impact on customer loyalty. (� 1, � 2, � 3, � 4 = 0)
H1: Customer Relationship Management (Interaction
management, relationship development, quality of services, and behavior of employees) simultaneously have significant impact on customer loyalty. (� 1, � 2, � 3, � 4 ≠ 0)
Where the decision rule are if Significance F < 5% = independent variables as a whole (or simultaneously) have a significance effect towards dependent variable. (reject H0). If Significance F > 5% = independent
variables as a whole (or simultaneously) do not have a significance effect towards dependent variable (fail to reject H0) (Ghozali, 2011).
After conducting a research, the result can be seen in ANOVA table as shown in Table 4.7, it is shown that the significance F value is below 5% which is 0.006. It means that H0 is rejected hence the
independent variable, customer relationship management (interaction management, relationship development, quality of services, and behavior of employees) simultaneously have a significant effect towards the dependent variable (customer loyalty). Table 5. ANOVA Table
Model
Sum of Squares df
Mean
Square F Sig. 1 Regression 4.541 4 1.135 3.829 .006b
Residual 39.140 132 .297 Total 43.680 136 a. Dependent Variable: CLAVG
b. Predictors: (Constant), BEAVG, RDAVG, IMAVG, QSAVG
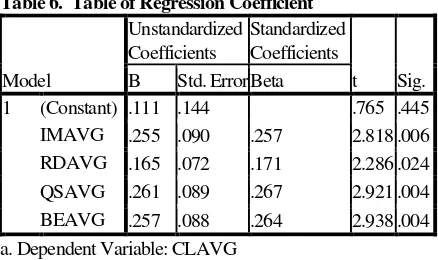
The result of the t-test can be seen from table of regression coefficient.
Table 6. Table of Regression Coefficient
Model
Unstandardized Coefficients
Standardized Coefficients
t Sig. B Std. Error Beta
1 (Constant) .111 .144 .765 .445 IMAVG .255 .090 .257 2.818 .006 RDAVG .165 .072 .171 2.286 .024 QSAVG .261 .089 .267 2.921 .004 BEAVG .257 .088 .264 2.938 .004 a. Dependent Variable: CLAVG
By using the table of regression coefficient, the regression model, can be developed which is shown as Y= 0.111 + 0.255 X1 + 0.165 X2 + 0.261 X3 + 0.257
X4+ ε
As the result gotten from t-test. All independent variables individually are giving significant impact to dependent variable.
Interaction management give significant impact to customer loyalty since the significance t is below 0.05, therefore the null hypothesis of interaction management is rejected. This means that interaction management individually has significant influence on customer loyalty. In addition, the unstandardized coefficients of this variable is 0.255, means for every one unit increase in interaction management, customer loyalty degree will increase by 0.255.
Relationship development give significant impact to customer loyalty since the significance t is below 0.05, the null hypothesis of relationship development is rejected. It means that relationship development individually has significant influence on customer loyalty. In addition, the unstandardized coefficients of this variable is 0.165, means for every one unit increase in relationship development, the customer loyalty degree will increase by 0.165.
Quality of services give significant impact to customer loyalty because the significance t is below 0.05, therefore the null hypothesis of quality of services is rejected. This means that quality of services individually has significant influence on customer loyalty. In addition, the unstandardized coefficients of this variable is 0.261, means for every one unit increase in quality of services, the customer loyalty degree will increase by 0.261.
Behavior of employees give significant impact to customer loyalty since the significance t is below 0.05, therefore the null hypothesis of behavior of employees is rejected. It means that behavior of employees individually has significant influence on customer loyalty. In addition, the unstandardized coefficients of this variable is 0.257, means for every one unit increase in behavior of employees, the customer loyalty degree will increase by 0.257.
Adjusted R square is conducted in this research in order to analyze how many percent of dependent variable values can be predicted by the independent variables in multiple linear regression model. The closer the value of adjusted R2 to 1, the higher the
variation of dependent variables are able to be explained by the independent variables (Ghozali, 2011). In table 7, the value of adjusted R square is 0.828 means 82.8% of the variation on customer loyalty as the dependent variable can be explained by the variation of customer relationship management as independent variables.
Table 7. Adjusted R Square
Model R R Square
Adjusted R Square
Std. Error of the Estimate 1 .910a .828 .823 .53707
a. Predictors: (Constant), BEAVG, RDAVG, IMAVG, QSAVG
390
CONCLUSION
This result concludes customer relationship management simultaneously has a significant impact on customer loyalty, interaction management has a significant impact on customer loyalty, relationship development has a significant impact on customer loyalty, quality of services has a significant impact on customer loyalty, and behavior of employees has a significant impact on customer loyalty. Based on the result of study, some improvement can be applied for PT. Central Proteinaprima to increase customer loyalty using customer relationship management. As all of the variables of customer relationship management are giving significant impact to customer loyalty of PT. Central Proteinaprima, they could improve each of the elements. For example in relationship development PT. Central Proteinaprima could give more incentive or appreciation to customer that buy their product. For example, giving the customer additional volume or amount of fish feed in every 100 kgs of fish feed purchased.
Moreover make or arrange a meeting every three months for the customers is one of the way to improve interaction management with customer which is one of the element of CRM. This meeting aim to discuss and listen to the feedback of the customer so customer can explain their problem about fish cultivation for example breeding, handling the disease, giving the right measurement and time to feed the fish, etc
Another recommendation about improvement of customer relationship management is by improving the most influenced variable which is quality of services. Quality is important since it will give impact to the productivity of fish produced by the customer that use PT. Central Proteinaprima (CPP) fish feed (K.R. Sari, personal communication, February 20, 2015). Hence, CPP should increase or maintain the quality of services including the way CPP give the best services that is suit to the customer’s expectation, handling the customer feedback and also variant of product.
Last but not least, improving the behavior of employees also important for increasing the customer loyalty, for example CPP could give an annual training to their employee in order to remind the employee, the value of CPP, how to deal with customer, handle the customer complaints, etc.
There are several limitations to this research. First, the scope of the research is small, this study only take sample in Sidoarjo. Sidoarjo has the big amount of fishpond owner like 3,227 peoples with area as wide as 15,530 hectare and every person in Sidoarjo (KKP, 2013). However, there are also a lot of area in Indonesia that is have many fishponds like Borneo and Sumatra. Thus, the results of this research might be only fully representing Sidoarjo area. While in other cities, it cannot be said that exactly the same results will be found. Furthermore, the object of this study is
limited to only one brand. This study only uses the object of PT. Central Proteinaprima brand which can be categorized as the non-durable goods. Comparison study needs to be done to check the impact of customer relationship management to customer loyalty.
Realizing the limitation of research, further improvement can be done for next research. As the big player in fish feed industry, PT. Central Proteinaprima (CPP) definitely wants to increase the loyalty of all customers in all areas. Since CPP is sold throughout the whole area of Indonesia, therefore the company needs the insights on how they can increase the customer loyalty all over area in Indonesia. Thus, the researcher suggests that the coverage area of the further research should be widened, meaning that the sample should be taken from all the areas of Indonesia, instead of only from one area.
In addition, a comparison study between different industries could be made to test the impact of customer relationship management on customer loyalty. Moreover, this study could be extended by considering different product categories and brands. For example, durable goods such as cars, motorcycles, and electronics.
REFERENCES
Badan Pusat Statistik. (2015). Badan Pusat Statistik.
Retrieved from Badan Pusat Statistik: http://www.bps.go.id/Subjek/view/id/56#sub jekViewTab3|accordion-daftar-subjek3 Barnes, J. G. (2001). Secrets of Customer Relationship
Management (translation), McGraw-Hill,.
Yogyakarta: Andi.
BKPM. (2011). Fishery Industry at a glance. Retrieved February 27, 2015, from BKPM: www.bkpm.go.id/img/file/fisheries.pdf BPS. (2014, 12 23). Separuh budidaya Lele untuk beli
pakan . Retrieved from Antaranews.com: http://www.antaranews.com/berita/470568/s eparuh-biaya-budidaya-lele-untuk-beli-pakan Brown, S. A., & Gulycz, M. (2002). Performance Driven CRM: How to Make Your Customer Relationship Management Visions A Reality.
Ontario: John Wiley.
Brown, S. W. (2000). Customer Relationship Management: A Strategic Imperative in the World of E-Business. John Wiley & Sons. Central Proteina Prima; Japfa Comfeed Indonesia;
Sierad Produce. (2011, 2012, 2013). Annual Report 2013, 2012, 2011. Jakarta.
Cooper, D. R., & Schindler, P. S. (2014). Business Research Methods. New York: McGraw-Hill/Irwin.
Coulter, K. S., & Coulter, R. A. (2002). Determinants of Trust in a Service Provider: The Moderating Role of Length Of Relationship.
391 Dowling, G. (2002). Customer Relationship
Management: In B2C Markets, Often Less Is More. California Management Review, 121-137. Retrieved from Customer Relationship Management: In B2C Markets, Often Less Is More.
Gee, R., Coates, G., & Nicholson, M. (2008). Understanding and Profitably Managing Customer Loyalty. Marketing Intelligence & Planning, 359–374.
Ghozali, I. (2011). Analisis Multivariate Program IBM SPSS 19. Semarang: Badan Penerbit Universitas Diponegoro.
Ghozali, I. (2011). Aplikasi analisis multivariate dengan program SPSS 19 edisi 5. Semarang: BP Universitas Diponegoro.
Hanley, S., & Leahy, R. (2008). The Effectiveness of Relationship Marketing Strategies in Department Stores. Int. J. Bus. Manage, 133–
140.
Havel, V. (2008). Indonesia Diplomatic Handbook. In
Indonesia Diplomatic Handbook (p. 38). USA International Business Publications. Indonesia, Global Business Guide. (2014). Indonesia’s
Aquaculture & Fisheries Sector. Retrieved 2 24, 2015, from Global Business Guide Indonesia:
http://www.gbgindonesia.com/en/agriculture /article/2014/indonesia_s_aquaculture_and_f isheries_sector.php
Khalafinezhad, R., & Long, C. S. (2013). Customer Satisfaction and Loyalty : A Review in the Perspective of CRM. Jurnal Teknologi, 64. KKP. (2013). Warta Pasar Ikan. Retrieved 2 26, 2015,
from BATARI, Ikon Akademi Perikanan Sidoarjo:
http://www.wpi.kkp.go.id/index.php/compon ent/content/article/83-profil-komoditi/82-batari-ikon-akademi-perikanan-sidoarjo Kontan. (2012, November 29). Prospek industri pakan
ikan cerah di 2013. Retrieved from Kontan: http://industri.kontan.co.id/news/prospek-industri-pakan-ikan-cerah-di-2013
Kotler, P., & Keller, K. L. (2009). Marketing Management. Pearson.
Lindgreen, A., Palmer, R., Vanhamme, J., & Wouters, J. (2006). A Relationship Management Assessment Tool: Questioning, Identifying, and Prioritizing Critical Aspects of Customer Relationships. Industrial Marketing Management, 57−71.
Olson, J., & Peter, J. (1993). Consumer Behavior and Marketing Strategy. Homewood IL: Irwin. Pallant, J. (2010). SPSS Survival Manual: A step by
step guide to data analysis using SPSS, 4th Edition. United Kingdom: Open University Press.
Peppers, D., & Rogers, M. (1997). Enterprise One to One. New York: Doubleday Dell Publishing Group.
Prahalad, C. K., & V, R. (2001). Co-Opting Customer Competence. Harvard Business Review on Customer Relationship Management. Sang Long, C., & Khalafinezhad, R. (2013). Impact of
CRM Factors on Customer Satisfaction and Loyalty. Asian Social Science, 247-249. Santoso, S. (2001). Mengolah Data Statistik Secara
Profesional. Jakarta: Alex Media
Komputindo.
Sekaran, U., & Bougie, R. (2010). Research Methods for Business: A Skill Building Approach: Fourth Edition. UK: John Wiley& Sons. Tjiptono, F. (2000). Strategi Pemasaran. Yogyakarta:
Andy.
UNDP. (2011). About Indonesia. Retrieved from United Nations Development Programme: http://www.undp.or.id/general/about_indone sia.asp
Wang, Y. H. (2004). An Integrated Framework for Customer Value and Customer-Relationship Management Performance: A Customer-based Perspective from China. Managing Service Quality, 169-182.
Zent, M. (2014, 3 20). Entrepreneur. Retrieved from 30 Ways to Show Your Customers They're
Always Right:
http://www.entrepreneur.com/article/65768