50
The Impact of Relationship Marketing on
Customer Loyalty in a Private Bank
Ferronibah Wahyu
International Business Management Program, Petra Christian University Jl. Siwalankerto 121-131, Surabaya
E-mail: [email protected]
ABSTRACT
Customers are the basic requirement for a success business. Where competition is tight, companies will be more intentional about gaining customer loyalty. Customer loyalty is important, because when customers are
loyal, they will not even look at one’s competitors. This change can be through developing good relationships
with customers. This research aims to find the impact of relationship marketing on customer loyalty in one of the private banks in Surabaya. It will help the company to maintain customer loyalty as they go beyond their expectations, especially in the banking industry where product innovation cannot be the only strategic weapon to compete and to have a sustainable and profitable business. This research could gather 111 respondents as the sample with a method of random sampling. The data was analysed by using multiple regression analysis. As the
results, this researcher found that Relationship marketing’s elements simultaneously have a significant effect on
customer loyalty. Furthermore, there are also two elements of relationship marketing which have a significant impact on customer loyalty individually. Namely, trust and competence.
Keywords: Relationship Marketing, Customer Loyalty, Bank, Service
ABSTRAK
Pelanggan merupakan syarat utama untuk kesuksesan suatu bisnis. Ketika kompetisi sangat ketat, perusahaan akan lebih berkeinginan untuk mendapatkan kesetiaan pelanggan. Kesetiaan pelanggan penting untuk perusahaan, karena saat pelanggan tersebut setia, mereka tidak akan pindah menggunakan produk dari perusahaan lain. Perubahan ini dapat dilakukan dengan cara membangung hubungan baik dengan pelanggan. Penelitian ini bertujuan untuk melihat pengaruh dari Relationship Marketing terhadap kesetiaan pelanggan di salah satu bank swasta di Surabaya. Penelitian ini akan dapat membantu perusahaan untuk mempertahankan kesetiaan pelanggan karena mereka melayani lebih dari ekspektasi pelanggan, apalagi di industri perbankan dimana inovasi produk tidak dapat menjadi senjata utama untuk bersaing dan mendapatkan bisnis yang menguntungkan. Dalam penelitian ini, ada sebanyak 111 responden yang didapatkan melalui metode sampel acak. Data dianalisa menggunakan analisa regresi berganda. Hasilnya menunjukkan bahwa Relationship Marketing secara bersamaan memberikan dampak yang signifikan terhadap kesetiaan pelanggan. Selain itu, secara individu, elemen dari Relationship Marketing juga memberikan dampak signifikan terhadap kesetiaan pelanggan. Ada dua elemen yang memberikan dampak signifikan, kepercayaan dan kompetensi.
Kata Kunci: Relationship Marketing, Kesetiaan Pelanggan, Bank, Servis
INTRODUCTION
A business will never be complete and successful without an emphasising on its customers. Customers are the basic requirement for a success business. It is important to make customers the priority in the marketing process, because this can help the company make sure that they can achieve customer satisfaction and have a sustainable business. It requires companies to start thinking about how to be different from their competitors and how to maintain their customers. Where competition is tight, companies will be more intentional about
gaining customer loyalty. Customer loyalty is important, because when customers are loyal, they
will not even look at one’s competitors.
51 contact and communication with customers. These people must understand their important role in the management to build and maintain good relationship with customers for long-term business purposes. Sales and distribution officers must perform good services so that customers will be satisfied.
This research aims to find the effect of relationship marketing on customer loyalty in one of the private banks in Surabaya. This is important to be understood because relationship marketing is the new way to market the products by giving additional good quality services to the customers. It will help the company to maintain customer loyalty as they go beyond their expectations, especially in the banking industry where product innovation cannot be the only strategic weapon to compete and to have a sustainable and profitable business. Banking products, as has been mentioned before, are similar among all banks around the world. The difference comes through the additional services which can be built through relationship marketing.
As mentioned above, this private bank will be the target company where the research is conducted. This private bank is the best place to learn relationship marketing which can bring special experience for each customer and by learning from this bank, the researcher will also be able to analyse the effect on customer loyalty. This private bank is applying relationship marketing in the department of Sales and Distribution (SnD). It gives special services to customers by giving personal experience and more engaging relationships.
Given the five elements of relationship marketing; (trust, communication, commitment, conflict handling, and competence), it is important to know whether every one of them is actually affecting customer loyalty. This research will help the bank to know whether or not its relationship marketing has been implemented well and is affecting customer loyalty. Moreover, to examine which element is the most significant is also important in order to increase the skill and performance of employee. By getting the results of the research, it will be shown which one is the most significant element of relationship marketing. The management of this bank will be able to increase its training for employees in that particular element. Last but not least by knowing the perception from customers about the performance of this private bank, it will lead them into a better service performance in the future as they get closer to their
customers’ expectations.
LITERATURE REVIEW
This research will analyse the effect of relationship marketing on customer loyalty. Therefore, there will be concepts and definitions introduced to explain these variables. The theoretical background is the basis of the whole
research project and it also explains the conceptual model of the research. This conceptual model explains the link between relationship marketing and customer loyalty.
Customer loyalty consists of two words,
“customer” and “loyalty”. In order to have a better
understanding of this term, it is necessary to understand the meaning of each word. According to
Griffin (2005), the word “customer” is derived from the word “custom”, which is defined as creating a
habit and applying that habit in daily life. So,
“customer” means someone who has the habit of
buying from certain companies. The next term is
“loyalty”. According to Oxford English Dictionary; “loyalty” means the quality of being faithful in your
support of somebody/something. The main point
from this term is “being faithful”. This means that
having trust in certain products or services is necessary for people to be considered loyal. In
conclusion, customer loyalty is “a deeply held
commitment to re-buy or re-patronized a preferred product or service consistently in the future, thereby causing repetitive same-brand or same brand-set purchasing, despite situational influences and marketing efforts having the potential to cause
switching behaviour” (Oliver, 2010).
Furthermore, Griffin (2005) mentions the behaviour of a loyal customer. There are several behaviours which show that customers are loyal. Those behaviours are:
a. Customers repeatedly and regularly purchase the products and services.
b. Customers engage in cross-buying products and services from the same company.
c. Customers give good references about the products and services to other people.
d. Customers do not have any intention to buy products and services from other companies or competitors.
While, Marketing plays an important role in the business world. In the business process, marketing plays the role of communicating the value of products or services to customers or target buyers. There are many possible definitions of marketing, depending on the role which the companies have given marketing in their strategy to position themselves among their competitors. The most
general definition is by Kotler (2012): “Marketing is
defined as a social and managerial process designed to meet the needs and requirements through the processes of creating and exchanging products and values. It is the art and science of identifying, creating and delivering value to meet the needs of a target market, making a profit: delivery of
52 The main idea of marketing is that it is a process to meet the needs and requirements of customers. Thus, companies can use marketing as a tool to approach customers. It is not enough only to
approach and to fulfil customers’ needs but also to
build relationships so that customers will not shift their choice and buy from your competitors. In order to build good relationship, companies need a strategy called relationship marketing.
Relationship marketing is no longer something new; it has in fact, changed the history of marketing management worldwide. It was first mentioned in the literature of marketing by Berry (1983) yet its development is still widening even until now. The development of marketing management has led the world into a new approach that emphasises long term relationships with customers. According to Peppers and Rogers (2009), to have a success business today, companies must be flexible in running their businesses, has and have to
be aligned with customers’ expectations. The only
way for a company to grab more attention and achieve loyalty is to build a unique and relevant relationship with its customers. “Relationship marketing is a development and maintenance of long-term, cost-effective relationships with individual customers, suppliers, employees, and
other partners for mutual benefit” (Boone & Kurtz,
2005).
From previous study about the same research topic in the banking industry, the effect of relationship marketing on customer loyalty has shown that there are five elements of relationship marketing. This study was done by Professor Nelson Ndubisi and Chan Kok Wah from Griffith University, Australia. Their research paper was published on Marketing Intelligence & Planning, Vol. 25 Iss: 1, pp.98 – 106 (2005). Relationship marketing has five fundamental elements which are trust, commitment, communication, conflict handling, and competence. These elements have been used by many researchers to conduct similar studies in the same field, which is the banking industry. These five elements focus more on the people of the companies: they measure the people not the products. This study aims to find out about the relationship marketing which is applied by a private bank through its marketing officers.
The diagram below shows the connection between relationship marketing and customer loyalty. Relationship marketing has five elements and each element is expected to have effect on customer loyalty. According to Morgan and Hunt (1994), relationship marketing has strong connections with trust, communication, and commitment to make customers become more loyal. The other two elements, namely conflict handling and competence are taken from the research by Ndubisi and Wah (2005). Each element consists of
different indicators and these are the tools to measure customer loyalty.
Figure 1. Relationship between concepts
RESEARCH METHOD
In this research, the researcher uses theories as the basic concept of the model to support the research and establishes hypotheses. The hypothesis is needed to predict that there will be a relationship between relationship marketing and customer loyalty, and thus that there will be an impact of relationship marketing upon customer loyalty. The independent variable is relationship marketing and the dependent variable is customer loyalty. The researcher will conduct this study by using a quantitative method, instead of a qualitative method.
A quantitative method is more suitable for this research because it can measure the significance of the impact of each element of relationship marketing upon customer loyalty. The qualitative is not suitable for this study because a deeper understanding is required to develop the theory and the qualitative method cannot measure the results to test the original hypotheses. Questionnaires will be distributed to the target respondents.
The respondents of this research will all be customers of this private bank. In order to complete the calculation and interpretation of the data which will be gathered from the samples, the researcher will use a regression model by using a software called IBM SPSS (Statistical Package for Social Science
The dependent variable of this study is customer loyalty. The dependent variable statements in the questionnaire will be in the form of the Likert Scale Summated Rating, so the respondents will need to give a score to each statement from 1 (strongly agree), 2 (disagree), 3 (neutral), 4 (agree), 5 (strongly agree). According to Griffin (2005), there are four types of behaviours which represent customer loyalty.
53 (neutral), 4 (agree), 5 (strongly agree). According to Ndubisi and Wah (2005), relationship marketing has five elements, which are trust, commitment, communication, conflict handling, and competence.
Further measurement of each element is as follows:
a. Trust, the respondents need to respond to these statements: This private bank’s officers have put integrity in all matters
b. Commitment, the respondents need to respond to these statements: This private bank’s officers have the desire to maintain relationship with customers c. Communication, the respondents need to respond to these statements: This private bank’s officers have the habit of greeting politely
d. Conflict Handling, the respondents need to respond to these statements: This private bank’s officers are open-minded
e. Competence, the respondents need to respond to these statements: This private bank’s officers have the ability to provide clear information for customers
The nominal type of data is going to be used in the screening questions and the interval data is going to be used in the main part of the questionnaire, following the Likert scale. The screening questions can be considered as nominal data. There will be four screening questions relating to gender, age, occupation, and the period of time a respondents has been dealing with this private bank.
These questions are classified as nominal data because these data do not have any specific order or distance between one another. On the other hand, the main part of questionnaire, which is using Likert scale, is considered as interval data. According to Cooper and Schindler (2001, p. 277), this kind of scale is considered as interval data because interval data can measure the distance between data. In the questionnaire, respondents will be asked to fill out a type of summated rating scale, and the respondents will have to give their answer from a range of five statements responding to several questions and then being summed up; strongly agree, agree, neutral, disagree, and strongly disagree.
The primary data will come from the questionnaire that the researcher distributes to the respondents. These respondents will all be customers of this private bank who have been banking with this bank in Surabaya.
The secondary data in this research is the theoretical background and some supporting data that is used to interpret the meaning of the primary data. Some of the secondary data are business books, journals, online newspapers, and online magazine. The specific topic is about relationship marketing and customer loyalty. Several online journals about relationship marketing and customer loyalty were also used as relevant research and as data support,
and another source of data from several books is used to support the analytical method.
Sampling method or sampling design is the
other important step in doing a research. “A sample
examines a portion of a target population, and the portion must be carefully selected to represent that population. The researcher has to determine which and how many people to interview, which and how many events to observe, or which and how many 450.000 customers are classified into corporate and individual customers, but for individuals there are also two categories which are regular and preferred.
Since this research aims to find out about the service performance from relationship marketing officers, only customers who have had experience dealing with these officers will be selected as the respondents. Furthermore, there are more or less 150 relationship officers in the area of Surabaya and each of them handle more or less 50 customers. Thus, the population of customers who have had experience dealing with relationship officers is more or less 7.500 people.
For this research the sampling method used is probability simple random sampling. Simple random sampling is considered a special case in which each population element has a known and equal chance of selection. In this case, the researcher uses probability sampling which specifically use simple random sampling.
Since this research is conducted using the quantitative method, there will be a minimum sample size. According to Green (1991), the standard sample size N for a multiple regression model is N ≥ 50 + (8p), where p refers to the number of independent variables. In this research, there are five independent variables. Therefore, the minimum sample size is 90.
This research will use the two-tailed probability with a 95% confidence level and a 5% of
significance level (α).
In order to measure the validity of each item of the questions in the questionnaire, this researcher uses the measurement of the correlation between scores in the questionnaires toward the
variables’ score. This significance test compares the
correlations between each score of each question toward the total score by using the Pearson Correlation test.
54 invalid when its value is greater than 0.05 (5%). Furthermore, in order to make sure that each indicator is valid, this researcher will use one of the statistical results from the reliability test. The validity of each indicator can be measured through the numbers which are stated in the box of Item Total Statistic, referring to the column named Corrected Item – Total Correlation. The values of each indicator from the independent and dependent variables have to be bigger than the numbers in the r table.
The questionnaire represents the indicators of variables which are going to be measured. Therefore Cronbach Alpha will be used to see the reliability of the variables. According to Ghozali (2001), a variable is considered reliable if it scored > 0.60. When the score of its Cronbach Alpha test gets closer to 1, it is more reliable. The criteria of Cronbach Alpha is as follows:
There are two main classifications of statistical methods; classical assumption tests and multiple linear regression analysis.
The test of Multicollinearity is done by looking at the value of correlations which is coming from the results of data processing. According to Lind, Marchal and Wathen (2010), if the limit of correlation between two independent variables lies between -0.70 and 0.70, there is likely not a problem with using these variables. A more precise measurement for Multicollinearity is to use the variance inflation indicator (VIF). In order to find the value of the VIF, one of the independent variables must be taken out to become the dependent variable to run the VIF test. If the VIF value is greater than 10 value, the data is considered Multicollinearity and which indicates that this independent variable should be removed from the analysis.
According to Newbold, Carlson, and Thorne (2007), Heteroscedasticity is an event when the errors of variance within from a regression model differ along the scale. In order to see the existence of Heteroscedasticity, there are tests needed to be done which are the Park Test, White Test. Heteroscedasticity can be indicated through the significance value of the regression results, if the significance value shows number below 0.05, it means the Heteroscedasticity exists.
Moreover, according to Ghozali (2011), In White test, the regression model consists of not only the original dependent and independent variables but also the square values of each independent variable. From the results of the regression, the R2 must be multiplied by the number of the sample size to get the value of Chi Square. The number of chi square calculated must be lower than the chi square value in the table.
According to Lind, Marchal, and Wathen (2010), the Durbin-Watson test statistic which is also called an autocorrelation test is used to tests the
successive residuals of regression. The Durbin-Watson statistic ranges in value from 0 to 4. A value near 2 indicates non-autocorrelation; a value toward 0 indicates positive autocorrelation; a value toward 4 indicates negative autocorrelation.
In order to get more accurate measurement of Durbin Watson, the value of Durbin Watson from the research has to pass the standard measurement of du < d < 4 – du. The values of du is derived from the
Durbin Watson’s table.
According to Ghozali (2005), the normality test is a test to measure whether or not in a regression model the residual variables have a normal distribution. Another measurement for the normality test is done by analysing the data’s skewness and kurtosis. This is based on a statistical method that includes the diagnostic of the hypothesis test for normality and a rule that states that a variable is reasonably close to normal if its skewness and kurtosis have the values between -1.96 and +1.96. In multiple regression, there are several independent variables and one dependent variable. This research
aims to analyse the relationship marketing’s
elements and customer loyalty. A further explanation of the formula is as follows:
Y = a + β1X1 + β2X2 + β3X3 + β4X4 + β5X5 + e
There are also other statistic tests which are included in regression model, which are F-test, T-test, Adjusted R Square and Standardised Coefficient.
According to Cooper and Schindler (2011), the F – test is used to test the regression model. The F – Test tests the overall role for the model, so it evaluates all the independent variables simultaneously. By using the F – test, the goodness of the model will be able to be determined.
The F – test is used to test the first hypothesis: test is greater than or equal to alpha = 0.05 It means that the t-test is used to test the significance of the impact of each independent variable upon the
There are two possible results of the T – test: Reject H0, if p value from the t - test is smaller than alpha = 0.05. Fail to reject H0, if p value from t - test is greater than or equal to alpha = 0.05
55 can increase or decrease when a new independent variable is added into the regression model. Adjusted R square can have negative or positive values. In the result of a regression test, if there is a negative value of adjusted R square, it will be considered as 0. In a mathematical way, if the value of R square is equal to 1, it means the adjusted R square = 1. However, if the value of R square is equal to 0, it means the value of adjusted R square = (1 – k) / (n – k). When k > 1, the adjusted R square will be negative. The higher the value of the adjusted R square, the better a regression model is.
“Standardised coefficients are regression
coefficients in standardised form (mean = 0) used to determine the comparative impact of variables that come from different scales; the X values are restated in terms of their standard deviations (a measure of the amount that Y varies with each unit change of
the associated X variable)” (Cooper and Schindler,
2011, p. 729). The standardised coefficients will show which independent variable has the most significant impact upon the dependent variable. In statistics, standardised coefficient is also called beta. The measurement of significance will be noticed from the p-values or sig (the significance). The larger betas are associated with larger t-values and lower p-values. Furthermore, it can be understood that the lower p-values (using alpha 0.05) of an element show a more significant effect upon the dependent variable. When the p-value is equal to 0.05 or lower than 0.05, it means elements of the independent variable have significant effect upon the dependent variable, with the lower p-values indicating the most significant effect. Therefore it is needed to be conducted in this research, so that most significant element of relationship marketing will be known.
RESULTS AND DISCUSSION
The procedure for completing the analysis of this research involved performing several steps of tests. The analysis began with validity and reliability tests. These tests aimed to check the goodness of the model fit for questionnaire. The results are described in the tables below:
Table 1. Validity&Reliability Tests for Trust
Table 2. Validity and Reliability Tests for Commitment
Table 3. Validity and Reliability Tests for Communications (1)
Table 4. Validity and Reliability Tests for Communications (2)
Table 5. Validity and Reliability Tests for Conflict Handling
Test Measurement Item Minimum Value Good Relationship Customer is the Priority
Validity Corrected Item
Total Correlation 0.187 0.575 0.575
ReliabilityCronbach's Alpha Based on Standardised Items 0.6
COMMITMENT
0.731
Test Measurement Item Minimum Value Polite
Greeting Empathy Good Listener
Good Response
Validity Corrected Item
Total Correlation 0.187 0.688 0.667 0.712 0.755
ReliabilityCronbach's Alpha Based on
Standardised Items 0.6 0.907
COMMUNICATIONS
Test Measurement Item Minimum Value Verbal Communication
Eye Contact
Facial Expressions Attitude
Validity Corrected Item
Total Correlation 0.187 0.719 0.732 0.727 0.613
ReliabilityCronbach's Alpha Based on Standardised Items 0.6
COMMUNICATIONS
0.907
Test Measurement Item Minimum Value Open Minded Incovenience Fairness Notification
Validity Corrected Item
Total Correlation 0.187 0.648 0.683 0.81 0.637
ReliabilityCronbach's Alpha Based on
Standardised Items 0.6 0.852
CONFLICT HANDLING
Test Measurement Item Minimum Value Skillfulness Benevolence Integrity
Validity Corrected Item
Total Correlation 0.187 0.685 0.691 0.643
ReliabilityCronbach's Alpha Based on Standardised Items 0.6
TRUST
56
Table 6. Validity and Reliability Tests for Competence
Table 7. Validity and Reliability Tests for Customer Loyalty
The Multicollinearity test aims to test whether or not there is any correlation between independent variables. There must not any Multicollinearity in the research. The independent variables are considered as not to demonstrating Multicollinearity if the variance inflation factors are below 10. The variance inflation factors (VIF) are all below 10, the lowest VIF is trust with value of 2.195 and the highest VIF belongs to conflict handling with value of 3.747. The coefficient correlations for each independent variable remains under 0.7, which means there is no Multicollinearity between independent variables.
In this case, the sample size is 111. Since the sample size is not specifically mentioned in the Durbin Watson Table, and the researcher must calculate it by interpolating between a sample size of 100 and a sample size 150. From the interpolation, the lower limit of Durbin Watson for the sample size of 111 is 1.59168 and the upper limit is 1.78484. The Durbin Watson value from this research is 1.848 and that value is higher than the upper limit yet still below 4 – du which is 2.21516. Hence, this research passes the autocorrelation test and there is no autocorrelation.
The skewness and kurtosis value has to be between the required standard. The skewness value is -0.347 and kurtosis value is -0.272. The limit is which is the Park Test. The result of Park Test show that the value is below 0.05, and therefore the element of trust here is considered to be heteroscedastic. Since there is Heteroscedasticity, fail to reject H0. While the result of White Test The model of regression is as follows:
U2t = b0 + b1X1 + b2X2 + b3X3 + b4X4 + b5X5 + b6X12 + b7X22 + b8X32 + b9X42 + b10X52 + b11X1X2X3X4X5
C2 = n x R2 Where: n = Sample Size
The R Square is 0.199. Therefore the Chi Square calculated value is 22.089. However, the chi square value in the chi square table is 9.49. This means that the chi square calculated is higher than the value in the table and so the heteroscedastic result is still obtained as the Park test previously. There are several transformation of variables which have been done to account for heteroscedasticity but it couldn’t be remedied. Therefore, researcher used Weighted Least Squares in order to account the presence of heteroscedasticity.
The Gauss-Markov Theorem says that OLS (Ordinary Least Squares) estimates for coefficients are best linear unbiased estimators (BLUE) when the errors are normal and homoscedastic. When errors
are abnormal, the ‘E’ property (Efficient) no longer
holds for the estimators, and in small samples, the standard errors will be biased. When errors are Heteroscedastic, the standard errors become biased. Therefore, these errors must be rectified. The several standard remedies which have been tried to account for Heteroscedasticity in this sample have failed to remedy this problem. Weighted least squares (WLS) regression compensate for violation of the homoscedasticity assumption by weighing cases differentially (Garson, 2013). The results of the regression will be different because the estimated coefficients under WLS gives smaller and better estimated standard errors. WLS estimates are unbiased but efficient in the presence of Heteroscedasticity. In the case of Heteroscedasticity, WLS may also cause more predictor variables to be found to be significant, because the standard errors are now smaller. Moreover, F and t tests will be more reliable compared to OLS regression because the power is increased and type II errors in OLS regression are reduced.
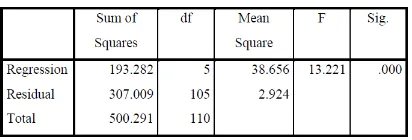
The ANOVA table below shows that the p value of F is 0.000. This is far below 0.05, and so it is considered significant. The second measurement is found by comparing the F value calculated with the F table. The F value calculated is 13.221, while the F table value is 6.39. It is bigger than the F table, therefore H0 is rejected. It is concluded that
relationship marketing’s elements simultaneously
have a significant effect on customer loyalty in this private bank.
Tabel 8. Results from Weighted Least Squares (ANOVA)
Test Measurement Item Minimum Value Clear
Information
Total Correlation 0.187 0.767 0.754 0.594 0.758
ReliabilityCronbach's Alpha Based on
Standardised Items 0.6 0.867
COMPETENCE
Test Measurement Item Minimum Value Buying Regularly
Total Correlation 0.187 0.743 0.778 0.704 0.629
ReliabilityCronbach's Alpha Based on
Standardised Items 0.6 0.867
57 There are five independent variables which are derived from the five elements of relationship marketing. Those elements are trust, commitment, communications, conflict handling, and competence. The significance values of those five elements are 0.009, 0.952, 0.664, 0.137, and 0.040 respectively. It can be seen through the values that only two elements of relationship marketing have that gives significant effect on customer loyalty individually. Trust and competence are the two elements which are confirmed to have a significant impact on customer loyalty individually.
Table 9. Results from Weighted Least Squares
Adjusted R2 is used to see the goodness of the independent variables to explain the dependent variable. The adjusted R2 shows value 0.357 which can be turned into a percentage of 35.7%. It means the variation of the independent variables can explain the dependent variable for 35.7%.
The product of the bank is intangible. Therefore it is important to build up trust among its customers. Since the product is intangible, the very first thing to have in mind is trust, because the quality of the product cannot be seen explicitly. The result of this research confirms that trust does indeed play an important role in dealing with customer loyalty. The other company values are always put customers first and passion for excellence. These two values are also well represented by the last element of relationship marketing which is competence. Competence shows significant value on t – test for 0.040. There is no doubt that this private bank has excellent training for its officers. This private bank aims for its officers to excel in banking services and in knowledge compared to other bank officers. The indicators have tied-in well
with the company’s values as seen on the
questionnaire, clear information, correct information, selling skill, and conflict handling in any situation. The indicators of putting customers first are assisting and serving to meet and to anticipate the needs of stakeholders, creating added value and solution that exceed customer expectations, and empowering human resources and support them to unleash the superior potential. Competence, which consists of the skill in things required to be done by officers, has significant effect on customer loyalty and it shows that this bank has
performed in the right pathway. Last but not least is passion for excellence which is also represented by competence, in providing the best quality of any products, services, and work processes. The bank aims to have excellent performance at each stage of interaction with its customers. Hence, it can be concluded that the research results have shown the same line of response from customers to relationship marketing officers and the required working performance from this bank which is always to prioritise customer satisfaction through excellent service with a high integrity and a desire to always be the best at working with human resources.
Observing the results of this relevant prior research, it can be explained that their research was trying to find out things from the customers, such as the trust from customers and commitment from customers. Whereas, the research undertaken in this private bank was focused on finding out how customers value the trust and commitment from bank officers toward customers. The big picture of the results are broadly the same; that relationship marketing is indeed positively correlated toward customer commitment and trust. Therefore, it is confirmed that relationship marketing is an important aspect in marketing, especially in the banking sector.
CONCLUSION
The findings of the F test explained that relationship marketing has a significant impact on customer loyalty when all the elements are regressed together as one in a multiple regression. The goodness of the regression model was also tested and it has been seen through the adjusted R2 of. 0.357 can be expressed as a percentage of 35.7%. This means that the variance of the independent variables can explain the 35.7% of the variance in the dependent variable. However, based on the t - test there are only two elements in relationship marketing which have a significant individual impact to customer loyalty, trust and competence. These results have similarities and differences when compared to relevant prior research papers. The similarities between this research and previous research is seen in the results of the t – tests which it show the individual impact of each element on customer loyalty. Trust and competence are the two elements which have a significant impact on customer loyalty. Hence, relationship marketing is important aspect in marketing especially in banking sector.
There are three big limitations in conducting the research, sample size, Heteroscedasticity problem, and the scope of the research.
58 independent variables, which is 90. However, the size of the sample could be bigger in order to have increased confidence in the results of the research. There are 7.500 customers are available to be the targeted respondents, but there only 111 respondents could be gathered to participate in the research. This sample size therefore only represented about 1.48% of the whole targeted customers. In fact, in order to have more relevant, more accurate, and precise analysis, there ideally be more than 1.48% of respondents participating.
The second limitation of this research is the presence of Heteroscedasticity. The results of the research shows that there is Heteroscedasticity in this data set and this can lead to inefficiency of the analysis.Since Heteroscedasticity is was detected, the researcher had to account for this by using WLS (weighted least squares) which is changing the basic model of OLS (ordinary least squares). Weighted Least Squares was able to account the Heteroscedasticity since its results provided the best linear unbiased estimator which means it has fulfilled the classical BLUE assumption tests. Noted that weighted least squares are not commonly used when there is no unique case happens in the data from the regression.
The third limitation of this research was the scope of the research. This research was only conducted in the area of Surabaya, but, Surabaya is just a small part of the entire area where this private bank runs its business. This private bank actually runs its business in every part of Indonesia. It has more or less 592 branch offices, while this research was conducted only in 10 branch offices. It means that the research only covered 1.68% out of the whole offices. The results cannot be generalized on the entire banking industry in the specific country because the research was conducted only in one particular area.
These are some suggested avenues for further research. The researcher has mentioned that sample size was a limitation of the research. It has been clearly stated that the sample size represented only about 1.48% of the whole customer base of this private bank in Surabaya. A suggestion is now made for further research to try to get a large sample and increase the percentage of representative towards 50%. By having more or less 50% out of 7.500 customers, the bank will be able to derive a more accurate and precise results of its performance from the point of view of its customers.
A nonlinear research methodology needs to be developed for further research if this form of Heteroscedasticity continues to hold. There needs to be a standard method to deal with the presence of Heteroscedasticity which does not take the form of straight line, but rather the form of a curve, as in this present research, in which the Heteroscedasticity was nonlinear. Important further research could be done by adding more independent variables into the
model of relationship marketing and customer loyalty. In the banking sector, there are more variables which can potentially have an impact upon customer loyalty. Elements which have not been covered in this research include personal relationship with customers, recognition, thoughtfulness of officers, and the living area of customers. The relationships which were discovered in this research need further research. Because this research focuses on banking services in one small area, Surabaya, further research in other area and sectors should be undertaken before generalisations are made to the entire service industry.
REFERENCES
Berry, L.L. (1983), "Relationship marketing", in Berry, L.L., Shostack, G.L., Upah, G.D. (Eds), Emerging Perspectives of Service Marketing, American Marketing Association, Chicago, IL, pp.25-38. Cooper, D and Schindler, P. (2011). Business
Research Method. New York: McGraw-Hill Education.
Garson, David. (2013). Weighted Least Squares Regression, 2013 Edition. Statistical Associates Publishers.
Ghozali, Imam. (2001). Aplikasi Analisis Multivariate Dengan Program SPSS. Semarang: Badan Penerbit Universitas Diponegoro.
Ghozali, Imam. (2005). Aplikasi Analisis Multivariate Dengan Program SPSS. Semarang: UNDIP.
Ghozali, Imam. (2011). Aplikasi Analisis Multivariate Dengan Program SPSS. Semarang: UNDIP.
Green, S. A. (1991). How many subjects does it take to do a multiple regression analysis? Multivariate Behavioral Research, 26, 499-510.
Griffin, Jill. (2005). Customer Loyalty: How to earn it, how to keep it. Lexington Books: An Imprint of the Free Press.
Boone L. E., & Kurtz D. L. (2007). Contemporary marketing. Philadelphia: Harcourt College Publishers.
Lind. Marchal, and Wathen. (2010). Statistical Techniques in Business and Economics (14th Edition). Singapore: McGraw-Hill Companies.
59 Mukherjee, C, White, H, ad Wuyts, M. (2013).
Econometrics and Data Analysis for Developing Countries. London: Routledge. Ndubisi, N.O. and Wah C.K. (2005). Relationship marketing and customer loyalty. Journal of Marketing Practice: Applied Marketing Science, 25(1), 98-106.
Newbold, Paul, Carlson, William, and Thorne, Betty. (2007). Statistics for Business and Economics. London: Pearson Education Inc.
Oliver, R. L. (2010). Satisfaction: A Behavioral Perspective on the Consumer. New York: McGraw Hill.
Peppers and Rogers Group. (2009). Customer Loyalty: Is it an attitude? Or behavior?. Retrieved February 10th, 2014, from: http://www.peppersandrogersgroup.com/b log/2009/10/customer-loyalty-is-it-an atti.html.
Kotler, Philip. (2012). Marketing Management. London: Prentice Hall.