Full Terms & Conditions of access and use can be found at
http://www.tandfonline.com/action/journalInformation?journalCode=cbie20
Download by: [Universitas Maritim Raja Ali Haji] Date: 18 January 2016, At: 00:28
ISSN: 0007-4918 (Print) 1472-7234 (Online) Journal homepage: http://www.tandfonline.com/loi/cbie20
Too little too late: welfare impacts of rainfall
shocks in rural Indonesia
Emmanuel Skoufias , Roy S. Katayama & B. Essama-Nssah
To cite this article: Emmanuel Skoufias , Roy S. Katayama & B. Essama-Nssah (2012) Too little too late: welfare impacts of rainfall shocks in rural Indonesia, Bulletin of Indonesian Economic Studies, 48:3, 351-368, DOI: 10.1080/00074918.2012.728638
To link to this article: http://dx.doi.org/10.1080/00074918.2012.728638
Published online: 20 Nov 2012.
Submit your article to this journal
Article views: 218
ISSN 0007-4918 print/ISSN 1472-7234 online/12/030351-18 © 2012 Indonesia Project ANU http://dx.doi.org/10.1080/00074918.2012.728638
TOO LITTLE TOO LATE:
WELFARE IMPACTS OF RAINFALL
SHOCKS IN RURAL INDONESIA
Emmanuel Skouias, Roy S. Katayama and B. EssamaNssah*
World Bank, Washington DC
We use regression analysis to assess the potential welfare impacts in rural Indo-nesia of two types of shock: a delay in monsoon onset; and a signiicant shortfall in rain during the 90-day post-onset period. Focusing on households with family farm businesses, we ind that a delay in monsoon onset does not have a signiicant effect on the welfare of rice farmers. However, rice farm households located in areas exposed to low rainfall following the monsoon are negatively affected. Such house-holds appear to be able to protect their food expenditure in the face of weather shocks, but at the expense of their non-food expenditure. We also use propensity score matching to identify community programs that might moderate the impact of this type of shock. We ind that access to credit and public works projects has the strongest moderating effect. This is an important consideration for the design and implementation of adaptation strategies.
Keywords: welfare, rainfall shocks, social protection, agriculture, rice
INTRODUCTION
In Indonesia, annual rainfall patterns are critical to agricultural output and rural livelihoods. In the cultivation of rice, the country’s most important crop, farmers typically grow seedlings in a small plot and then transplant them to looded paddy ields when rainfall is suficient. Thus, low cumulative rainfall at the beginning of the wet season can delay transplanting and subsequently the harvest (Heytens 1991). Such climate-induced delays in crop harvests can mean an extended hun-gry season for poor farmers with limited savings or food stocks. They can also undermine the prospects for a decent second harvest later in the year.
Empirical studies have shown that in Indonesia the amount of rainfall in September–December, the period encompassing the early portion of the wet sea-son, has a strong positive correlation with rice production through the area planted and the area harvested in January–April. Between 1971 and 1998, the rainfall in the September–December period explained over 80% of the variation in both the
* We wish to thank Will Martin, Syud Amer Ahmed, William Wallace and two anonymous referees for useful comments on an earlier version of this paper. The indings, interpreta -tions and conclusions are entirely those of the authors. They do not necessarily represent the views of the World Bank, its executive directors or the countries they represent.
planted and the harvested rice area in January–April (Naylor et al. 2001, 2002). These same studies made further linkages to sea surface temperature anomalies and to El Niño/La Niña climate patterns, and proposed forecasting models to inform food policy planning. Falcon et al. (2004) extended the climate–production models down to the provincial level. He suggested that with improved forecast-ing models and timely dissemination, farmers could be notiied of recommended cropping patterns to adapt to changing conditions, and agencies could be bet-ter positioned to mobilise relief efforts to assist poor and near-poor households affected by the shocks.
Although there has been extensive research on rainfall–production linkages at the aggregate level, very little is known about the welfare losses that house-holds experience from rainfall shocks, whether induced by El Niño events or not. Households with low levels of income are believed to be the most vulnerable to the effects of negative shocks, including the rainfall shocks discussed above. This is due to their geographical locations, limited assets, restricted access to resources and services, low human capital and high dependence on natural resources for income and consumption. While there is broad recognition of the threat to the poor posed by climate-induced shocks, little attention has been given to quan-tifying the household-level effects of rainfall shocks. Our analysis considers the household welfare implications of both a late monsoon onset and a low level of rainfall. As we note later, a certain amount of rainfall is needed during the 90-day post-onset period for rice to grow properly.
With projections pointing to a greater probability of rainfall shocks in the future,1 policy makers will need to know what policies can either mitigate the effects of the shocks or help households cope with them. As various social safety nets and other social assistance programs are already in place, an assessment of their role would be a good place to start. For instance, programs that give house-holds greater access to credit may help them cope with delayed or poor harvests. If community block grants are used to invest in more advanced irrigation infra-structure, they may help mitigate the effects of rainfall shocks. Or, if those grants are used to support public works projects, they may generate nonfarm employ -ment opportunities in the community. Evidence from within Indonesia conirm -ing or refut-ing such claims could help policy makers identify instruments to help protect vulnerable households. Using available data, we explore the moderating effects of various programs.
The purpose of this paper is to analyse the potential effects on welfare of rain-fall shocks in rural Indonesia, and to draw relevant policy lessons. The paper is organised as follows. The next section presents the methodology, focusing on the estimation of the effects of rainfall variability on household expenditure per capita, our measure of welfare. The guiding view here is that the distribution of welfare losses associated with such events depends on the degree of household and community-level vulnerability and the moderating effect of existing assets
1 Adapting projections by the Intergovernmental Panel on Climate Change to local con -ditions, Naylor et al. (2007) predicted that the probability of a 30-day delay in monsoon onset would increase from 9–18% at the time the study was undertaken to 30–40% by 2050. Combined with increased temperatures, such a delay could reduce rice and soybean yields by as much as 10%.
and social protection programs. Understanding these factors plays an important role in designing policies to minimise exposure to rainfall shocks and reduce their impact. The third section describes the available data and the fourth pre-sents the analytical results. The paper ends with a discussion of the study’s policy implications.
METHODOLOGY
This section describes the methodology and analytical framework used to esti-mate the effects of rainfall variability on household welfare in rural Indonesia and the potential moderating effects of community-based programs. We need to make our analytical framework consistent with the logic of vulnerability, the bedrock concept for the study of the welfare impacts of weather shocks. The distribution of economic welfare in any given society hinges crucially on individual endow-ments and behaviour and the socio-political arrangeendow-ments that govern social interaction. These factors (endowments, behaviour and social interaction) also determine the distribution of vulnerability.2
Adger (1999) emphasises the connection between individual and collective vulnerability, on the grounds that it is impossible to consider individual achieve-ment in isolation from the natural and social environachieve-ment. The vulnerability of an individual or a household to livelihood stress depends crucially on both exposure to and the ability to cope with and recover from the shock. Exposure is a function of such things as climatic and topographical factors and the extent to which liveli-hoods are dependent on the weather. The ability to cope is largely determined by access to resources, the diversity of income sources and social status within the community.3 Increased exposure combined with a reduced capacity to cope with, recover from or adapt to any exogenous stress on livelihood leads to increased vulnerability.
In our analysis, we focus on exploiting cross-sectional variation in the data. We link our welfare indicator, real per capita expenditure or some component thereof (food versus nonfood expenditure), to a rainfall shock deined on the basis of available rainfall data, focusing mainly on rural households. As noted in footnote 1, yields of crops such as rice and soybeans can be very much affected by changes in precipitation patterns.
Because of the importance of rice farming in the rural economy of Indonesia, we deine rainfall shocks with reference to this activity. In their study of the delay in monsoon onset, Naylor et al. (2007) deine ‘onset’ as the number of days after 1 August for cumulative rainfall to reach 20 centimetres – the amount needed to moisten the ground suficiently for planting – and ‘delay’ as the number of days above the mean onset date over the 25year period from 1979 to 2004. Since farmers
2 Vulnerability is usually taken to mean the likelihood that, at a given point in time, in-dividual welfare will fall short of some socially acceptable benchmark (Hoddinott and Quisumbing 2008).
3 Hoddinott and Quisumbing (2008) make essentially the same point, noting that, at the household level, vulnerability is determined by the nature of the shock, the availability of additional sources of income, the functioning of labour, credit and insurance markets, and the extent of public assistance.
typically begin planting after monsoon onset, late onset may affect the prospects for a second harvest later in the season and possibly change crop combinations, with potentially signiicant consequences for production and market prices.
While delayed onset is an important determinant of harvest, we also need to consider the amount of rainfall after monsoon onset. After farmers plant their rice ields, 60–120 centimetres of rainfall is needed during the 3–4month growout period (Naylor et al. 2002). Thus, the second dimension of our shock involves the deviation of the amount of postonset rainfall from the 25year mean for each of 32 Indonesian weather stations. We deine the amount of postonset rainfall as the total amount of rainfall during the 90-day period following the monsoon onset date.
The timing of these events is considered in relation to the 2000 Indonesian Family Life Survey (IFLS). The IFLS data on household consumption were col-lected from late June to the end of October 2000; we therefore focus on rainfall patterns from mid to late 1999 that would affect planting and harvests during the period immediately preceding the implementation of the IFLS. Considering that the degree of rainfall variability can differ across areas and that households may adjust their farming practices accordingly, we use standard deviations from the inter-temporal mean to help account for such spatial differences. In the case of delay in monsoon onset, we deine a negative shock as being more than one standard deviation above the 25year mean. In the case of the amount of post onset rainfall, we deine a negative shock as being more than two standard devia -tions below the 25year mean.
Given the connection between individual and collective vulnerability and adaptive capacity, our empirical analysis uses regression analysis to link an indi-cator of household welfare – that is, real per capita total expenditure or its food and non-food components – to some rainfall shock,while controlling for house-hold characteristics and the province of residence. We estimate a regression equa-tion of the form:
(
)
= + + +
Y ß ß X ß S ß S *F
ij 0 1 i 2 j 3 j i (1)
where Yij represents per capita household expenditure of household i in commu-nity j; Xi represents various control variables; Sj represents the covariate rainfall shocks; and Fi is a binary variable representing rice farm households. Standard errors account for clustering at the community level and stratiication by province and urban/rural sector, in line with the complex survey design of the IFLS.
After analysing the effects of rainfall shocks on welfare, we consider the poten-tial moderating effect of various community-level social assistance programs. Ideally we would like to measure, for the same household, per capita expenditure with and without the program of interest at a particular point in time. As this is not possible, we must seek alternatives.
If program placement were done randomly, simply comparing average per cap-ita household expenditure between communities with and without the program could be a good option for evaluating whether a certain program had helped households exposed to shocks. But the placement of government programs is not likely to be random (Pitt, Rosenzweig and Gibbons 1993). Many of the social safety net programs that emerged following the 1997 inancial crisis were intended to protect the poor and were thus targeted to poorer communities and households,
albeit with high leakage rates (Sumarto, Suryahadi and Widyanti 2002). Given this potential for selection bias in program placement, the distribution of com-munity and household characteristics is likely to differ between communities that have and do not have a program. One consequence of the endogeneity in program placement is that if this issue is not addressed in the analysis, it is likely to result in biased estimates of program effects, especially when cross-sectional data are used.
Recognising that government assistance programs are often targeted to poor areas, we use propensity score matching to investigate the role that various social programs (for example, safety nets or credit) can play in moderating the effect of a shock on household welfare, most likely by helping affected households cope with the shock. The method comprises two main steps. The irst step is to con -struct a propensity score model that can be used to predict the likelihood of a household or community receiving treatment, in this case, one of the social assis-tance programs. The predicted values are commonly referred to as the propen-sity scores. Assuming that, conditional on observable community characteristics, program placement is as good as random, we can consider two households with the same propensity score as being observationally equivalent. The second step is to use the scores to match each household in the group that receives the program to an equivalent household in the group without the program, such that the two groups are comparable. Hereafter, we will refer to the group of households that reside in communities with a speciic program as the ‘treatment group’ and the constructed comparison group of households without the program as the ‘control group’. With the treatment and control groups deined, the average difference in the outcome variable can then be estimated.
We estimate propensity scores on covariates using probit regressions and retrieve their predicted values to allow for the matching of ‘treated’ observations with comparable ‘untreated’ observations in communities without the program. For each program, a separate stepwise estimation of the probit speciication is performed such that variables with a p-value of less than 0.2 are added to the regression. The dependent variable is a binary variable indicating whether or not a household resides in a community that is participating in the speciic program of interest. The list of possible right-hand-side variables for the stepwise estima-tion includes household and community variables, and binary variables for the different provinces. The household variables always included in the model are household size; age of head; educational level of head; household use of electric -ity; ownership of farmland; ownership of a household nonfarm business; and ownership of a household farm business. Candidate household variables are marital status of head and gender of head. The candidate community variables are availability of public transport; availability of piped water; predominance of asphalt roads; share of households with electricity; distance to provincial capi -tal; distance to district capi-tal; shares of household heads with elementary, junior high school, high school and universitylevel education; and share of households with a ‘poverty certiicate’.4 All rural households included in the IFLS form the sample for the probit regressions.
4 A poverty certiicate (Surat Keterangan Tidak Mampu) allows holders to get free treat -ment at hospitals and clinics. It is issued by local authorities to certify a household’s pov-erty status.
After estimating the propensity scores, we trim the observations to obtain a common range of scores for both ‘treated’ and ‘untreated’ observations. Then, we match each ‘treated’ household to its three ‘nearest neighbours’ based on pro-pensity scores from the group of ‘untreated’ households. The matching process is done with replacement, such that all ‘untreated’ households are available as candidates for each of the ‘treated’ households.To adjust for inexact matches of the propensity scores, regression adjustments are performed as in Abadie et al. (2004). We then compare the average outcome for households in the treatment group (that is, in communities with a speciic program) to the average outcome for similar households in the control group (that is, living in communities without the program under consideration).
To describe this somewhat more formally, let Yi (1) denote the per capita expenditure outcome of household i in the presence of some ‘treatment’ attribute in the local community, such as a safety net program or a type of infrastructure, and let Yi (0) denote the per capita expenditure outcome of household i in the absence of the attribute in the local community. As it is not possible to observe both Yi (1) and Yi (0) simultaneously for the same household, we must construct a counterfactual group of households in communities that do not have the ‘treat-ment’ attribute of interest but do have a similar probability of having the attribute based on observable community characteristics. Through a matching process, we deine biascorrected matching estimators, Yˆ (0)i , in place of Yi (0),5 and estimate the sample average treatment effect for the treated (sub-population) (SATT):
{
}
where Wi = 1 indicates that a household is in a community with the treatment attribute, and n1 is the sample size of the treatment group.
DATA
We are able to study the effects of extreme weather events on rural households by merging household and community-level data from the 2000 IFLS with daily rainfall data covering the 25year period from 1979 to 2004. The combined data set contains information on rainfall, household expenditure, household-level socio-economic characteristics and community-level attributes. The IFLS household and community surveys were ielded from late June to the end of October 2000.
The community surveys include data on whether various social programs were available in the community in 1999–2000. It should be noted that the data do not indicate which households actually participated in the programs.
The household-level data provide information on the value of aggregate con-sumption and its food and non-food components. The food component consists of 37 food items and includes purchases, own production and gifts/transfers con-sumed within the last week. The non-food component consists of frequently pur-chased goods and services (utilities, personal toiletries, household items, domestic services, recreation and entertainment, transport, sweepstakes); less frequent pur -chases and durables (clothing, furniture, health care, ceremonies, tax); housing;
5 See Abadie and Imbens (2002) and Abadie et al. (2004) for details.
and educational expenditures for children living in the household. Transfers out of the household are excluded. All values are calculated on a monthly basis and are expressed in real terms. To obtain real values, we used both temporal and spa-tial delators, with prices in December 2000 in Jakarta as the base.6
Using daily rainfall data from 1979 to 2004 obtained from the Indonesian Meteorological Agency,7 we calculated the 25year mean and standard devia -tions for monsoon onset and the amount of post-onset rainfall for 32 weather stations. The rainfall data from these stations were then matched to communities in the IFLS. Weather data were merged with household survey data at the com-munity level based on proximity. Only weather stations with complete data for the 25year period were used.
After the available precipitation data were merged and observations with miss-ing data dropped, the sample size for the analysis was reduced to 6,188 house-holds from a total of 10,292 in the 2000 IFLS. The matched data covered a total of 267 communities and 32 weather stations. In rural areas, 106 communities (a total of 3,290 households) in nine provinces were matched to 27 stations. In rural Java, 66 communities (a total of 2,159 households) in four provinces were matched to 18 stations. The number of communities per station ranged from one to ten in rural areas. Data from additional weather stations would beneit the analysis by improving the level of disaggregation of weather data, but such data could not be obtained.
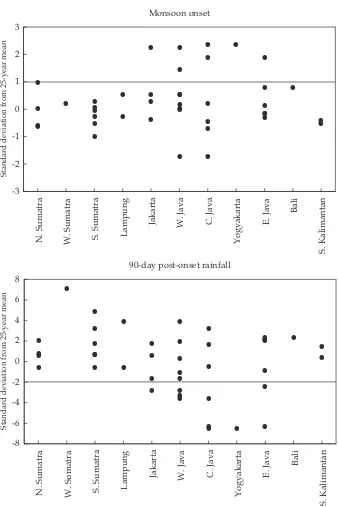
Figure 1 shows the variation in monsoon onset and post-onset rainfall in 1999– 2000, by province. Only provinces in Java experienced a delay in monsoon onset greater than one standard deviation from the 25year mean, and only the Java -nese provinces experienced rainfall more than two standard deviations below the 25year mean during the 90day postonset period.
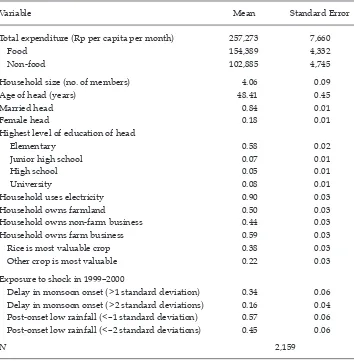
The summary statistics for household expenditure, household characteristics and exposure to rainfall shocks in rural Java are shown in table 1. The majority of household heads are married, male and do not have more than an elementary education. The vast majority of households use electricity. Half of the households own farmland, and 44% are engaged in non-farm businesses. Another 60% of households are engaged in farm businesses, 38% with rice as the most valuable crop and 22% with another crop as the most valuable. Turning to the rainfall-shock variables, we see that 34% of households in the sample are exposed to delayed monsoon onset and 45% to postonset low rainfall. The correlation coef -icient between these two variables for our sample is not large, at 0.38.
EMPIRICAL RESULTS
We present our indings irst on the impact of rainfall shocks on per capita house -hold consumption levels, and second on the role that various social programs may have played in helping households cope with the negative effects of the shocks.
6 The spatial delator used is the ratio of the local poverty line (provincial, urban/rural area) to the Jakarta poverty line, in December 2000 prices. Thus, the delator converts the local December 2000 values into Jakarta December 2000 values.
7 Imputed values for missing data were provided by Centre Européen de Recherche et d’Enseignement des Géosciences de l’Environnement.
FIGURE 1 Variation in Monsoon Onset and Post-onset Rainfall by Province, 1999–2000a
a A negative shock is deined as more than one standard deviation above the 25year mean for mon-soon onset, and more than two standard deviations below the 25year mean for postonset rainfall.
Source: Authors’ calculations based on the Indonesian Family Life Survey and rainfall data from the
Indonesian Meteorological Agency.
N. Sumatra W. Sumatra S. Sumatra Lampung
Jakarta W. Java C. Java
N. Sumatra W. Sumatra S. Sumatra Lampung
Jakarta W. Java C. Java
For the irst part, we use regression analysis to quantify the average reduction in household welfare for those exposed to a low-rainfall shock. For the second part, we use propensity score matching to estimate the extent of the moderating effect offered by the various community-based social assistance programs.
Welfare effects of rainfall shocks
Given the importance of rain-fed agriculture, particularly rice farming, to rural livelihoods in Indonesia, we study the potential impact of rainfall shocks on per capita total household expenditure, and its food and non-food components. We focus on rural Java, Indonesia’s main rice production area, and use regression analysis to estimate the effects on household expenditure.
We include in our regressions two binary variables representing the two rain-fall shocks deined earlier: delayed monsoon onset; and postonset low rainrain-fall.
TABLE 1 Summary Statistics for Households in Rural Java, 2000
Variable Mean Standard Error
Total expenditure (Rp per capita per month) 257,273 7,660
Food 154,389 4,332
Non-food 102,885 4,745
Household size (no. of members) 4.06 0.09
Age of head (years) 48.41 0.45
Married head 0.84 0.01
Female head 0.18 0.01
Highest level of education of head
Elementary 0.58 0.02
Junior high school 0.07 0.01
High school 0.05 0.01
University 0.08 0.01
Household uses electricity 0.90 0.03
Household owns farmland 0.50 0.03
Household owns non-farm business 0.44 0.03
Household owns farm business 0.59 0.03
Rice is most valuable crop 0.38 0.03
Other crop is most valuable 0.22 0.03
Exposure to shock in 1999–2000
Delay in monsoon onset (>1 standard deviation) 0.34 0.06 Delay in monsoon onset (>2 standard deviations) 0.16 0.04 Postonset low rainfall (<–1 standard deviation) 0.57 0.06 Postonset low rainfall (<–2 standard deviations) 0.45 0.06
N 2,159
Source: Authors’ calculations based on the Indonesian Family Life Survey and rainfall data from the
Indonesian Meteorological Agency.
We interact these shock variables with a binary variable for rice farm households, speciically households engaged in a farm business with rice as the most valuable crop. This is done to differentiate the effect of the shocks between households that have and do not have a farm business with rice as the most valuable crop. In the regressions, we control for various household characteristics: household size; age of household head; gender and marital status of head; level of education of the head (binary variables for elementary school, junior high school, high school and university); use of electricity; ownership of farmland; ownership of a household farm or nonfarm business; whether or not rice is the most valuable crop; and province of residence. The reference case is a household in rural West Java prov-ince, with an uneducated, single, male head, that does not use electricity, has no farmland and has no household farm or non-farm businesses.
Using the two rainfall-shock variables separately as well as together, we use three different speciications for the regressions. The irst includes a binary vari -able for delayed monsoon onset and its interaction term with the binary vari-able for a rice farm household. The second substitutes the post-onset low-rainfall variable as the shock variable. The third includes both rainfall-shock variables together with their interaction terms. This third variation is used with different dependent variables, that is, per capita total household expenditure and its food and non-food components.
As might have been expected, there is a strong positive correlation between household per capita expenditure and assets, namely education and ownership of farmland (table 2). All education coeficients are positive and signiicantly dif -ferent from zero. For all ive of the regressions reported in table 2, the magnitude of these coeficients increases with the level of education up to high school. How -ever, the coeficients for university education are smaller than those associated with high school, which is rather unusual. In general, the province of residence does not seem to matter in the explanation of variations in household welfare, as the associated coeficients are not signiicantly different from zero. Households with electricity are better off than those without it. This is manifested by a positive and signiicant effect on per capita expenditure. Similarly, owning farmland or a nonfarm business has a positive and signiicant effect on household expenditure and its food and non-food components.
In the absence of a weather shock, our results show that there is no statistically signiicant difference between the average welfare of households for which rice is the most valuable crop and that of the reference household (table 2). On the other hand, we ind that the per capita nonfood expenditure of households running a farm business with non-rice crops as the most valuable is about 12% lower than that of the reference household.
How we deine the rainfallshock variables is important in our speciications. While a shock deined by a delay in monsoon onset has a negative effect on the per capita total expenditure of rural households in Java, the result is not statisti-cally signiicant. This is contrary to the signiicant negative effects reported in Korkeala, Newhouse and Duarte (2009) based on panel data. However, when we look at the food component of expenditures, the same shock is associated with a 13% drop in per capita food expenditure relative to the reference household.
If the amount of rainfall during the 90-day post-onset period is more than two standard deviations below the 25year mean, the coeficients associated with the
interaction between the post-onset low-rainfall shock and rice farming are nega-tive and signiicantly different from zero (at a 95% level of signiicance) for total and non-food expenditures. With exposure to the low-rainfall shock, the per cap-ita total expenditure of households engaged in rice farming is 12–14% lower than that of the reference household and the per capita non-food expenditure is 26% lower, controlling for household attributes and province of residence.
In contrast, we ind that the interaction of the lowrainfall shock with the binary variable identifying households engaged in rice farming does not have a statistically signiicant effect on food consumption. This result, which has been frequently observed among rural households in different countries (Skouias and Quisumbing 2005), suggests that rice farm households are able to protect their food consumption in the face of weather shocks, but at the expense of their non-food consumption. To the extent that reduced expenditure on non-non-food consump-tion is accompanied by lower spending on children’s educaconsump-tion, weather-related shocks may also be associated with reduced investment in the human capital of children (Jacoby and Skouias 1997).
Role of community programs
As noted earlier, the vulnerability of an individual or a household to livelihood stress depends on both exposure to the shock and the ability to cope with and recover from it. The ability to cope is largely determined by access to resources, including savings as well as cash and in-kind transfers as part of a social assis-tance program. We explore the role of the following six social assisassis-tance programs in mitigating the effects of shocks in rural areas of Java:
• availability of credit through the Inpres Poor Villages Program;
• the Inpres Program for Underdeveloped Villages (Inpres Desa Tertinggal, IDT), involving block grants to improve infrastructure in extremely poor villages and to help poor families start up enterprises (Sumarto, Suryahadi and Widyanti 2002);
• the Kampung Improvement Program (Program Perbaikan Kampung), a program to upgrade housing settlements with basic services and infrastructure through communitybased organisations;
• Padat Karya, a loose collection of labourintensive workfare programs sponsored by various government departments (Sumarto, Suryahadi and Widyanti 2002);
• the communitybased Infrastructure Development Program for Under developed Villages (Proyek Peningkatan Pembangunan Desa Tertinggal, P3DT); and
• the Program of Regional Empowerment to Overcome the Impact of the Economic Crisis (Program Pemberdayaan Daerah Mengatasi Dampak Krisis Ekonomi, PDMDKE), involving block grants to villages to support revolving funds for credit or public works projects that offer nonfarm employment opportunities (Sumarto, Suryahadi and Widyanti 2002).
These programs may assist households to cope with having less farm income, smaller harvests or higher prices, by enhancing their access to credit, providing cash or in-kind transfers or generating labour opportunities.
362
Emmanuel Skouias, Roy S. Katayama and B. Essama
Nssah
TABLE 2 Regression Results of Shocks on Household Consumption in Rural Java, 2000a
Dependent Variable Total Per Capita
Expenditure (log)
Shock in 1999–2000: delay in monsoon onset (>1 standard deviation)
–0.042 –0.035 0.103 –0.132 **
(0.064) (0.065) (0.084) (0.061)
Shock in 1999–2000: post-onset low-rainfall (<–2 standard deviations)
–0.036 –0.027 –0.034 –0.019
(0.054) (0.055) (0.076) (0.049)
Household farm business with rice as most valuable crop
0.002 0.056 0.041 0.072 0.034
(0.042) (0.047) (0.046) (0.065) (0.042)
Household farm business with other crop as most valuable
–0.046 –0.047 –0.046 –0.117 ** 0.003
(0.044) (0.046) (0.045) (0.054) (0.048)
Interaction of household farm business (rice most valuable crop) with delay in monsoon onset shock
0.024 0.072 0.037 0.118 *
(0.062) (0.072) (0.114) (0.063)
Interaction of household farm business (rice most valuable crop) with low-rainfall shock
T
oo little too late: welfar
e impacts of rainfall shocks in r
ural Indonesia
363
Highest education of head: elementary 0.091 ** 0.086 ** 0.087 ** 0.172 *** 0.039
(0.044) (0.042) (0.042) (0.051) (0.045)
Highest education of head: junior high school 0.214 *** 0.206 *** 0.207 *** 0.358 *** 0.123
(0.071) (0.070) (0.070) (0.085) (0.075)
Highest education of head: high school 0.506 *** 0.502 *** 0.503 *** 0.786 *** 0.300 ***
(0.084) (0.083) (0.083) (0.093) (0.087)
Highest education of head: university 0.212 ** 0.205 ** 0.205 ** 0.350 *** 0.098
(0.099) (0.095) (0.095) (0.117) (0.088)
Central Java province –0.072 –0.055 –0.057 –0.007 –0.075
(0.076) (0.073) (0.073) (0.097) (0.068)
Yogyakarta province –0.038 0.004 0.005 0.044 –0.023
(0.114) (0.106) (0.112) (0.134) (0.115)
East Java province –0.071 –0.063 –0.061 –0.016 –0.106 **
(0.058) (0.057) (0.056) (0.088) (0.047)
Household uses electricity 0.158 ** 0.188 *** 0.188 *** 0.441 *** 0.060
(0.066) (0.062) (0.062) (0.106) (0.063)
Household owns farmland 0.114 *** 0.117 *** 0.116 *** 0.131 *** 0.080 **
(0.032) (0.032) (0.032) (0.046) (0.033)
Household owns non-farm business 0.172 *** 0.170 *** 0.170 *** 0.228 *** 0.131 ***
(0.035) (0.034) (0.034) (0.044) (0.034)
Constant 11.972 *** 11.946 *** 11.952 *** 10.431 *** 11.574 ***
(0.199) (0.193) (0.191) (0.277) (0.170)
N 2,159 2,159 2,159 2,159 2,159
R2 0.196 0.200 0.201 0.189 0.175
a * = p < 0.1; ** = p < 0.05; *** = p < 0.01. Standard errors are in parentheses.
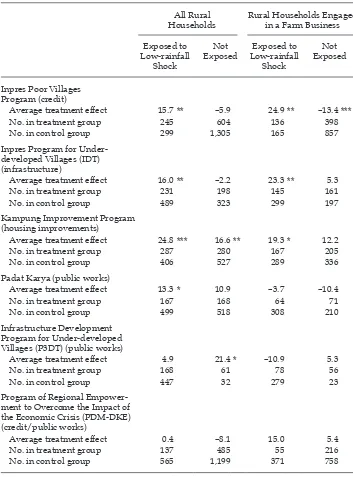
As discussed earlier, recognising that government assistance programs are often targeted to poor areas, we use propensity score matching to infer the mod-erating effect of some community-level interventions after a shock. For each of these community-based programs, we estimate the average treatment effect of the intervention on per capita total household expenditure among households exposed to the shock and located in communities that have the program of inter-est (that is, the sample average treatment effect for the treated, or SATT). To assess whether the beneits of a program differ according to the presence or absence of a shock, we also estimate the SATT among households not exposed to the shock. In addition, we repeat the procedure after limiting the sub-sample to rural house-holds engaged in a farm business. The results, in table 3, are shown as the percent-age difference in mean per capita expenditure between the treatment and control groups. The irst two columns relate to the sample of households in rural Java; the second two focus on the sub-sample engaged in a farm business.8
The results for both the Inpres Poor Villages Program and the IDT program indicate positive and signiicant average treatment effects that are greater among rural households engaged in farm businesses than among all rural households. Among all rural households in Java, households in communities with the Inpres credit program and exposed to a lowrainfall shock on average had 15.7% higher per capita expenditure than the control group (the group without the Inpres pro-gram). Among communities not exposed to the shock, the Inpres program was not associated with any signiicant difference in average treatment effects. For the sub-sample engaged in farm businesses and hit by a rainfall shock, average per capita expenditure levels in communities with the program were 24.9% greater than in communities without the program. Among households not exposed to the shock, the average treatment effect was –13.4%, a result that was statistically signiicant at the 95% conidence level. These indings suggest that the greater access to credit furnished by the Inpres program may have allowed households to borrow to maintain household consumption levels in cases where rainfall shocks had diminished harvests, constituting an important coping mechanism for such households.
Similarly, the average treatment effects of the IDT program, which provides block grants for under-developed villages, were 16.0% among all rural house-holds exposed to the shock and 23.3% among the sub-sample engaged in farm businesses. Both results were signiicant at the 95% conidence level. The cor -responding treatment effects among households not exposed to the shock were smaller (–2.2% and 5.3%) but these results were not statistically signiicant. This suggests that the IDT block grant program may have provided some relief for rural households hit by a rainfall shock, in particular farming households, prob-ably by generating employment opportunities locally through various public works projects.
The results for the Kampung Improvement Program indicate positive average treatment effects of 24.8% and 16.6% respectively for rural households exposed and not exposed to a rainfall shock, and 19.3% and 12.2% for the sub-sample lim-ited to households engaged in farm businesses. In contrast to the Inpres and IDT
8 We also attempted to extend the analysis to farmers for whom rice was the most valuable crop, but the data thinned out, precluding application of the approach to this sub-sample.
TABLE 3 Moderating Effect of Community-based Programs in Rural Java
(average treatment effect based on propensity score matching)a
All Rural
Average treatment effect 15.7 ** –5.9 24.9** –13.4***
No. in treatment group 245 604 136 398
No. in treatment group 287 280 167 205
No. in control group 406 527 289 336
Average treatment effect 4.9 21.4* –10.9 5.3
No. in treatment group 168 61 78 56
No. in control group 447 32 279 23
Program of Regional Empower ment to Overcome the Impact of the Economic Crisis (PDMDKE) (credit/public works)
Average treatment effect 0.4 –8.1 15.0 5.4
No. in treatment group 137 485 55 216
No. in control group 565 1,199 371 758
a * = p < 0.1; ** = p < 0.05; *** = p < 0.01. The average treatment effect for the treated is expressed as the percentage difference in average per capita total household expenditure between the treatment and control groups. The numbers in the treatment and control groups are after trimming to a common range of propensity score values and before matching.
Source: Authors’ calculations based on the Indonesian Family Life Survey and rainfall data from the
Indonesian Meteorological Agency.
results, the average treatment effect for the sub-sample engaged in farm busi-nesses was smaller than that for the larger rural sample, although the 19.3% result was only weakly signiicant at the 90% conidence level. The average treatment effects for the sub-samples not exposed to a shock were smaller than the cor-responding results for the samples exposed to a shock. The exact mechanisms by which this program may have yielded these results are not apparent, but one might venture to guess that improvements in infrastructure may have helped mit-igate the effects of a low-rainfall shock. Given the positive results, further investi-gation would be worthwhile.
The Padat Karya labourintensive workfare program had an average treatment effect of 13.3% among rural households exposed to a low-rainfall shock, but this was only weakly signiicant at the 90% conidence level. The other results for the program were statistically insigniicant for households exposed to the low rainfall shock. Nevertheless, it appears to exhibit potential as an effective safety net in alleviating the stress induced by a rainfall shock.
The results for the Infrastructure Development Program (P3DT) and the Pro -gram of Regional Empowerment (PDMDKE) were statistically insigniicant. It is not possible to say much about the effectiveness of these programs in the context of rainfall shocks.
The above results suggest that access to credit and public works projects in com -munities can help households cope with shocks and thereby play a strong protec-tive role during times of crisis. They also suggest that infrastructure improvement programs may help mitigate the effects of the shocks. In light of these indings, these policy instruments should be given due consideration in the design and implementation of adaptation strategies.
CONCLUDING REMARKS
Very little empirical evidence exists on the welfare losses that households experi-ence as a consequexperi-ence of weather shocks. In principle, households with low lev-els of income are most vulnerable to the effects of weather extremes, given their geographical locations, limited assets, restricted access to resources and services, low human capital and high dependence on natural resources for income and consumption. While there is broad recognition of the threat to the poor posed by climate-induced shocks, little attention has been given to quantifying the effects of weather extremes and identifying targeted measures that could mitigate the poverty impacts. This paper has sought to make a contribution by analysing the potential welfare effects of rainfall shocks in rural Indonesia with a focus on households engaged in family farm businesses, in particular rice farming. It has also attempted to identify community interventions with the potential to dampen the adverse effects of climate change and extreme weather. The paper has focused on rice farming because rice is a staple food in Indonesia.
The basic approach adopted here has been to exploit cross-sectional variation in the data and link a welfare indicator, real consumption per capita or some component thereof (that is, food and non-food expenditure), to a weather shock deined on the basis of available rainfall data, focusing mainly on rural house -holds. In particular, we considered two types of shock: delayed monsoon onset; and a shortfall of rain in the 90-day period following monsoon onset. We found
that a delay in monsoon onset did not have a signiicant effect on the welfare of rural households. However, rice farm households located in areas experiencing low rainfall following monsoon onset were negatively affected by the low-rainfall shock. Non-food expenditure per capita was the most affected component. This suggests that rice farm households protect their food expenditure in the face of weather shocks. Further study is needed to better understand these choices and their implications for adaptation strategies.
To identify policy instruments that might moderate the welfare effects of weather-related shocks, we used propensity score matching to evaluate various social assistance programs. The results indicated that credit, safety net and pub-lic works programs offered the strongest cushion against these types of shocks. This is an important consideration for the design and implementation of strate-gies to protect poor, vulnerable households. Indeed, individual ability to cope with and recover from crises hinges critically on the available social support. Taken together with other emerging evidence on the long-lasting effects of rain-fall shocks on human capital (Maccini and Yang 2009), our indings highlight the urgent need for effective adaptation strategies.
REFERENCES
Abadie, A. and Imbens, G. (2002) ‘Simple and bias-corrected matching estimators’, Techni-cal Report, Department of Economics, University of California, Berkeley CA.
Abadie, A., Drukker, D., Herr, J.L. and Imbens, G. (2004) ‘Implementing matching estima-tors for average treatment effects in Stata’, Stata Journal 4 (3): 290–311.
Adger, W.N. (1999) ‘Social vulnerability to climate change and extremes in coastal Viet-nam’, World Development 27 (2): 249–69.
Falcon, W., Naylor, R.L., Smith, W.L., Burke, M.B. and McCullough, E.B. (2004) ‘Using cli-mate models to improve Indonesian food security’, Bulletin of Indonesian Economic Stud-ies 40 (3): 355–77.
Heytens, P. (1991) ‘Rice production systems’, in Rice Policy in Indonesia, eds S. Pearson, W. Falcon, P. Heytens, E. Monke and R. Naylor, Cornell University Press, Ithaca NY: 38–57.
Hoddinott, J. and Quisumbing, A.R. (2008) ‘Methods for microeconometric risk and vul-nerability assessments’, International Food Policy Research Institute, Washington DC, 8 October.
Jacoby, H.G. and Skouias, E. (1997) ‘Risk, inancial markets, and human capital in a devel -oping country’, Review of Economic Studies 64 (3): 311–35.
Korkeala, O., Newhouse, D. and Duarte, M. (2009) ‘Distributional impact analysis of past climate variability in rural Indonesia’, World Bank Policy Research Working Paper No. 5070, World Bank, Washington DC.
Maccini, S. and Yang, D. (2009) ‘Under the weather: health, schooling, and economic conse-quences of early-life rainfall’, American Economic Review 99(3): 1,006–26.
Naylor, R.L., Falcon, W.P., Rochberg, D. and Wada, N. (2001) ‘Using El Niño/Southern Oscillation climate data to predict rice production in Indonesia’, Climate Change 50: 255–65.
Naylor, R.L., Falcon, W., Wada, N. and Rochberg, D. (2002) ‘Using El Niño/Southern Oscil-lation climate data to improve food policy planning in Indonesia’, Bulletin of Indonesian Economic Studies 38 (1): 75–91.
Naylor, R.L., Battisti, D., Vimont, D., Falcon, W. and Burke, M. (2007) ‘Assessing risks of climate variability and climate change for Indonesian rice agriculture’, Proceedings of the National Academy of Sciences 104 (19): 7,752–7.
Pitt, M.M., Rosenzweig, M.R. and Gibbons, D.M. (1993) ‘The determinants and conse -quences of the placement of government programs in Indonesia’, World Bank Economic Review 6 (3): 319–48.
Skouias, E. and Quisumbing, A. (2005) ‘Consumption insurance and vulnerability to pov -erty: a synthesis of the evidence from Bangladesh, Ethiopia, Mali, Mexico and Russia’,
European Journal of Development Research 17 (1): 24–58.
Sumarto, S., Suryahadi, A. and Widyanti, W. (2002) ‘Designs and implementation of Indo-nesian social safety net programs’, Developing Economies 40 (1): 3–31.