Full Terms & Conditions of access and use can be found at
http://www.tandfonline.com/action/journalInformation?journalCode=vjeb20
Download by: [Universitas Maritim Raja Ali Haji] Date: 11 January 2016, At: 20:41
Journal of Education for Business
ISSN: 0883-2323 (Print) 1940-3356 (Online) Journal homepage: http://www.tandfonline.com/loi/vjeb20
Developing and Assessing E-Learning Techniques
for Teaching Forecasting
Yulia R. Gel, R. Jeanette O’Hara Hines, He Chen, Kimihiro Noguchi & Vivian
Schoner
To cite this article: Yulia R. Gel, R. Jeanette O’Hara Hines, He Chen, Kimihiro Noguchi & Vivian Schoner (2014) Developing and Assessing E-Learning Techniques for Teaching Forecasting, Journal of Education for Business, 89:5, 215-221, DOI: 10.1080/08832323.2013.856281 To link to this article: http://dx.doi.org/10.1080/08832323.2013.856281
Published online: 03 Jul 2014.
Submit your article to this journal
Article views: 98
View related articles
Developing and Assessing E-Learning Techniques
for Teaching Forecasting
Yulia R. Gel
University of Waterloo, Waterloo, Ontario, Canada; and Saint Petersburg State University, St. Petersburg, Russia
R. Jeanette O’Hara Hines
University of Waterloo, Waterloo, Ontario, Canada
He Chen
Spartan Fund Management Inc., Toronto, Ontario, Canada
Kimihiro Noguchi
Colorado State University, Fort Collins, Colorado, USA
Vivian Schoner
University of Waterloo, Waterloo, Ontario, Canada
In the modern business environment, managers are increasingly required to perform decision making and evaluate related risks based on quantitative information in the face of uncertainty, which in turn increases demand for business professionals with sound skills and hands-on experience with statistical data analysis. Computer-based training technologies allow the new cadre of business professionals to obtain such a hands-on experience in an environment where mistakes can be made and outcomes can be measured. The authors discuss their experiences in developing a new e-learning tool designed to apply methodological forecasting concepts to real-life business and finance problems through an interactive self-learning and self-assessing module of online case studies.
Keywords: business statistics, decision making and analysis, e-learning, forecasting, interactive learning, technology in education
Recent developments in technology have advanced to the point where nearly every quantitative area in business relies on statistical analysis. As a result, there is an increas-ing student interest in statistical courses and a market-driven demand for business professionals with solid skills in applied data analysis who can perform reliable decision making in the face of uncertainty. Hence, statistics, being at the intersection of multiple disciplines, goes far beyond
simply deriving mathematical formulas in the classroom. Instead, statistics now requires well-developed practical skills in data analysis that are best acquired through inten-sive work with real-world case studies, systems, and soft-ware. The challenge is to provide this training in an environment where mistakes can be made and outcomes can be measured (Arsham, 2013).
Nowadays, computer-assisted learning and various related e-learning techniques are widely recognized as flexi-ble, fast, and efficient ways to deliver new knowledge that helps bring just-in-time critical professional improvements and training while minimizing time and costs involved (Burrill, 2009; Ghaoui & Janvier, 2004). Here, bye-learning
Correspondence should be addressed to Yulia R. Gel, University of Waterloo, Department of Statistics and Actuarial Science, 200 University Avenue West, Waterloo, Ontario N2L 3G1, Canada. E-mail: ygl@math. uwaterloo.ca
ISSN: 0883-2323 print / 1940-3356 online DOI: 10.1080/08832323.2013.856281
we mean all forms of computer technology assisted teaching and learning, including both in- and out-of-class experience, with a particular focus on web-based interactive applications (Tavangarian, Leypold, N€olting, & R€oser, 2004). Neverthe-less, although interactive e-learning modules are already uti-lized for developing competence in using introductory statistics for business and finance applications, there still exists a lack of interactive tools which offer a balanced combination of rigorous modern statistical methodology, in-depth practical studies, and self-paced educational options for an academic environment (Nolan & Temple Lang, 2007; 2010; Pfeil, 2006; Pratt, Davies & Connor, 2011). In partic-ular, while there have been a variety of different e-learning-in-statistics initiatives worldwide (Alldredge & Som, 2002; Davies & Barnett, 2005; Fields & Collins, 2005; Gonzalez & Munoz, 2006; H€ardle, Klinke, & Ziegenhagen, 2006, 2007; Hilton & Christensen, 2002), the focus of such proj-ects is mainly on introductory statistical courses rather than on more advanced time series and forecasting methodology. Moreover, while many textbooks either offer a complimen-tary software packages (see Bowerman, O’Connell, & Koehler, 2004; Brockwell & Davis, 2002; Newton, 1988) or provide examples in one of the statistical programming lan-guages (see Cowpertwait, 2009; Cryer, 2008; Shumway & Stoffer, 2006; Yaffe, 2000), these options are typically static and do not allow for an interactive learning environment. A few recent initiatives in this direction include the projects by Madsen, Albeanu, Burtschy, and Popentiu-Vladicescu (2006) and Albeanu, Madsen, Popentiu-Vladicescu, and Dumitru (2010) who proposed the learning system e-TJMES and JAVA-module for exploratory time series anal-ysis. Aydinli, H€ardle, and R€onz (2003) discussed integration of the statistical software R and Microsoft Excel for teach-ing time series, and Georgios, Stoyanova, and Onkov (2005) focused on e-learning of trend modeling in a web environment. Recently, Shmueli (2012) emphasized the importance of interactive e-learning techniques in providing hands-on experience in forecasting and offered an interac-tive visualization package for exploring the nature of the observed time series.
Even less is known about the effectiveness of e-learning tools for enhancing educational outcomes of academic courses in more advanced statistics. In this paper, our goal is to bridge this gap between the modern e-learning techni-ques and academic environment of undergraduate courses in statistics with applications in business, finance, and insurance, and to assess the impact of interactive web-based e-learning on teaching and learning progress. In particular, our key innovation consists of developing, integration, and evaluation of a new interactive e-learning concept for a higher level undergraduate training in forecasting. The main idea of the proposed e-learning approach is based on a fusion of practical forecasting case studies illustrating various statistical modeling procedures, statistical software (in our case R) that is used for implementation of
computational methods, and interactive capabilities of the Learning Management System (LMS; in our case ANGEL). It is important to emphasize that our focus is not on devel-oping a new software package for time series modeling and prediction but rather on elaborating interactive e-learning techniques for teaching forecasting. Note that the proposed e-learning concept is not restricted to statistical software R and can be easily transferred to any other computational software (e.g., Matlab, SPSS, SAS) as well as it is not restricted to the LMS ANGEL but is open to any other LMS allowing for randomization of questions and answers in online quizzes. Although in this paper we discuss our experience on implementation and assessment of the pro-posed new web-based e-learning procedures for teaching a higher level undergraduate course in forecasting at the Uni-versity of Waterloo, Canada, based on our results, we believe that similar interactive e-learning techniques might be found useful for distance education courses and graduate programs in computational finance, econometrics, statistics, actuarial sciences and other quantitative disciplines, with a strong focus on applied aspects of modeling and data analysis.
The article is organized as follows. The next section describes the developed e-learning tool. Then, we assess effectiveness of the proposed e-learning techniques. Last, we conclude with the discussion.
METHOD
Participants
In our project, we focus on the 400-level undergraduate course Forecasting, offered by the Department of Statistics and Actuarial Science at the University of Waterloo three times per year (i.e., in each of the 12-week-long winter, spring, and fall terms). The enrolled students are supposed to have a background in applied linear regression. Most of the enrolled students are either from actuarial science or from the business administration and mathematics double degree program. The Society of Actuaries (SOA) recog-nizes a final grade of at least 70 in the forecasting course as qualifying a student for a SOA credit. Hence, the course is getting increasingly popular over last few years. Indeed, over the period of 2005–2011, the average number of regis-tered students is about 135, while in 2012 the enrollment surged to more than 200.
Instrument
Given the practically oriented majors of enrolled students, the course is very application driven and computationally intense, and focuses more on employment of statistical methods to real-life situations, such as predicting sales, stock returns, or supplies, rather than on derivation of mathematical formulas and proofs. This, along with the
216 Y. R. GEL ET AL.
increasing enrollment numbers, requires complementary learning skills and revision of instructional approaches in order to improve the fit of the lecture material into cutting-edge real life business applications. To enhance educational outcomes, our idea was to incorporate into these two courses elements of interactive learning, such as online self-educational illustrative case studies with self-evalua-tion opself-evalua-tions, an online bank of test quesself-evalua-tions and a library of real-world data sets. We then assessed the learning pro-cess in the new environment.
While the online repository of data sets serves a comple-mentary role of an informational source for student projects, homework, and exercises, the core element in the developed module is a set of real-life case studies illustrating various modeling and forecasting techniques in business, finance and economics, which allow students to self-assess their understanding of the methodological and computational aspects using online interactive tests. In particular, we developed three such case studies involving short-, medium-, and long-term prediction of sales of Australian fortified wine (data are from the repository of Hyndman [n. d.]), the 25 years of household financial obligations and daily stock returns of an electronics company in the United States. Each case study is divided into a sequence of chap-ters such that the same data are analyzed and modeled using different approaches showing a step-by-step application of incrementally more sophisticated techniques and methods that are discussed in class. Some examples of those techni-ques are exploratory diagnostic tests for time series data, regression analysis with endo- and exogenous variables, the Holt-Winters smoothing techniques, the Box-Jenkins meth-odology (Autoregressive Moving Average/Autoregressive Integrated Moving Average [ARIMA]/Seasonal Autoregres-sive Integrated Moving Average), as well as stochastic vola-tility and conditional heteroscedastic models.
The goal is to teach students that there is no “perfect rec-ipe” in business forecasting or modeling, and instead to show that the same data sets can be approached from differ-ent angles, depending on the analyst’s task. Indeed, the developed e-learning tool, including the interactive self-assessment options, is designed in such a way that the same data set is consecutively step-by-step approached with dif-ferent modeling and prediction methods. For example, stu-dents find that the Holt-Winters smoothing is preferred for short-term forecasts of sales of Australian dessert wine but a seasonal ARIMA models performs better for medium- and long-term forecasting of the same product sales. All dis-cussed modeling procedures are complemented by a detailed description of their implementation in R. Each chapter is then concluded with a set of online questions in a multiple choice and multiple selection form, so students can self-evaluate their understanding of the exhibited data pat-terns, the relevant statistical tools, and their software imple-mentation. For instance, using exploratory analysis of various time series plots of data sets similar to those
discussed in the case studies, students identify the main fea-tures of the data (e.g., stock trend channels, seasonality, out-liers) and get interactive feedback. This part is especially important because various exploratory analysis techniques play a key role in quantitative finance and econometrics. Some questions require students to replicate the presented analysis on their own and carry out an extension of the pre-sented study, for example, to assess prediction performance of the same model with and without outliers or using vari-ous variance-stabilizing transformations.
It is important to emphasize that some parameter-based questions with a more theoretical focus are designed in such a way that the parameters are able to take on random values within a predefined range. For instance, we can con-sider identification of a linear model order and parameters by its theoretical autocorrelation and partial autocorrelation functions (i.e., acf and pacf, respectively). While the true underlying structure is a moving average model of order 1, such as MA(1), the parameter of MA(1) is allowed to take random values within the interval of identifiability (–1,1), hence, producing myriads of MA(1) models with the respective acf and pacf plots. The effect is that any such question can generate a different scenario for each student, and the probability that a student would have the same question twice while practicing with the tool is relatively low. The same parameter randomization approach is under-taken for other linear and nonlinear models that are dis-cussed in the course. After completing the online tests, students receive a grade and can review their tests along with the correct answers.
Note that the key difference between our approach and the old-fashioned approach of end-of-chapter homework problems is that in our approach problem parameters are randomized, allowing simulations of an unbounded number of similar questions. Hence, in contrast to the old-fashioned end-of-chapter approach, students can see the same type of question not once but many times allowing repeated answering until he/she is fully satisfied with the interactive grade and the related understanding of the theory or meth-odology behind the posed question. Hence, our approach gives a much richer variety of questions.
The bank of questions is implemented using an LMS called ANGEL, while all the plots are prepared in the statis-tical programming language R. All case studies along with the corresponding online self-evaluation tests are available to the enrolled students via the LMS course website. The chapters of the case studies appear online after the corre-sponding content is discussed in class, and students can then work with the case studies an indefinite number of times, accessing them from anywhere. Using the LMS, we also keep track of who uses the tool, how many times a stu-dent accesses certain case studies, what online tests are per-formed, what grades are received, and the detailed statistics on each question. Students were also encouraged to keep track of their experience in informal logbooks that may be
employed to improve usability of a future version of the e-learning tool.
It is important to emphasize that the developed interac-tive e-learning tool1is not limited to any particular statisti-cal software (e.g., R in our case) but rather should viewed as a new e-learning methodological approach that can be relatively easily adapted to other software packages and LMS, as long as such LMS allow randomization of ques-tions and answers. To our knowledge, most of modern LMS (e.g., Blackboard, Desire2Learn) possess these technical capabilities.
Data Collection and Design
Our goal is to investigate if adding work on case studies to the curriculum of the Forecasting course improves the students’ level of understanding of a variety of concepts, with the level of understanding being measured by the final exam grade. Our study is an observational one in which we use the students in the one available class. The complete case studies grade is based on answers to the online questions.
Clearly, using a randomized design (i.e., randomly assigning no case studies to half of the students, with the other half having case studies) may appear as a bet-ter albet-ternative to an observational approach. However, such a randomization approach was viewed as unethical and not allowed by the Office of Research Ethics. So randomization is not feasible in our situation. In turn, assigning case studies only to volunteers/interest groups is also not applicable due to self-selection bias. Finally, the limitations in funding duration and scheduling issues, as well as the technical challenges due to the change of learning management platforms in the Univer-sity of Waterloo did not allow us to perform a sequen-tial study when all enrolled students in one given year were assigned case studies and students from the next year were not. Hence, we proceed with an observational design in the one available forecasting class.
In particular, in order to see if the inclusion of case stud-ies benefited the students, we measure the impact of the student’s (average) case studies grade2on his or her perfor-mance in a final exam, given information on the overall grade point average (GPA) over all previous terms, a major, term of study, and gender. That is, we regress the students’ final exam grade on their case studies grade, including the average GPA from previous terms major, term of study, and gender as covariates in an attempt to control for the incoming intelligence of the student.3
We found that only the overall GPA and case studies grade are significant predictors, and hence all other factors (i.e., major, term of study, and gender) are discarded from the further study.
Note that while final examination grades are admittedly imperfect, they are useful as measures for evaluation of the
effectiveness of a learning tool. In contrast to standardized tests, they are not universally comparable among students from different universities and colleges. However, they remain a conventional quantitative measure of learning out-come assessment adopted internally for various disciplines by numerous educational institutions worldwide (see dis-cussion by Ewell, 2005; Johnson, Berg, & Heddens, 2005; Ming, 2012; Sebastianelli & Tamimi, 2011, and references therein) and they have been validated externally by the Mathematical Association of America (see the guidelines of the Subcommittee on Assessment of the Committee on the Undergraduate Program in Mathematics of the Mathe-matical Association of America, 2005). Moreover, while in our case we assess the overall student knowledge in the course, reflected by the final course grade, as a weighted combination of four take-home assignments involving data analysis (15%), a take-home midterm (15%), group projects (15%), and the in-class final exam (55%), the in-class final examination grade represents the only available measure of student individual work because the other three assessment categories (i.e., take-home assignments, a take-home mid-term, and group projects) may explicitly or implicitly involve teamwork rather than individual activity. Finally, the final examination represents a collection of randomized computer-based multiple-choice and multiple-select ques-tions covering the whole course curriculum and can be viewed as a substantially extended version of the online case study questions. However, in contrast to the interactive online case studies, students are allowed to answer each question just once. Hence, the employed final examination can be considered to be a version of a test-retest assessment (see Stayhorn, 2006, and references therein).
RESULTS
Table 1 presents the estimated coefficients along with the respective standard errors,t statistics andp values from a multiple regression of final exam grade on the case studies grade and the GPA, while Figure 1 displays the scatter plot of the final exam grade versus the case studies grade. There were 155 students enrolled into the forecasting course of which 128 attempted all three of the available case studies. In addition, one student attempted only the first case study, three did only the first two, and 23 students did not do any of case studies.) Further examination of the case studies
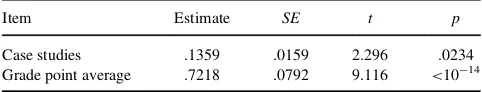
TABLE 1
The Results From the Multiple Regression of a Final Exam Grade on Case Studies Grade and Grade Point Average
Item Estimate SE t p
Case studies .1359 .0159 2.296 .0234 Grade point average .7218 .0792 9.116 <10¡14 218 Y. R. GEL ET AL.
grades reveals that they are skewed to the left, with over 80% of the grades being above 70%.
We find that the adjustedR2for the fitted model is 52%. As expected, the GPA is a highly statistically significant positive regressor, with a p value of less than 10¡14 (see
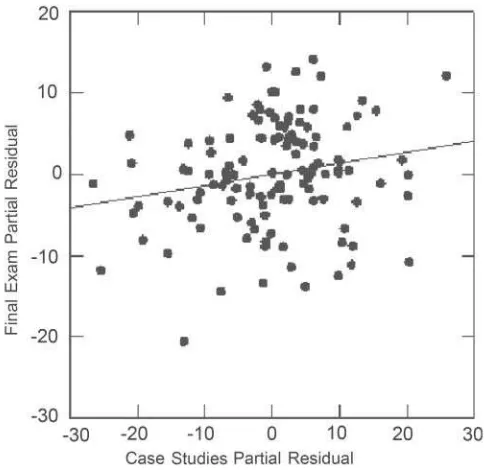
Table 1). Remarkably, as Table 1 shows, the case studies grade is found to be statistically significantly associated with the final exam grade, with ap value of .0234. More-over, Figure 2 also indicates a noticeable positive trend for the case studies grades in the partial regression, or added
variable plot (for more details see section 2.3.2 of Cook and Weisberg [1982]). The significant result which we obtain implies that there is a relation between the case stud-ies grade and the final exam grade, after adjusting for GPA, without establishing causation. The relation is substantial enough to warrant further study. Hence, we can conclude that the e-learning tool is beneficial for student perfor-mance, even after allowing for GPA differences, in the higher level forecasting course, and the interactive e-learn-ing methodology can be recommended for enhancement of educational outcomes.
As noted, the previous regression was carried out using only those students who did all three case studies. Similar results were found when the three students who did only two case studies were added to the analysis. However, when the one student who did only one case study was also included, the impact of the case studies grade regressor proved to be much stronger, having a highly statistically significant p value of .005. Further examination of that student’s case studies grade showed that it was an influen-tial point because its value of 36.4 was quite low compared to the other grades.
DISCUSSION
Today most business decision making is driven by data, and business managers and professionals are increasingly required not only to draw reliable decisions in the face of uncertainty but also to justify their decision on the basis of data analysis. Hence, a good business data or financial ana-lyst must be able to identify the most relevant available data modeling techniques in order to provide reliable infer-ences and to adapt the selected statistical model to novel features of the data and market dynamics. With the increas-ing challenges of combincreas-ing existincreas-ing statistical techniques with emerging modeling approaches, instructors need to connect the lectures with real-life business situations. Hence, it is important to provide students with plenty of opportunities to analyze real data as they learn more about statistical methods.
In this article, we discuss our experiences in developing an e-learning tool that aims to illustrate key methodological forecasting concepts by applying them to real-life business and finance problems using self-learning and self-assessing modules of case studies. The effectiveness of these e-learn-ing techniques is evaluated on the students in an advanced Forecasting course. We found that the proposed interactive e-learning tool provides a noticeable positive impact on educational outcomes in the higher level forecasting course, even after accounting for the students’ GPA. These latter results indicate that the proposed e-learning techniques are a promising educational approach for teaching time series and forecasting at a higher level. This approach has the potential to create in-depth real-world experience, isolate
100
90
80
70
50
60
Final Examination Grade
50 60 70 80 90 100 An Average Grade for the Case Studies
FIGURE 1 The scatter plot of the final exam grades and case studies
grades for the forecasting course.
FIGURE 2 The partial regression plots of the final exam grades and case
studies grades for the forecasting course. The partial correlation coefficient between the final exam and case studies score, after adjusting for grade point average, is .2027, with apvalue of .0234, which corresponds to the samepvalue for case studies score in Table 1.
the part of the critical analysis that gives students the great-est difficulty, and allow instructors to determine which por-tion of the skill acquisipor-tion is problematic and have the opportunity to address them in real time.
In the long run, the proposed e-learning tool can potentially become an independent module for distance education, professional development and credit certifica-tion in forecasting. It can also be incorporated as a key self-learning and self-assessment element for graduate programs (e.g., master of business administration or master in computational finance) as well as numerous other educational programs. In the future, we plan to further investigate applicability and effectiveness of the interactive case studies tool to other course sequences in computational disciplines, from the introductory to the graduate level.
ACKNOWLEDGMENTS
We would like to thank Paul Kates from the Centre for Teaching Excellence (CTE) and Nancy Orvis-Korn from the Math Undergraduate Office (MUO) of the University of Waterloo for technical assistance with the learning manage-ment systems and student databases.
FUNDING
The research of Gel was supported in part by grants from the Social Sciences and Humanities Research Council of Canada (SSHRC) and the Learning Initiatives Fund (LIF) of the University of Waterloo, and O’Hara Hines was sup-ported in part by a grant from the National Science and Engineering Research Council of Canada.
NOTES
1. While the developed e-learning tool, including the case studies and interactive self-assessment options, is a property of the University of Waterloo, and, hence, is not publicly available, we are happy to dis-cuss implementation of the proposed e-learning activities upon request.
2. The complete case studies grade is based on answers to the online questions.
3. We also have information on the grade point average over the single previous term (TGPA). However, the overall GPA and TGPA are highly correlated, and so we omit TGPA from further analysis. Defaced data with all available independent and dependent varia-bles (i.e., the final exam performance, case study grades, GPA, TGPA, major, year of study, and gen-der, are available from authors upon request.
REFERENCES
Albeanu, G., Madsen, H., Popentiu-Vladicescu, F., & Dumitru, M. (2010).
On designing extenable Java-based software for time series analysis
[CD-ROM]. ENBIS2010, Antwerp, Belgium.
Alldredge, J. R., & Som, N. A. (2002). Comparison of multimedia educa-tional materials used in an introductory statistical methods course. In B. Phillips (Ed.), Proceedings of the Sixth International Conference on Teaching Statistics(pp. 1–5). Voorburg, the Netherlands: International Statistical Institute.
Arsham, S. (2013). Time-critical decision making for business administra-tion. Web-Enhanced Textbook (9th version). Retrieved from http:// home.ubalt.edu/ntsbarsh/Business-stat/stat-data/Forecast.htm
Aydinli, G., H€ardle, W., & R€onz, B. (2003, August).E-learning/e-teaching of statistics: A new challenge. Paper presented at the International Asso-ciation for Statistical Education (IASE) satellite conference on Statistics Education, Berlin, Germany.
Bowerman, B. L., O’Connell, R., & Koehler, A. (2004).Forecasting, time series, and regression(4th ed.). Stamford, CT: Cengage Learning. Brockwell, P. J., & Davis, R. A. (2002).Introduction to time series and
forecasting. New York, NY: Springer.
Burrill, G. (2009).The role of dynamic interactive technology in teaching and learning statistics. East Lansing, MI: Michigan State University. Retrieved from http://math.unipa.it/\sim grim/21\_project/Burril95-99.pdf Committee on the Undergraduate Program in Mathematics of the Mathe-matical Association of America. (2005).CUPM guidelines for assess-ment of student learning. Washington, DC: Mathematical Association of America.
Cook, R. D., & Weisberg, S. (1982).Residuals and influence in regression. New York, NY: Chapman and Hall.
Cowpertwait, P. S. P. (2009).Introductory time series with R (use R!). New York, NY: Springer.
Cryer, J. D. (2008).Time series analysis: With applications in R. New York, NY: Springer.
Davies, N., & Barnett, V. (2005).Learning statistics teaching in higher education using online and distance methods. Paper presented at the International Association for Statistical Education (IASE) session at the 55th session of the International Statistical Institute (ISI), Sydney, Australia.
Ewell, P. (2005). Assessing assessment: The SAUM evaluator’s perspec-tive. In L. A. Steen (Ed.),Supporting assessment in undergraduate mathematics(pp. 19–26). Washington, DC: Mathematical Association of America.
Fields, P., & Collins, P. (2005).An assessment of computer-based learning methodology in teaching in an introductory statistics hybrid course. Paper presented at the International Association for Statistical Education (IASE) session at the 55th session of the International Statistical Insti-tute (ISI), Sydney, Australia.
Georgios, K. T., Stoyanova, D. V., & Onkov, K. Z. (2005). E-learning of trend modeling in a web-environment. SIGCSE Bulletin, 37(2), 70–74.
Ghaoui, C., & Janvier, W. A. (2004). Interactive e-learning.International Journal of Distance Education Technologies,2(3), 23–35.
Gonzalez, J. A., & Munoz, M. P. (2006). E-status, an automatic web-based problem generator: Applications to statistics.Computer Applications in Engineering Education,14(2), 151–159.
H€ardle, W., Klinke, S., & Ziegenhagen, U. (2006). E-learning statistics: A selective review. In A. Rizzi & M. Vichi (Eds.),Proceedings in compu-tational statistics (COMPSTAT2006)(Part V, pp. 417–428). New York, NY: Springer.
H€ardle, W., Klinke, S., & Ziegenhagen, U. (2007). On the utility of e-learn-ing in statistics.International Statistical Review,75(3), 355–364. Hilton, S. C., & Christensen, H. B. (2002). Evaluating the impact
of multimedia lectures on student learning and attitudes. In B. Phillips (Ed.),Proceedings of the Sixth International Conference on 220 Y. R. GEL ET AL.
Teaching Statistics(pp. 1–6). Voorburg, the Netherlands: Interna-tional Statistical Institute.
Hyndman, R. J. (n.d.).Time series data library. Retrieved from http://data. is/TSDLdemo
Johnson, E., Berg, J., & Heddens, D. (2005). Mathematics assessment in the first two years. In L. A. Steen (Ed.),Supporting assessment in under-graduate mathematics (pp. 41–46). Washington, DC: Mathematical Association of America.
Madsen, H., Albeanu, G., Burtschy, B., & Popentiu-Vladicescu, F. (2006).
Addressing time series modelling: Analysis and forecasting in e-learning environments. Paper presented at the 1st International Conference on Virtual Learning, Bucharest, Romania.
Ming, L. S. (2012).Alignment of learning outcomes and assessment. Paper presented at the 2012 IEEE International Conference on Information Technology Based Higher Education and Training (ITHET), Istanbul, Turkey.
Newton, H. J. (1988). TIMESLAB: A time series analysis laboratory. Pacific Grove, CA: Wadsworth & Brooks/Cole.
Nolan, D., & Temple Lang, D. (2007). Dynamic, interactive documents for teaching statistical practice. International Statistical Review, 75(3), 295–321.
Nolan, D., & Temple Lang, D. (2010).Integrating computing and data technologies into the statistics curricula. Paper presented at the 8th Con-ference on Teaching Statistics, Ljubljana, Slovenia.
Pfeil, W. A. (2006).Statistical teaching aids. Worcester, MA: Worcester Polytechnic Institute.
Pratt, D., Davies, N., & Connor, D. (2011). The role of technology in teaching and learning statistics. In C. Butanero, G. Burril, & C. Reading (Eds.), Teaching statistics in school mathematics: Chal-lenges for teaching and teacher education (New ICMI Study Series, Vol. 14, Part 2, pp. 97–107). Dortrecht, the Netherlands: Springer.
Sebastianelli, R., & Tamimi, N. (2011). Business statistics and man-agement science online: Teaching strategies and assessment of stu-dent learning.Journal of Education for Business,86, 317–325. Shmueli, G. (2012).Practical time series forecasting: A hands-on guide
(2nd ed.). CreateSpace Independent.
Shumway, R. H., & Stoffer, D. S. (2006).Time series analysis and its applications: With R examples. New York, NY: Springer.
Stayhorn, T. L. (2006).Frameworks for assessing learning and develop-ment outcomes. Washington, DC: Council for the Advancement of Standards in Higher Education.
Tavangarian, D., Leypold, M., N€olting, K., & R€oser, M. (2004). Is e-learning the solution for individual learning?Electronic Journal of e-Learning,2(2), 273–280.
Yaffe, R. A. (2000).An introduction to time series analysis and forecast-ing: With applications of SAS and SPSS. San Diego, CA: Academic Press.