Full Terms & Conditions of access and use can be found at
http://www.tandfonline.com/action/journalInformation?journalCode=cbie20
Download by: [Universitas Maritim Raja Ali Haji] Date: 17 January 2016, At: 23:44
Bulletin of Indonesian Economic Studies
ISSN: 0007-4918 (Print) 1472-7234 (Online) Journal homepage: http://www.tandfonline.com/loi/cbie20
Regional convergence and the role of the
neighbourhood effect in decentralised Indonesia
Yogi Vidyattama
To cite this article: Yogi Vidyattama (2013) Regional convergence and the role of the neighbourhood effect in decentralised Indonesia, Bulletin of Indonesian Economic Studies, 49:2, 193-211, DOI: 10.1080/00074918.2013.809841
To link to this article: http://dx.doi.org/10.1080/00074918.2013.809841
Published online: 26 Jul 2013.
Submit your article to this journal
Article views: 306
View related articles
ISSN 0007-4918 print/ISSN 1472-7234 online/13/020193-19 © 2013 Indonesia Project ANU http://dx.doi.org/10.1080/00074918.2013.809841
* The author would like to thank the University of Canberra, for funding this study
through its Vice-Chancellor’s Awards for Early Career Researchers, and NATSEM, for use of its staff development fund. The author would also like to thank Bana Bodri and Agus-man Simbolon, from the Badan Pusat Statistik (BPS), Indonesia’s Central Statistics Agency, for providing the data used in this study, as well as Riyana Miranti, Rebecca Cassells, Hal Hill and the two anonymous referees, for their valuable comments.
REGIONAL CONVERGENCE AND THE ROLE OF
THE NEIGHBOURHOOD EFFECT IN
DECENTRALISED INDONESIA
Yogi Vidyattama*
University of Canberra
More than a decade since Indonesia’s radical decentralisation process commenced, this article examines whether the economic performance of neighbouring regions – the neighbourhood effect – can determine the speed of regional convergence. The results suggest that the inequality of gross regional domestic product per capita, as indicated by the Williamson index of regional inequality, may increase slightly in
times of insigniicant estimated speeds of convergence – especially because of the
growth of Jakarta. In contrast, changes in the Human Development Index numbers for Indonesia indicate that regional convergence is taking place, although its speed
is decreasing. The neighbourhood effect could be signiicant in both cases, but it has
had little effect on the speed of convergence.
Keywords: regional convergence, regional inequality, Indonesia after decentralisation
INTRODUCTION
Regional inequality is a major issue in Indonesia, from the different levels of devel-opment and resource endowments among its regions to its population’s distribu-tion and ethnicity (Tadjoeddin, Suharyo and Mishra 2001; Aspinall and Berger 2001). In the past decade, regional convergence, or the decline in dispersion of a development indicator such as per-capita income across different regions, and its effect in reducing inequality, has been the subject of many studies in Indonesia. These studies have applied various techniques, such as statistical disparity meas-ures (see, for example, Akita and Lukman 1995; Tadjoeddin, Suharyo and Mishra 2001; Akita and Alisjahbana 2002; and Milanovic 2005) and regional growth con-vergence frameworks (see, for example, Garcia-Garcia and Soelistianingsih 1998; Resosudarmo and Vidyattama 2006; and Hill, Resosudarmo and Vidyattama 2008). Yet few have focused on disparity at the district level, and fewer again have looked at the process since 1999, when the Indonesian government announced its decentralisation reforms.
This article contributes to the existing body of knowledge of regional income inequality in Indonesia, by looking at the pattern of regional convergence at the provincial and district levels after decentralisation was formalised, by Indonesian Law 22/1999 and Law 25/1999, and then implemented, in 2001. Since decentrali-sation commenced, the central government has delegated much greater respon-sibility for education, agriculture, industry, trade, investment and infrastructure to district authorities, with the aim of delivering better public services – particu-larly in less developed regions (Alm, Aten and Bahl 2001; World Bank 2003). The examination of regional convergence has since become increasingly important,
especially at the district level. This article, however, does not speciically assess
the impact of decentralisation itself on convergence, despite the growing litera-ture on how decentralisation may increase or decrease the speed of convergence (Rodriguez-Pose and Ezcurra 2010). Instead, this article examines the impact of the neighbourhood effect at the district level on regional convergence, to ascer-tain whether the neighbourhood effect shapes Indonesia’s regional growth. As acknowledged by McCulloch and Sjahrir (2008) and Akita, Kurniawan and Miyata (2011), one of the main challenges of conducting an analysis at a sub-national level, especially in a lower level such as the district, is how to account for the possible spatial, or neighbourhood, effect: the economic performance of
neighbouring regions often has a signiicant impact (Anselin 1988; LeSage 1999;
Rey 2001), affecting convergence (Egger and Pfaffermayr 2006) by reducing ine-quality in only certain locations. This is particularly relevant in Indonesia, given the allegation that most of its development has occurred in only a few provinces (Suryadarma et al. 2006; Hill, Resosudarmo and Vidyattama 2008).
This article also uses patterns of change in the Human Development Index (HDI) as an alternative indicator of regional development to gross regional domestic product (GRDP) per capita. There are advantages and disadvantages in using GRDP per capita as a measure of economic performance. One disadvan-tage is the inclusion of the mining sector, which, in Indonesia, operates in several areas (that is, districts or provinces) with limited backward and forward linkages, which implies that GRDP does not necessarily reveal a shared level of economic development throughout a region (Tadjoeddin, Suharyo and Mishra 2001; Brodjo-negoro and Martinez-Vazquez 2002; Milanovic 2005; Hill, Resosudarmo and Vid-yattama 2008; Akita and Lukman 1995). Another problem is that GRDP data do not take account of regional cross-border transactions. For the purpose of approx-imating the regional standard of living, this article therefore uses the HDI, which is widely regarded as a comprehensive index and combines measures of health, education, and income or expenditure. HDI has been widely used, especially in studies of developing nations (Anand and Sen 2000). Other common measures of regional inequality may include the distribution of disadvantage, such as poverty, unemployment or homelessness, but these are not the focus of this article.
CONVERGENCE STUDIES IN INDONESIA
As there is a large body of literature on regional inequality and convergence which follows the seminal work of Williamson (1965), Barro and Sala-I-Martin (1991), and
Sala-I-Martin (1996), this article refers only to those studies that look speciically
at Indonesia or examine the neighbourhood effect’s impact on convergence. These
studies form a comparative base for examining convergence in Indonesia after decentralisation; comparisons between Indonesia and other countries have been discussed in Shankar and Shah (2003), Milanovic (2005), and Hill, Resosudarmo and Vidyattama (2008).
In Akita and Lukman’s (1995) study of regional convergence in Indonesia, they
use the Williamson index, a coeficient of variation measure, to look at changes
in regional inequality at the provincial level during 1975–92, which shows a large decrease in inequality of GRDP per capita among regions. Their decomposition of the inequality index shows the increasing importance of the manufacturing and construction sectors in examining inequality in Indonesia. Despite this, inequal-ity of non-mining GRDP per capita remained relatively stagnant during 1975–92, except for a discontinued trend of increased inequality during the export-oriented reforms of the mid-1980s.
Garcia-Garcia and Soelistianingsih (1998) produced the irst estimate of the
speed of convergence (β-convergence) of Indonesian provincial incomes of 1975–
83, which conirmed statistically signiicant convergence of GRDP per capita and
estimated its speed to be around 2%. This speed implied that the convergence process would be at its halfway point after 35 years, or, in other words, that the observed regional inequality (that is, the average deviation from the mean) would roughly be halved in that period. This was similar to the results from several OECD countries (Sala-I-Martin 1996). Hill, Resosudarmo and Vidyattama (2008)
show that the indings of Garcia-Garcia and Soelistianingsih (1998) are sensitive to the choice of time period analysed and are also heavily inluenced by the decline
in the contribution since 1975 of Indonesia’s resource-rich provinces to Indone-sia’s GDP, as the oil and gas sector has become less important. This later study also shows that the speed of β-convergence varies signiicantly across Indonesia’s development periods. It was quite rapid (2%) during the oil boom of 1975–81; and it accelerated after oil prices stabilised during 1981–86, with the speed of conver-gence estimated to be 2.8%. The speed of β-convergence then collapsed, however, from 1.7%, in 1986–92, to just 1%, in the 1990s, as the government’s
export-ori-ented reforms took hold. During the inancial crisis and its aftermath, from 1997 to 2002, there was no signiicant convergence. Hill, Resosudarmo and Vidyattama (2008) also conirm Akita and Lukman’s inding that convergence is fairly stable
after the output of the mining sector has been removed from GRDP per capita.
Tadjoeddin, Suharyo and Mishra (2001) conirm that regional inequality is sta -ble at the district level, having examined the Williamson index and the Theil and
Gini coeficients of GRDP per capita from 1993, when the data was irst released,
to 1998. Although their estimations, similarly to those of Hill, Resosudarmo and Vidyattama (2008), show that regional inequality remained relatively unchanged
during this period, they ind that the inequality of GRDP per capita, without oil
and gas, increased slightly at the district level until 1998. Akita and Alisjahbana
(2002) draw similar conclusions at the district level, inding that regional income
inequality increased during 1993–97. This does not contradict the relatively stable levels of regional inequality estimated by other studies at the provincial level; rather, it shows that inequality increased among certain districts within some
provinces. Akita, Kurniawan and Miyata (2011) show that the Asian inancial cri -sis reduced inequality in Indonesia, especially as the cri-sis hit Jakarta harder than it did less developed areas. This trend did not last – regional inequality increased
again until 2004, in the wake of Jakarta’s recovery – but it remains uncertain what
the trend has been since decentralisation intensiied. Moreover, Tadjoeddin (2013)
argues the inequality among districts could follow a Kuznets curve, where ine-quality increases when high levels of growth bring an economy to a certain level of income and then decreases with further increases in income. However, he notes that this relationship is observed only when cities are integrated within their sur-rounding regencies.
Studies using a regional growth framework at the district level – such as those noted above – have prompted examinations of whether including spatial factors would change the result. This is related to the argument of Sala-I-Martin (1996) that convergence is more achievable in a sub-national setting, owing to greater interaction among smaller regions as economic entities. It also means that the neighbourhood effect is more likely to exist among smaller regions. Another com-mon reason that emerges in regional studies for the existence of the neighbour-hood effect is that the administrative boundaries used to identify regions do not
necessarily relect the boundaries of economic activities (LeSage 1999; Rey 2001).
As a result, some economic activities within borders or across borders, such as trade and commuting, relate the economic performances of the regions involved, so that a change of conditions in one region’s economy could well affect that of another.
Egger and Pfaffermayr (2006) point out that the neighbourhood effect can also produce biased analyses of convergence. They argue that the speed of conver-gence can vary across regions, and that converconver-gence in major growth centres can prevent remote regions from catching up. Indonesia’s remote east, for example, which comprises most of the country’s least developed districts, could be left behind as inequality levels in the rest of the country converge. Akita, Kurniawan and Miyata (2011), however, show that the differences in inequality among Indo-nesia’s largest regions (Java–Bali, Sumatra–Kalimantan–Papua, and other regions in the country’s east) are small compared with the levels of inequality within those regions, and that the levels of cross-regional inequality have been relatively con-stant throughout the years. Instead, Akita, Kurniawan and Miyata (2011) detect increasing levels of inequality not only within regions but also among districts within provinces in those regions.
Applying the neighbourhood effect to convergence has brought mixed results in other countries’ regional growth analyses. Rey and Montouri (1999), pioneers
in this ield, ind that the neighbourhood effect among US states is not only sta
-tistically signiicant; it also signiicantly alters convergence. Niebuhr (2001) inds
that although the neighbourhood effect in West Germany affected growth
sig-niicantly, it slowed convergence only slightly. His indings differ from those of Kosfeld, Eckey and Dreger (2002), who, concentrating on a uniied Germany, note that the inclusion of the neighbourhood effect slowed convergence signiicantly.
Magalhães, Hewings and Azzoni (2005), in an example of the neighbourhood
effect’s impact in a developing country, ind that it did little to alter the speed of
regional convergence in Brazil.
METHODOLOGY AND DATA Empirical method
The concept of convergence refers to the decline in dispersion of a development indicator, such as per-capita income distribution, across regions as economic enti-ties. In growth analyses, convergence has a slightly different meaning: it refers to relatively lower growth of an economy, with relatively higher income. Sala-I-Martin (1996) argues that the concept of convergence in growth analyses is a
nec-essary but not suficient condition in reducing income inequality, or the inequality
of any other development indicator.
A measure of regional inequality popularised by Williamson (1965) – the Wil-liamson index – is often used to examine regional inequality at one point in time and, hence, to measure changes in inequality over time. This article uses the population-weighted version of the index:
• CVw= population-weighted Williamson index;
• n = number of regions;
Although the Williamson index has been used widely to analyse the changes in regional inequality and, hence, regional convergence, it cannot indicate the
sig-niicance of convergence itself.
The speed of convergence is introduced in growth analyses. Known as as
β-convergence, it can be used to examine whether the economies of relatively
poorer regions grow signiicantly faster than richer regions, as an indication of
decreasing levels of regional inequality. Barro and Sala-I-Martin (1991) made the concept famous, using the following regression assessment:
gy=α+
(
e−β−1)
ln( )
y0 +u (2)tive correlation between growth and the initial condition of the economy. Conse-quently, β should be positive in times of regional convergence. The absolute value of β represents the speed of the catch-up process, or the speed of convergence.
This article considers two well-known spatial models, as popularised by Anselin (1988) – the spatial autoregressive lag model (SAR) and the spatial autoregressive
error model (SEM) – to see whether the neighbourhood effect is signiicant and/ or if it signiicantly alters the speed of convergence.
The SAR assesses the direct connection between the development of one region and that of its neighbours. If the growth of one region can directly affect that of its neighbours, then neighbouring regions are more likely to grow at similar rates. As Fingleton and Lopez-Bazo (2006) demonstrated, the spatial autoregressive lag can be introduced to the growth regression in equation (2) as:
gy=α+
(
e−β−1)
ln y0
( )
+ρWgy+u (3)
where ρWgy is the spatial lag of the dependent variable and W is the spatial weight matrix.
The SEM examines the indirect existence of the neighbourhood effect. The development of one region may not be affected directly by that of its neighbours, but it can still be affected by the undisclosed determinants in the equation. For example, it is possible that although the growth of one region may have an
insig-niicant effect on that of its neighbours, the increasing human capital in that region would affect its neighbours signiicantly. Anselin (1988) formalises the structure
of the error term affected by the neighbourhood effect:
u=λ u+ε (4)
or, considering the spatial multiplier effect and combined with equation (2), the SEM can be written as:
where u is the error term in the panel estimation and ε is the real random factor.
Growth and development indicators
Most growth analyses focus on GDP or GRDP per capita as a proxy for per-capita income and as an indicator of development. The data for provincial-level GRDP are available from the regional accounts of BPS from 1975 onwards, whereas the district-level data are available only from 1993 onwards.
Various proxy measures for different industrial sectors are used to calculate GRDP in Indonesia. BPS coordinated and conducted GRDP calculations since 1975, and formalised a process that had previously relied on universities produc-ing GRDP data for their area (Arndt 1973). Output statistics reported by various
regional BPS ofices are used as proxy measures for the output of the agricul -tural sector, and the output of the industrial sector has been calculated based on data from industrial censuses and sample surveys. While a proxy measure for the construction sector can be based on the consumption of building material and surveys of local contractors, measuring the output of the services sector has been more challenging: market surpluses, public-sector wages and sales statis-tics all need to be estimated. In 1983, 1993 and 2000, BPS revised the baskets of
goods and services used as proxies for the estimation of regional GDP, to relect
the changes in the compositions of output and consumption in different sectors. It also changed the base year for the estimation of constant price series. Besides releasing a new series of GRDP data based on the new proxies, BPS also released the data based on the previous procedure for particular years, as a concordance tool. The GRDP used in this article is based on the 1993 constant price series and all other data are converted to that time series, using the concordance tool.
Calculating GRDP using proxy measures of output often fails to show the real level of development, especially when the wealth created from the output of a region is not necessarily distributed within the same region. In Indonesia, GRDP may overstate true wealth, because many regions have high levels of GRDP per capita but relatively low levels of individual income (Tadjoeddin, Suharyo and Mishra 2001; Brodjonegoro and Martinez-Vazquez 2002). In Papua’s Mimika regency, for example, which, in 1999, was part of the Fakfak district, the high out-put from PT Freeport Indonesia’s Grasberg mine has not translated to the people of the region, where the poverty rate exceeds 40%. Lhokseumawe, in North Aceh,
the location of the Arun liqueied-natural-gas plant, and Sumbawa, the location
of Newmont’s Batu Hijau mine, are other examples of regions with high levels of GRDP and relatively high poverty rates. This issue centres largely on the output of the mining industry, which, while allocated to the incomes of central govern-ment and mining companies, is accrued in regional GDP statistics (Akita and Luk-man 1995; Milanovic 2005; Hill, Resosudarmo and Vidyattama 2008).
The HDI, another indicator of development, has been used since 1990 to com-pare worldwide development levels. Based on three equally weighted dimen-sions – life expectancy; education or literacy; and standard of living, or per-capita income – it is still the most widely used index of development (Anand and Sen 2000). There are advantages and disadvantages in using a composite index such as the HDI in convergence analyses: it has the advantage of representing the total package of living standards in the economy, but it can also hide the importance of certain variables or be less effective if all variables have a very similar regional distribution (McGillivray 1991).
There are also advantages and disadvantages in interpreting convergence val-ues based on the HDI. The advantage comes from the assumption, or the hope, that the index will move, or converge, to the expected (maximum) value, but this means that the traditional thinking behind the catch-up process is not really rel-evant. There is a maximum value of convergence that the most developed region will be able to achieve, so the speed of convergence would be expected to be higher in HDI than in GRDP per capita. This article therefore looks at HDI con-vergence simply from the point of whether, on average, regions with low levels of HDI have a higher mobility towards the maximum compared with those with
high levels of HDI, as well as the signiicant level of this mobility and its changes
over time.
The data for HDI are available for Indonesia at both a provincial and a dis-trict level.1 The calculation of HDI data at the district level relies on Indonesia’s
National Socio-Economic Survey (Susenas). The income proxy in Indonesia’s HDI
1 BPS has published HDI data regularly since 2002, with the index appearing irst in the
2001 Indonesia Human Development Report, by the United Nations Development Project’s UNSFIR (the United Nations Support Facility for Indonesian Recovery).
calculation is based on the average expenditure of the households in Susenas. While education variables such as the literacy rate and the mean number of years of schooling can also be estimated directly from Susenas, calculating life expec-tancy involves using data from the 2000 Population Census to continue the series from previous censuses, and the infant mortality variable from both the Popula-tion Census and Susenas. Given the high number of Susenas observaPopula-tions – at around 157,000 households in 1999 and 278,000 in 2005 – the district-level data can be considered reliable. However, Susenas enumerators often cannot capture data in very remote areas, which detracts from this reliability. In the 1999 and 2002
surveys, for example, BPS acknowledged the dificulty of reaching conlict areas in Aceh, Maluku and Papua. The dificulty of interviewing those in the highest
and lowest income brackets is another challenge recognised by the survey (Leigh and Van der Eng 2009).
The regions in an Indonesian context
Administrative divisions are the most common economic entities in a country’s
regional economy. In Indonesia, the irst, or highest, administrative division is the
province, followed by the district. The latter consists of regencies and cities, or
kabupaten and kota. The third administrative division comprises sub-districts, or
kecamatan, while the fourth, or lowest, division comprises urban and rural villages, or kelurahan and desa. According to the Indonesian Department of Internal Affairs, in 2005 Indonesia had 33 provinces, 349 regencies, 91 cities, 5,263 sub-districts, 7,123 urban villages and 62,806 rural villages.
As Indonesia has embraced decentralisation, the boundaries of its provinces and districts have changed rapidly. While the number of provinces increased from 26 (excluding East Timor) to 33 during 1999–2008, the number of districts increased from around 350 to more than 450. To obtain a consistent database, and to ensure that every region is represented throughout the period of decentralisa-tion, BPS has amalgamated the provinces into the 26 that existed prior to 1999 and the districts into the 294 that existed in the 1996 BPS database.
An essential component of including spatial autocorrelation in
acknowledg-ing the neighbourhood effect in growth analyses is the speciication of neighbour
as represented in a spatial weighting matrix. This article uses a distance-decay parameter, to recognise that the farther apart the regions the lower their levels of autocorrelation (Cliff and Ord 1973). The distance is measured based on the geo-graphical distance between the centroid of two regions.
RESULTS AND DISCUSSION
Convergence process after decentralisation
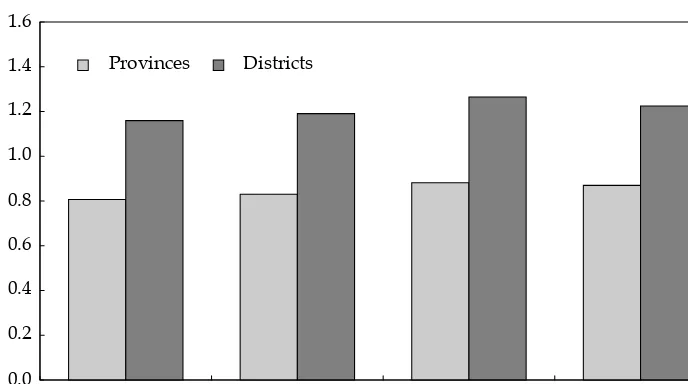
Figure 1 presents the Williamson index of GRDP per capita during and after decentralisation at both the provincial and district levels. It shows that inequality
at the district level is considerably higher than at the provincial level, conirming
the conclusion of Akita and Alisjahbana (2002) that the use of the provincial unit tends to underestimate regional inequality at the district level. The Williamson index numbers for both levels are estimated to have increased gradually during 1999–2005 and then decreased slightly during 2005–08, but regional inequality is still estimated to be have been higher in 2008 than in 2002.
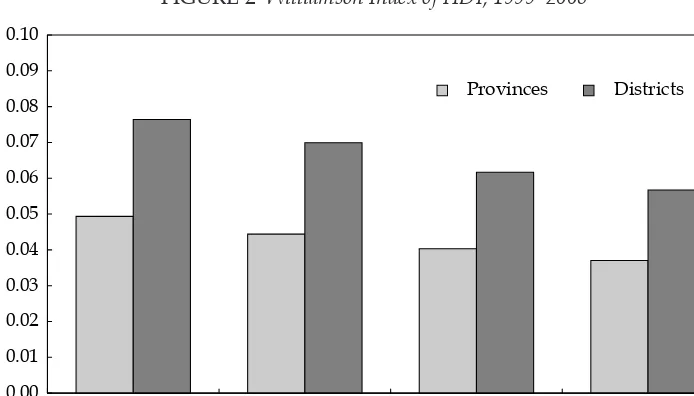
Figure 2 shows the Williamson index with HDI as an indicator. As in the case with GRDP per capita, inequality at the district level is considerably higher than it is at the provincial level. However, the regional inequalities of HDI declined at both levels – district and provincial – during 1999–2008. This not only shows that regional convergence may still have occurred in a decentralised Indonesia
but also conirms the absence of signiicant correlation between regional output
and the development index in Indonesia. Therefore, the increasing inequality of regional output does not necessarily translate to increasing inequality of other development indicators.
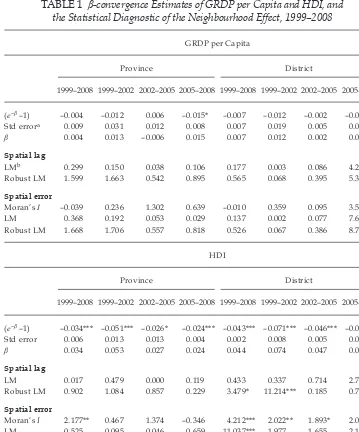
Table 1 presents the estimate of β-convergence, which reveals that there was no regional convergence of GRDP per capita during or after the implementation of decentralisation, especially in 1999–2002 and 2002–05. With the estimated speed
of convergence insigniicant at around 0.4%, the period of 1999–2008 had the low -est speed of convergence since observations began, in 1975. Yet this result still contradicts the observation from the Williamson index, which indicates a diverg-ing instead of a convergdiverg-ing pattern of GRDP per capita.
Both the β-convergence estimates and the Williamson index indicate that con-vergence occurred again in Indonesia in 2005–08. Akita, Kurniawan and Miyata
(2011) argue that the increase in inequality after the Asian inancial crisis hit
Indonesia, in 1997–98, is mainly due to the recovery of major cities, especially Jakarta. Therefore, it is possible that convergence reoccurred after 2005 because the major cities had by then recovered from the crisis, and their growth rates had fallen below those of districts with relatively lower levels of GRDP per capita. Nevertheless, this is certainly not the case for Jakarta, which continues to have relatively high (albeit more modest) growth. This will be discussed further below, in a comparison between convergence levels in Java, Sumatra and Indonesia as a
FIGURE 1 Williamson Index of GRDP per Capita, 1999–2008
Source: Author’s calculations based on provincial and district BPS data from various years, in 1993 constant prices.
Note: GRDP = gross regional domestic product.
whole. The other main driver of this convergence is the recovery in the GRDP of some districts in Aceh after the 2004 tsunami and the fall in the GRDP of Mimika.
The Williamson index and the estimate of β-convergence also indicate that HDI convergence is taking place in Indonesia. The β-convergence, however, shows the speed of convergence declining from 7.4% in 1999–2002 to 3.0% in 2005–08 at the district level, and from 5.3% to 2.4% in the same periods at the provincial level. This slowing in regional HDI convergence could be alarming, since HDI relates mostly to public services that have been delegated to the district level. Brodjon-egoro (2009) notes that although most districts are starting to cope to the decen-tralised system, local governments still tend to focus on their budgets rather than on the delivery of public services in their new authorities.
The impact of the neighbourhood effect
Table 1 also presents diagnostic statistics for the neighbourhood effect, using the inverted distance matrix in the β-convergence estimation. It shows that the
neigh-bourhood
effect is statistically signiicant in estimations at the district level but
insigniicant when based on distance at the provincial level. The neighbourhood effect is often detected as signiicant in conjunction with a signiicant level of con -vergence. This raises the questions of whether convergence occurs in only certain areas, and, as posed by Egger and Pfaffermayr (2006), whether districts farther from those areas are left behind in the process.
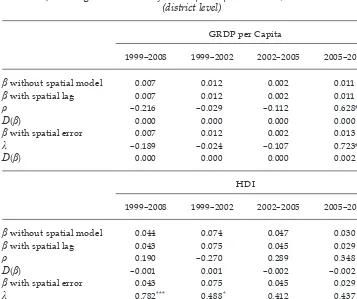
This article uses the spatial lag and spatial error models, as described in equa-tions (3) and (5), to analyse the impact of the distance-based neighbourhood
effect on convergence. The results show insigniicant changes in the speed of convergence, even when the spatial lag or the introduced errors are signiicant
FIGURE 2 Williamson Index of HDI, 1999–2008
Source: Author’s calculations based on provincial and district BPS data from various years, in 1993 constant prices.
Note: HDI = Human Development Index.
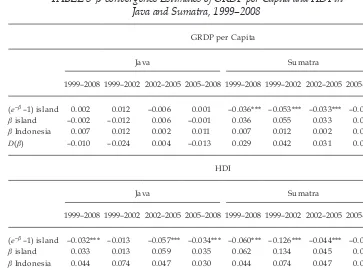
TABLE 1 β-convergence Estimates of GRDP per Capita and HDI, and the Statistical Diagnostic of the Neighbourhood Effect, 1999–2008
GRDP per Capita
Province District
1999–2008 1999–2002 2002–2005 2005–2008 1999–2008 1999–2002 2002–2005 2005–2008
(e–β –1) –0.004 –0.012 0.006 –0.015* –0.007 –0.012 –0.002 –0.011*** Std errora 0.009 0.031 0.012 0.008 0.007 0.019 0.005 0.003 β 0.004 0.013 –0.006 0.015 0.007 0.012 0.002 0.011 Spatial lag
LMb 0.299 0.150 0.038 0.106 0.177 0.003 0.086 4.277** Robust LM 1.599 1.663 0.542 0.895 0.565 0.068 0.395 5.362**
Spatial error
Moran’s I –0.039 0.236 1.302 0.639 –0.010 0.359 0.095 3.563*** LM 0.368 0.192 0.053 0.029 0.137 0.002 0.077 7.623*** Robust LM 1.668 1.706 0.557 0.818 0.526 0.067 0.386 8.708***
HDI
Province District
1999–2008 1999–2002 2002–2005 2005–2008 1999–2008 1999–2002 2002–2005 2005–2008
(e–β –1) –0.034*** –0.051*** –0.026* –0.024*** –0.043*** –0.071*** –0.046*** –0.030*** Std error 0.006 0.013 0.013 0.004 0.002 0.008 0.005 0.003 β 0.034 0.053 0.027 0.024 0.044 0.074 0.047 0.030 Spatial lag
LM 0.017 0.479 0.000 0.119 0.433 0.337 0.714 2.785* Robust LM 0.902 1.084 0.857 0.229 3.479* 11.214*** 0.185 0.716
Spatial error
Moran’s I 2.177** 0.467 1.374 –0.346 4.212*** 2.022** 1.893* 2.079** LM 0.525 0.095 0.046 0.659 11.037*** 1.977 1.655 2.104 Robust LM 1.409 0.699 0.903 0.770 14.082*** 12.855*** 1.126 0.035
Source: Author’s calculations based on provincial and district BPS data from various years, in 1993 constant prices.
Note: GRDP = gross regional domestic product. HDI = Human Development Index. N = 294.
a Standard error.
b LM = Lagrange multiplier.
* p < 0.1; ** p < 0.05; *** p < 0.01
(table 2). The signiicance of the changes in the speed of convergence is deter -mined by conducting the following t-test:
(e−β−1)non-sp
atia l=
(e−β−1)sp t
(6)
In estimations based on GDP per capita, a positively signiicant spatial error
and lag occurred in only the most recent period (2005–08). Introducing spatial
error increases the speed of convergence insigniicantly, by only 0.2 percentage
points, whereas introducing spatial lag does not change the speed. Any increase would mean that the positive neighbourhood effect had hindered convergence,
but the effect is insigniicant in this estimation. The only prominent example of
how the neighbourhood effect reduced the speed of convergence is the growth of the Jakarta district and the areas surrounding it, such as Tanggerang and Bekasi.
TABLE 2 Impact of Spatial Lag and Error Inclusion on
β-convergence Estimates of GRDP per Capita and HDI, 1999–2008 (district level)
GRDP per Capita
1999–2008 1999–2002 2002–2005 2005–2008
β without spatial model 0.007 0.012 0.002 0.011
β with spatial lag 0.007 0.012 0.002 0.011
ρ –0.216 –0.029 –0.112 0.628**
D(β) 0.000 0.000 0.000 0.000
β with spatial error 0.007 0.012 0.002 0.013
λ –0.189 –0.024 –0.107 0.723***
D(β) 0.000 0.000 0.000 0.002
HDI
1999–2008 1999–2002 2002–2005 2005–2008
β without spatial model 0.044 0.074 0.047 0.030
β with spatial lag 0.043 0.075 0.045 0.029
ρ 0.190 –0.270 0.289 0.348
D(β) –0.001 0.001 –0.002 –0.002
β with spatial error 0.043 0.075 0.045 0.029
λ 0.782*** 0.488* 0.412 0.437
D(β) –0.001 0.001 –0.002 –0.002
Source: Author’s calculations based on provincial and district BPS data from various years, in 1993 constant prices.
Note: GRDP = gross regional domestic product. HDI = Human Development Index. N = 294. ρ and λ are spatial lag and error based on equations (3) and (5), respectively. D(β) is the difference in the speed of convergence due to the introduction of the spatial model.
* p < 0.1; ** p < 0.05; *** p < 0.01
In
estimations based on HDI, the spatial lag is not signiicant in any period, whereas spatial error is positively signiicant in the whole period, 1999–2008, and the speciic period 1999–2002. As in estimations based on GDP per capita, how
-ever, there is no signiicant change (only that of 0.1 percentage point) in the speed of convergence. Although the distance-based neighbourhood effect is signiicant
on regional development, especially through the undisclosed variable (that is, the
error term), its impact on district-level convergence is insigniicant.
To further examine the neighbourhood effect’s impact on convergence, this article assesses the speeds of convergence in Indonesia’s two most populated islands – Java and Sumatra. Table 3 shows large differences in their speeds of
convergence, and, although it is not signiicant, there is an indication that GRDP
per capita diverges among districts in Java. Conversely, GRDP per capita
con-verges signiicantly among Sumatra’s districts, with a speed of around 3.6% dur -ing 1999–2008.
HDI, as an alternative indicator, shows signiicant convergence in both islands.
The speed of this convergence, after decentralisation, is estimated to be increasing in Java but decreasing in Sumatra. The increasing speed of convergence in Java is dominated not only by faster development in districts in East Java with low HDI numbers (such as Sampang, Bondowoso, Sumenep and Situbondo) but also by slower development in several parts of Jakarta and in some provincial big cities, such as Bandung, Yogyakarta, Surakarta and Semarang. The catch-up process of districts with the lowest HDI numbers in Sumatra, such as Nias and Musi Banyu-asin, has also been slowing down.
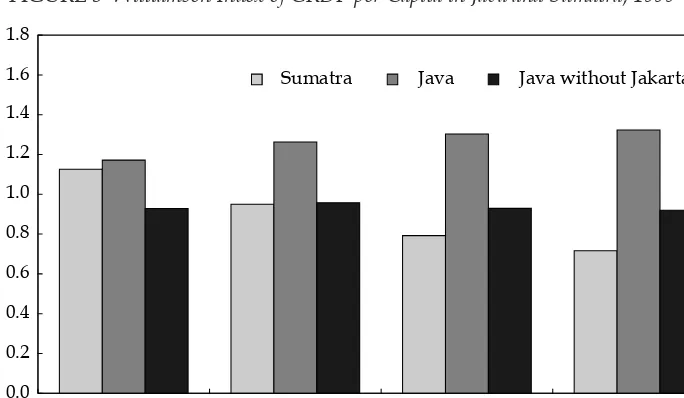
Figure 3 shows the Williamson indexes for the GRDP per capita of districts in Java and Sumatra. In 1999, the level of inequality in Sumatra was just below the national level, while the level in Java was just above the national level. The
FIGURE 3 Williamson Index of GRDP per Capita in Java and Sumatra, 1999–2008
Source: Author’s calculations based on provincial and district BPS data from various years, in 1993 constant prices.
Note: GRDP = gross regional domestic product.
increasing inequality of GRDP per capita among districts in Java at the same time as a decreasing trend in Sumatra has seen inequality increase and decrease in Java and Sumatra, respectively, compared with the national average. Akita, Kurniawan and Miyata (2011) have offered an explanation for this trend: the decreasing levels
of
inequality in Sumatra are likely to be inluenced by the continuing decline of
its mining sector and the increasing spread of its manufacturing industry. This can be illustrated by the relatively lower levels of growth in Dumai, an oil-mining district that was part of Bengkalis in 1999, and Batam, where Sumatra’s manu-facturing industry had previously been concentrated. The growth of Aceh has also clearly contributed to convergence in Sumatra. At the same time, Java is fac-ing increasfac-ing inequality of GRDP per capita, which is likely to be dominated by Jakarta’s continuous economic growth and leave less developed regions behind.
Given Jakarta’s potentially important role in inluencing inequality in Java, ig -ure 3 includes an inequality index for Java without Jakarta. Inequality in Java is much lower once Jakarta has been removed. Inequality in Java decreased during
the 1998 inancial crisis, owing to the fall in the output of the region’s inancial,
construction and manufacturing sectors, which are located mainly in its relatively TABLE 3 β-convergence Estimates of GRDP per Capita and HDI in
Java and Sumatra, 1999–2008
GRDP per Capita
Java Sumatra
1999–2008 1999–2002 2002–2005 2005–2008 1999–2008 1999–2002 2002–2005 2005–2008
(e–β –1) island 0.002 0.012 –0.006 0.001 –0.036*** –0.053*** –0.033*** –0.038*** β island –0.002 –0.012 0.006 –0.001 0.036 0.055 0.033 0.039 β Indonesia 0.007 0.012 0.002 0.011 0.007 0.012 0.002 0.011
D(β) –0.010 –0.024 0.004 –0.013 0.029 0.042 0.031 0.028 HDI
Java Sumatra
1999–2008 1999–2002 2002–2005 2005–2008 1999–2008 1999–2002 2002–2005 2005–2008
(e–β –1) island –0.032*** –0.013 –0.057*** –0.034*** –0.060*** –0.126*** –0.044*** –0.037*** β island 0.033 0.013 0.059 0.035 0.062 0.134 0.045 0.037 β Indonesia 0.044 0.074 0.047 0.030 0.044 0.074 0.047 0.030
D(β) –0.011 –0.061 0.012 0.005 0.018 0.060 –0.002 0.007 Source: Author’s calculations based on provincial and district BPS data from various years, in 1993 constant prices.
Note: GRDP = gross regional domestic product. HDI = Human Development Index. N (Java) = 108, N (Sumatra) = 73. D(β) is the difference between the speed of convergence in Java or Sumatra and the speed of convergence in Indonesia.
* p < 0.1; ** p < 0.05; *** p < 0.01
richer districts, especially in Jakarta (Hill, Resosudarmo and Vidyattama 2008; Akita, Kurniawan and Miyata 2011). By 2001–02, however, these sectors had started to return to their previous levels of growth (Hill 2011) – as had
inequal-ity
. The relative stability of Java’s inequality levels without Jakarta conirms the
observation of Akita, Kurniawan and Miyata (2011) that Jakarta is the main source of Java’s increasing inequality.
Jakarta’s inluence may also affect inequality in Indonesia as a whole. In fact,
it could partially explain why the Williamson index for Indonesia’s GRDP per capita has continued to increase while the β-convergence estimate has indicated
insigniicant speeds of convergence. The Williamson index used in this article applies a population-weighted coeficient of variation, so, given that Java’s popu -lation accounts for 60% of the total Indonesian popu-lation, the increasing levels of inequality in Java are dominating the index because of the statistical weight of Jakarta. This also means that inequality may not be increasing at all, if it is exam-ined with a measure less inclexam-ined to be affected by an extreme value – such as the Theil inequality index, which uses a logarithmic function for such a purpose.
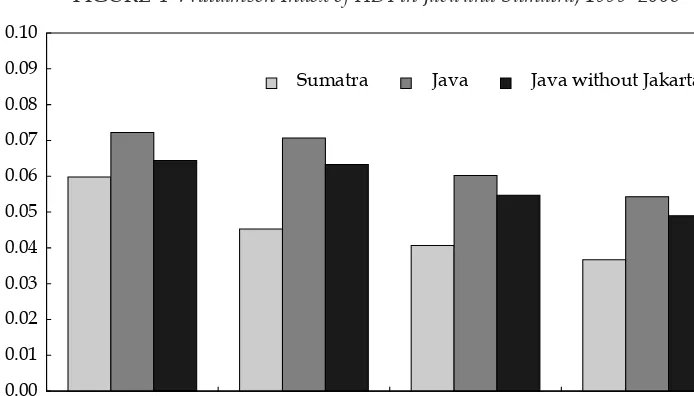
Figure 4 shows that the inequality of regional development, as measured by HDI at the district level, decreased in both Sumatra and Java. Although the Wil-liamson index indicates that these levels of inequality are higher when Jakarta is included, the inclusion does not reverse the decreasing trend. Figure 4 also shows that the HDI inequality among districts in Sumatra decreased more considerably than for those in Java, especially in 1999–2002. In this period, Sumatra has a much
faster speed of convergence than Java, as conirmed by the estimated speed of
convergence in table 3: Java at 3.3%, and Sumatra at 13.4%. Figure 4 indicates that inequality in both Java and Sumatra is still lower than inequality in Indonesia as a whole, which suggests higher levels of inequality of regional development
FIGURE 4 Williamson Index of HDI in Java and Sumatra, 1999–2008
Source: Author’s calculations based on provincial and district BPS data from various years, in 1993 constant prices.
Note: HDI = Human Development Index.
among districts outside the two islands (or considerable differences in the HDI number between districts in Java and Sumatra and those in other islands). More work needs to be done to look at the inequality among districts outside Java and Sumatra and those in Java and Sumatra.
CONCLUSION
More than a decade has passed since the Indonesian government implemented its decentralisation policy. This article has attempted to examine regional conver-gence following the central delegation of most authorities in the areas of educa-tion, agriculture, industry, trade, investment and infrastructure to an increasing number of local governments at a district level. It has also examined whether the neighbourhood effect played a role in the process, by introducing a spatial model into β-convergence estimates and by looking at whether there is a difference in regional convergence in the two most populous islands in Indonesia – Java and Sumatra.
The initial result of this assessment is rather inconclusive. The Williamson indexes for GRDP per capita, for example, show slight increases in regional
ine-quality
at both the district and the provincial levels, and, although insigniicant,
the β-convergence estimates suggest that convergence occurred at both
admin-istrative levels during 1999–2008. The speciic period 2005–08 saw signiicant
convergence occur at the district level, owing partly to the impact of the neigh-bourhood effect. Although this may seem to promise lower levels of inequality,
the rise of Aceh after the conlict at the end of the 1990s and the early 2000s, in
addition to the fall in the number of mining areas in Papua, has also contributed considerably to convergence. Moreover, the overall trend of convergence is still very weak, calling for a longer period of observation.
The increasing and decreasing trends of economic growth in Aceh and Papua, respectively, has increased the impact of the neighbourhood effect on GRDP con-vergence. This is an early indication that these districts’ economies are connecting to those of their neighbours – once an unlikely scenario, given the prevalence of mining in these areas. The neighbourhood effect could be crucial in indicating the socio-economic connectivity and the relationship between Aceh and other prov-inces in Indonesia – especially North Sumatra – as parts of the economy inter-act with each other, but it could also be a sign that socio-economic events such
as conlict and economic downturns could spread more easily. Furthermore, the
question of whether GRDP per capita could really represent the condition of the people has yet to be answered. Aceh, for example, may have risen in terms of
GRDP per capita because of the low of aid and aid workers after the 2004 tsu -nami, rather than because of the refunctioning of its economy.
Given the complexities of using GRDP per capita in growth analyses of Indo-nesia, this article has used HDI as a comparative indicator of development. The
result shows signiicant regional convergence in HDI numbers during 1999–2008, despite the absence of signiicant convergence in regional GRDP per capita. The
speed of HDI convergence seems to have slowed, however, and the impact of the neighbourhood effect lessened. This could be alarming in the future, because HDI indicators are closely related to the authorities delegated during decentrali-sation – especially education and health. The ability to lift the HDI numbers of
Indonesia’s less developed regions to the level of its more developed regions will therefore measure the success of this delegation process. Furthermore, the slowing of regional convergence has been followed by fewer instances of the neighbour-hood effect, which, in turn, could indicate fewer spillovers from one area to its neighbours. The data are not clear on whether this is the case, but there are many reasons for spillovers to reduce in number. For example, a local authority’s lim-ited budget could force it to provide some services only to certain residents, based on their identity card (kartu tanda penduduk,KTP). More work needs to be done in this area, as well as on the use of HDI numbers to examine regional convergence and its implications – especially since HDI is a composite index. Furthermore, the results of distance-based spatial models show that although the neighbourhood effect could have an impact on convergence in certain periods, it does not alter the
speed
of convergence signiicantly.
A more interesting inding comes from this article’s analysis of Java and Suma
-tra. The convergence of GRDP per capita is estimated to be signiicant in Sumatra,
while Java’s GRDP per capita is estimated to diverge. In contrast, the regional convergence in HDI numbers is strong in both islands, although the speed of con-vergence is increasing in Java and decreasing in Sumatra. The pattern of inequal-ity of GRDP per capita in Java shows that despite the recovery of Java’s big cities
after the Asian inancial crisis of 1997–98 contributing to increased inequality on
the island, Jakarta was the main source of this increase, especially during 2002–08. Jakarta’s hampering of convergence in GRDP per capita during decentralisation does not reduce the importance of regional inequality. In contrast, it could com-plicate the issue. Jakarta is often seen as representing central government, and
Jakarta’s absorbing the inancial resources of other regions was one of the main
arguments for decentralisation.
The pattern of HDI convergence is less dominated by the development of Jakarta’s districts. Although the HDI numbers for Jakarta’s districts increased more modestly than they did for other districts, the rise of the less developed dis-tricts in Java and Sumatra have played a greater role in convergence. The catch-up process seems to have slowed during 2005–08, however, and the pattern suggests that more attention needs to be paid to inequality and convergence among those districts outside Java and Sumatra, because it is less evident that they are catching up. While there are some districts in Nusa Tenggara, in the east of Java, show-ing some evidence of doshow-ing so, some districts in Papua, such as Jayawijaya and Merauke, saw their already relatively low HDI numbers improve the least during 1999–2008.
This assessment of regional convergence during and after the start of Indone-sia’s decentralisation process shows some promising trends in GRDP per capita but challenging conditions for HDI convergence. It has not, however, examined what effect, if any, decentralisation itself has had on the speed of convergence. There were some indications that the new districts formed during decentralisa-tion initially had high levels of growth, owing to new investment in building new governments, but this trend seems to have faded away fairly quickly.
REFERENCES
Akita, T. and Alisjahbana, A.S. (2002) ‘Regional income inequality in Indonesia and the ini-tial impact of the economic crisis’, Bulletin of Indonesian Economic Studies 38 (2): 201–22. Akita, T., Kurniawan, P.A. and Miyata, S. (2011) ‘Structural changes and regional income
inequality in Indonesia: a bidimensional decomposition analysis’, Asian Economic Jour-nal 25 (1): 55–77.
Akita, T. and Lukman, R.A. (1995) ‘Interregional inequalities in Indonesia: a sectoral decomposition analysis for 1975–92’, Bulletin of Indonesian Economic Studies 31(2): 61–81. Alm, J., Aten, R.H. and Bahl, R. (2001) ‘Can Indonesia decentralise successfully? Plans,
problems and prospects’, Bulletin of Indonesian Economic Studies 37 (1): 83–102.
Anand, S. and Sen, A. (2000) ‘The income component of the Human Development Index’, Journal of Human Development 1 (1): 83–106.
Anselin, L. (1988) Spatial Econometrics: Methods and Models, Kluwer Academic Publishers, Dordrecht, Netherlands.
Arndt, H.W. (1973) ‘Regional income estimates’, Bulletin of Indonesian Economic Studies 9 (3): 87–102.
Aspinall, E. and Berger, M.T. (2001) ‘The break-up of Indonesia? Nationalisms after decolo-nisation and the limits of the nation-state in post-cold war Southeast Asia’, Third World Quarterly 22 (6): 1003–24.
Barro, R.J. and Sala-I-Martin, X. (1991) ‘Convergence across states and regions’, Brookings Papers on Economic Activity 1: 107–82.
Brodjonegoro, B. (2009) ‘Fiscal decentralization and its impact on regional economic devel-opment
and iscal sustainability’, in Decentralization and regional autonomy in Indone-sia: Implementation and challenges, eds C.J.G. Holtzappel and M. Ramstedt, Institute of Southeast Asian Studies, Singapore: 196–221.
Brodjonegoro, B. and Martinez-Vazquez, J. (2002) ‘An analysis of Indonesia’s transfer sys-tem: recent performance and future prospects,’ Paper presented at ‘Can decentraliza-tion help rebuild Indonesia?’, Georgia State University, Atlanta GA, 1–3 May.
Cliff, A.D. and Ord, J.K. (1973) Spatial Autocorrelation, Pion Ltd., London.
Egger, P. and Pfaffermayr, M. (2006) ‘Spatial convergence’, Papers in Regional Science 85 (2): 199–215.
Fingleton, B. and Lopez-Bazo, E. (2006) ‘Empirical growth models with spatial effects’, Papers in Regional Science 85 (2): 177–98.
Garcia-Garcia, J. and Soelistianingsih, L. (1998) ‘Why do differences in provincial incomes persist in Indonesia?’, Bulletin of Indonesia Economic Studies 34 (1): 95–120.
Hill, H., Resosudarmo, B. and Vidyattama, Y. (2008) ‘Indonesia’s changing economic geog-raphy’, Bulletin of Indonesian Economic Studies 44 (3): 407–35.
Kosfeld, R., Eckey, H.F. and Dreger, C. (2002) ‘Regional convergence in uniied Germany:
a spatial econometric perspective’, Economic Discussion Paper No. 39/02, University of Kassel, Germany.
Leigh, A. and Van der Eng, P. (2009) ‘Inequality in Indonesia: what can we learn from top incomes?’, Journal of Public Economics 9 3(1–2): 209–12.
LeSage, J.P. (1999) Spatial Econometrics, The Web Book of Regional Science, Regional Research Institute, West Virginia University, Morgantown WV.
Magalhães, A., Hewings, G.J.D. and Azzoni, C.R. (2005) ‘Spatial dependence and regional convergence in Brazil’, Investigaciones Regionales 6: 5–20.
McCulloch, N. and Sjahrir, B.S. (2008) ‘Endowments, location or luck? Evaluating the deter-minants of sub-national growth in decentralized Indonesia’, Policy Research Working Paper No. 4769, World Bank, Washington DC.
McGillivray, M. (1991) ‘The Human Development Index: yet another redundant composite development indicator?’, World Development 19 (10): 1461–8.
Milanovic
, B. (2005) ‘Half a world: regional inequality in ive great federations’, Policy
Research Working Paper No. 3699, World Bank, Washington DC.
Niebuhr, A., (2001) ‘Convergence and the effects of spatial interaction’, Jahrbuch für Region-alwissenschaft 21: 113–33.
Resosudarmo, B.P. and Vidyattama, Y. (2006) ‘Regional income disparity in Indonesia: a panel data analysis’, ASEAN Economic Bulletin 23 (1): 31–44.
Rey, S.J. (2001) ‘Spatial empirics for economic growth and convergence’, Geographical Anal-ysis 33: 195–214.
Rey, S.J. and Montouri, B. (1999) ‘US regional income convergence: a spatial econometric perspective’, Regional Studies 33: 143–56.
Rodriguez-Pose, A. and Ezcurra, R. (2010) ‘Does decentralization matter for regional dis-parities? A cross-country analysis’, Journal of Economic Geography 10 (5): 619–44. Sala-I-Martin, X. (1996) ‘Regional cohesion: evidence and theories of regional growth and
convergence’, European Economic Review 40: 1325–52.
Shankar, R. and Shah, A. (2003) ‘Bridging the economic divide within countries: a score-card on the performance of regional policies in reducing regional income disparities’, World Development 31 (8): 1421–42.
Suryadarma, D., Widyanti, W., Suryahadi, A. and Sumarto, S. (2006) ‘From access to income: regional and ethnic inequality in Indonesia’, SMERU Working Paper, May, SMERU Research Institute, Jakarta.
Tadjoeddin, M.Z. (2013) ‘Miracle that never was: disaggregated level of inequality in Indo-nesia’, International Journal of Development Issues 12(1): 22–35.
Tadjoeddin, M.Z., Suharyo, W.I. and Mishra, S. (2001) ‘Regional disparity and vertical
con-lict in Indonesia’, Journal of the Asia Paciic Economy 6 (3): 283–304.
Williamson, J. (1965) ‘Regional inequality and the process of national development’, Eco-nomic Development and Cultural Change 4: 3–47.
World Bank (2003) ‘Decentralizing Indonesia: a regional public expenditure review over-view report’, East Asia Poverty Reduction and Economic Management Unit, World Bank, Jakarta.