Inner-Outer Circle Teaching Method VS Demonstration Method: A Comparative Study of Classroom Assessment in PGSD-UKSW Teaching
Donald Samuel
State University of Semarang
Donald Samuel, S.Pd, Department of Social Studies Education, Post Graduate
Program, State University of Semarang
Correspondence concerning this article should be addressed to Donald Samuel,
Department of Social Studies Education, Post Graduate Program, State University
of Semarang, Bendan Ngisor Semarang Campus, Semarang, Indonesia. E-mail:
Abstract
This paper explores comparison result of experiment research conducted Inner-outer circle method and Demonstration Method. Purpose of the research is comparing its two methods in University teaching. This is a mix method of research that used the sequential explanatory strategy. Research finding shown that Inner-outer circle method better than Demonstration in terms of study skill and critical thinking, meanwhile, to improve creativity, innovation,
Inner-Outer Circle Teaching Method VS Demonstration Method:
A Comparative Study of Classroom Assessment in PGSD-UKSW Teaching
Education does not only include scores, GPA, graduation, and other symbols of achievement. Education has a deeper meaning of those things. There are various definitions of education that focus on the purpose of education.
Langeveld in Gulo (2005) stated "Education is efforts to reach moral maturity". The notion suggests that the final product of education is human decency of an adult. On the other hand, Vadeboncoeur in Richardson (1997) stated that there are two perspectives educational purposes. The first objective is "to educate the individual child in a manner that supports the child's interests and needs". The purpose of education is consistent with the educational objectives according to Piagetian flow. While the second goal is "social transformation and the reconstruction of society aligned with democratic ideals." This goal is consistent with the educational objectives according to Vygotskian flow.
Education objectives are broad and can be narrowed down into more specific educational goals. One of the goals of education, particularly in relation to the concept of a link to the world of work are programmed by UNESCO, is the mastery of competencies (Arguelles et al., 2000:7). Due to their competence, students are expected to be ready to face the working experience.
In fact, students should possess competencies which are formulated in the curriculum and which are not optimal in producing graduates who are ready to work. There are two main competencies that students should have: hard skills and soft skills (Ramesh et al., 2010:2). Soft skills as the complement of hard skills can be like; attitude, communication skills, and ethics. Basic skills and soft skills are perfect combination that graduates should have to be able to compete in working environment.
Therefore, it is suggested that to achieve mastery of competencies (which tend to be hard skills), must be followed by mastering another aspect, that is soft skills. Consequently, innovative and non-conventional teaching methods
Literature Review
Innovative learning methods are often identified with non-lecture teaching methods. If teaching is associated with the concept proposed by Ramsden
(1992:111-118), he divided 3 concepts of teaching as: teaching as telling or transmission, teaching students as organizing activity, and teaching as making learning possible. Then learning on innovative teaching method is about teaching students as organizing activity, and teaching as making learning possible.
There are various forms of innovative learning method that can be
selected. The particular methods should be adjusted to at least 6 terms as proposed by Babanthdge (Ю К ч Б , 1927 to 1987) in Wang
(2012:415). The first is that the choosing of method should conform to teaching principles; the second is to be in accordance with teaching purpose and tasks; the third is to be in line with teaching content; the forth is to come up to student's possibility, his preparation and the peculiarities of the class; the fifth is to fit in with the current situation and specific time; the last one is to be corresponded with teacher's possibility, in terms of his experience and knowledge, the actual training level, the capability to apply various methods and personality. Based on these considerations, the study will focus on testing the comparison between inner-outer circle method and the method of student demonstrations.
Inner-outer circle is a form of Socratic Method or method of Elenchus. This method is one of the oldest teaching methods that focus on critical thinking. Although this method was implemented few decades ago, this method is still innovative and possible to be modified in various ways.
In the inner-outer circle method, technically a student in a class will be divided into two groups of the same number, and each group will sit in a circle. Circle forms the first group then the second group, thus forming two circles, where one circle is inside (inner circle), and another circle is outside (outer circle). Canady (1996:32) states "Those students seated in the inner circle are of
template (Socratic Method Template for Group Discussion or Inner Circle) and follow the same steps of the small group." While "the Outer Circle is allowed to enter the discussion and ask questions".
In this study, the inner-outer circle method is tested in grade RS-11-I PGSD SWCU in the Assessment of Teaching course. Methods used to teach the material on evaluation models. The class consists of 42 students that are divided into two groups (21 people each), which is the inner circle of the group, and the other group is the outer circle.
After sitting around in pairs between the inner circle and outer circle, each student in the outer circle asks one question to her partner in the inner circle. The pair subsequently answered, and answers are recorded for later assessed by the questioner. After the questions, the student who sits in the outer circle then rotates clockwise as far as 1 person to change their partner. To a new partner, outer circle do the same thing with what to do with his old partner. After 10 times with
multiple partners, and ask 10 questions, the outer circle group then swap roles with the inner circle group. The same activity is repeated up to 10 times of changing partners.
Demonstration of the method used in the classroom and the same course with the method of inner-outer circle, but on a different topic, the topic of
evaluation according to the Education Ministerial Regulation (Permendiknas) no. 20 of 2003 on Evaluation Standards. Petrina (2007:14) states "A demonstration is a teaching method for modeling knowledge and skills related to effective use of applications, experiments, tools, machines, instruments, and processes."
Demonstration method used in this study is the demonstration conducted by students in explaining the given material. Demonstrations can be drama, debates, talk shows, and other forms of creative others. In this lesson, students were divided into 7 groups, where each group presents a chapter in the Permendiknas.
of quantitative data; qualitative data collection; qualitative data analysis, and interpretation of the overall analysis.
Quantitative data collection in this study is performed with instruments such as post test, and questionnaires. Post-test is used to assess the ability of students associated with the end of the lecture material after the learning cycle is done. While the questionnaire used to obtain feedback from students regarding the teaching methods used. Prior to it, the validity of the two instruments have been tested (the method corrected item-total correlation), and its reliability (Cronbach's alpha method) in another class, the RS 11 J. Both instruments will produce
quantitative data that will be measured in interval scale. Quantitative data that have collected will be analyzed before inferential (classic assumption of
normality) using Kolmogorov Smirnov technique. Once the data is complete, the t-test is used for comparing the effectiveness between inner-outer circle indicator and demonstration method on mastery of the material (post-test), and motivation (questionnaire). Error rate (level of error) is set at 0.05. All calculations, both descriptive statistical calculations, classical parametric test assumptions, and inferential calculations will be carried out with the help of statistical program PASW Statistics Data Editor 18.
Qualitative data collection in this study was done through observation, and interviews. Both techniques are performed to obtain data on activities in the classroom, creativity, and interest in learning, then to obtain valid data, used triangulation of sources, especially on interviewing techniques. Data were collected and analyzed by an interactive data analysis technique of Miles and Hubberman (Hubberman, 1994:10).
Finding
Table 1. Descriptive Statistics of Post Test
Iner_outer Demo
N Valid 42 42
Missing 0 0
Mean 74.7619 65.2381
Median 75.0000 66.0000
Mode 75.00a 65.00a
Std. Deviation 6.61782 6.61782
Minimum 55.00 50.00
Maximum 92.00 83.00
Sum 3140.00 2740.00
a. Multiple modes exist. The smallest value is shown
From the results of these calculations it appears that the average score of students after learning the inner-outer circle method of 74.7619. This value is higher than the average value after the method of demonstration that only 65.2381. However, the average difference is still to be tested with inferential analysis. However, previously, the data should be distributed in a normal curve. Calculation results for the value of post test normality after inner-outer circle method are shown in Table 2, while the calculation of the value of post test for normality after the demonstration method are shown in Table 3.
Table 2. One-Sample Kolmogorov-Smirnov Test For Inner-Outer Method’s Post-test
Iner_outer
N 42
Normal Parametersa,b Mean 74.7619
Std. Deviation 6.61782
Most Extreme Differences Absolute .145
Positive .143
Negative -.145
Kolmogorov-Smirnov Z .937
Asymp. Sig. (2-tailed) .343
a. Test distribution is Normal.
Table 3. One-Sample Kolmogorov-Smirnov Test For Demonstration Method’s Post-test
Demo
N 42
Normal Parametersa,b Mean 65.2381
Std. Deviation 6.61782
Most Extreme Differences Absolute .118
Positive .118
Negative -.116
Kolmogorov-Smirnov Z .766
Asymp. Sig. (2-tailed) .600
a. Test distribution is Normal.
b. Calculated from data.
From both tables, it appears that both the average post-test data (after the method of inner-outer circle and demonstration) distributed in a normal curve. Therefore, it is worth analyzing the data inferential techniques t-test. Table 4 below is the calculation of the second t-test data.
Table 4. Paired Samples Test of Score
Paired Differences
t df
Sig. (2-tailed) Mean Std. Deviatio n Std. Error Mean 95% Confidence
Interval of the
Difference
Lower Upper
Pair 1 Inner_outer
- Demo
9.52381 2.29780 .35456 8.80776 10.23986 26.861 41 .000
Table 4 shows that the value of t as 26.861 that was significant at an error rate of 0.000. This indicates that the value of t is also significant at a higher error rate, 0.05, which means there is different of significant value of the post test methods between inner-outer circle and demonstration method, where the average score on the post test inner-outer circle method is higher than the methods of
Table 5. Paired Samples Correlations Inner-outer Circle Post-test
and Demonstration Post-test
N Correlation Sig.
Pair 1 Iner_outer & Demo 42 .940 .000
Furthermore, Table 5 shows that the correlation between the two methods was 0.940 which is significant at 0.000. This means there is a significant correlation between the post-test of inner-outer circle and demonstration method. Students who scored high on the inner-outer circle method also get high marks on the method of demonstration. Similarly for students who receive low grades.
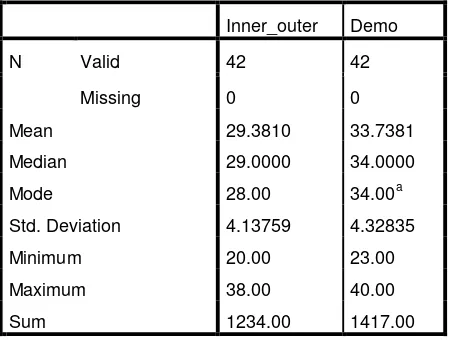
Data on student motivation were collected through a questionnaire divided into two groups of data, which follow the students' motivation during learning with a method of inner-outer circle and demonstration methods. Data has been collected the motivation described in the descriptive statistics in Table 6 below.
Table 6. Descriptive Statistics of Motivation
Inner_outer Demo
N Valid 42 42
Missing 0 0
Mean 29.3810 33.7381
Median 29.0000 34.0000
Mode 28.00 34.00a
Std. Deviation 4.13759 4.32835
Minimum 20.00 23.00
Maximum 38.00 40.00
Sum 1234.00 1417.00
a. Multiple modes exist. The smallest value is shown
Table 7. One-Sample Kolmogorov-Smirnov Test of Motivation
Inner_outer Demo
N 42 42
Normal Parametersa,b Mean 29.3810 33.7381
Std. Deviation 4.13759 4.32835
Most Extreme Differences Absolute .107 .123
Positive .083 .088
Negative -.107 -.123
Kolmogorov-Smirnov Z .696 .796
Asymp. Sig. (2-tailed) .718 .551
a. Test distribution is Normal.
b. Calculated from data.
From that table, it appears that the data in the two methods tend to be normally distributed. Therefore, the data deserves to be tested in trials using inferential statistical parametric t-test technique as set forth in Table 8 below.
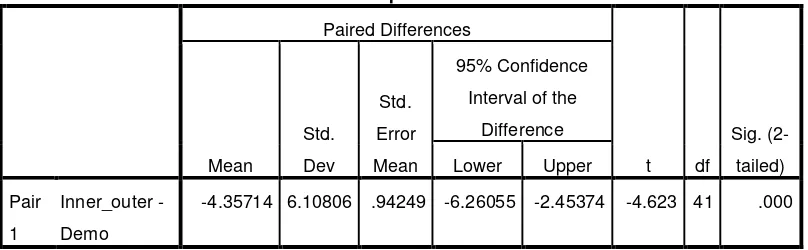
Table 8. Paired Samples Test of Motivation
Paired Differences
t df
Sig. (2-tailed) Mean Std. Dev Std. Error Mean 95% Confidence
Interval of the
Difference
Lower Upper
Pair
1
Inner_outer -
Demo
-4.35714 6.10806 .94249 -6.26055 -2.45374 -4.623 41 .000
It appears that the t value of -4623 significant at the 0.000 level also means significant at the 0.05 level. This indicates a significant difference in the self-motivation of students when learning to follow the inner-outer circle method and demonstration method, in which the motivation of students in the following study with demonstration method is higher than the motivation of students to follow the learning with inner-outer circle method.
class path that includes active learning, and creativity of students. While the data derived from the interview contains data on interest, impressions, and a message from the students. Collected data is then reduced as Miles and Hubberman interactive analysis. The following is the data display.
In the inner-outer circle method, which acts as an outer group students often are not satisfied with the answers and explanations of the inner group, especially when paired with inner-capable students who are less academic. Therefore, learning is less effective, because the sources of students are often not competent to answer and explain. Other outer group students were satisfied when paired with students from inner group who are competent in terms of the material being discussed. In addition, the outer students often have difficulty in judging their partners, their ignorance about the validity of an answer from the couple. Therefore, the assessment is based on only pair stability in answering. On the other hand, inner students feel anxious when meeting with the requester (outer group) which is considered to be competent. Fear is when students are given questions that cannot answered, it is feared the outer group will give a poor assessment. To deal with such matters, the students had prepared as well as possible in terms of mastery of the material before the lecture. Similarly, in the lecture, the students feel they have a challenge to learn (especially when given a question). Books and reference sources are brought from home to be a reference in answering the question. After answering, students could understand the topic better and the knowledge can be easily embedded in long term memory.
In the method of demonstration, students were divided into 7 groups show different show. Noted there are demonstration models, namely drama (2 groups), talk shows (1 group), talk shows and movies (1 group), an explanation using wayang kulit (1 group), debate (1 group), eg the selection of miss education (1 group). In this method, students can channel their talents (especially in art) in order to convey the material. Students perform a variety of well prepared for presentational purposes such as costumes, props, video, music, and other
activity takes 7 times the meeting, with a maximum 50-minute demonstration (1 credit). Students recognize that this method can increase creativity,
self-confidence, and innovation in them. The ideas and the ideas channeled in the presentation of innovative concepts. When not performing, the students also felt comforted by the appearance of another group of mostly high-value innovation. Motivation in following the course also increased in the presence of this
demonstration (evident from the high student attendance at meetings that there is an element of the demonstration). However, when watching the demonstration, students tend to pay attention to the elements of art and innovation, rather than the substance of the material. Thus, student mastery of the material seems very low. It shows that the discussion session tends to contain criticism and comments about appearance, instead of the substance.
Conclusion and Future Study
References
Arguelles Antonio, Gonczi Andrew. (2000). Competency Based Education and Training. A World Perspective. Belderas, Mexico: Editorial Limusa, S.A de C.V. pp 7.
Canady L. Robert, Rettig D. Michael. (1996). Teaching in the Block. Strategies for Engaging Active Learning. Larchmont, NY: Eye on Education. pp 32. Gulo W. (2005). Strategi Belajar Mengajar. Jakarta, Indonesia: Grasindo. pp
40-41.
Hidalgo Alan. (2013). Between Two Worlds. Bloomington, IN: iUniverse. pp 15. Lee W. Steven. (2005). Encyclopedia of School Psychology. Thousand Oak, CA:
Sage Publisher. pp 134.
Miles B. Matthew, Hubberman Michael. (1994). Qualitative Data Analysis. Thousand Oaks, CA: Sage Publisher. pp 10.
Petrina Stephen. (2007). Advanced Teaching Methods for The Technology Classroom. Hershey, PA: Information Science Publishing. pp 14.
Richardson Virginia. (1997). Constructivist Teacher of Education. Building a World of New Understanding. London, UK: Falmer Press. pp 15.
Ramesh Gopalaswamy, Ramesh Mahadevan. (2010). The Ace of Soft Skills. Attitude, Communication, and Etiquette for Success. Noida, India: Dorling Kindersley. pp 2.
Ramsden Paul. (1992). Learning to Teach in Higher Education. London, England: Routledge. pp 111-118.
Shipley G. Kenneth, McAfee G. Julie. (2009). Assessment in Speech Language Pathology. Clifton Park, NY: Delmar Cengage Learning. pp 9.
Biography
Donald Samuel is a student of Social Science, Post-Graduate Program of State University of Semarang. As bachelor graduate SWCU FKIP Economics Education she had a variety of experiences in research and scientific publications. Some articles that have been written, among others:
The Behavior Using Theory to Increase Students GPA (International Seminar, University Student's Health, Chung Yuan Christian University, Taiwan);
Scenario Economic Education Curriculum Development FKIP SWCU (Seminar on Social and Cultural Globalization in perspective Economics
Education’s Curriculum Development, SWCU);
Progressive Teacher vs Perennials Teacher, in answering the needs of future teachers (Indonesian Educationist Association, Muhammadiyah Solo University);
Students’ Learning in Semester Credit System (National Seminar, Post Graduate Program, Sebelas Maret University);