EDITED BY:
Sivasampu S, Arunah C
Kamilah D, Fatihah M
Goh PP, Hisham AN
HOSPITAL
NATIONAL HEALTHCARE
E S T A B L I S H M E N T &
WORKFORCE STATISTICS
N AT I O N A L H E A LT H C A R E S T AT I S T I C S I N I T I AT I V E
National Healthcare Establishment and Workforce Statistics (Hospital) 2011
September 2013
©Ministry of Health Malaysia
Published by:
The National Healthcare Statistics Initiative (NHSI) National Clinical Research Centre
Ministry of Health 3rd Floor, MMA House
124, Jalan Pahang 53000 Kuala Lumpur Malaysia
Tel. : (603) 40439300/400 Fax : (603) 40439500 E-mail : [email protected]
Website : http://www.crc.gov.my/nhsi/
This report is copyrighted. Reproduction and dissemination of its contents in part or in whole for research, educational or non-commercial purposes is authorized without any prior written permission provided the source is fully acknowledged. The suggested citation is `National Clinical Research Centre. National Healthcare Establishment & Workforce Statistics (Hospital) 2011. Kuala Lumpur 2013.’
This report is also available electronically on the website of the National Healthcare Statistics Initiative at: http://www.crc.gov.my/nhsi/
Funding:
The National Healthcare Statistics Initiative was funded by a grant from the Ministry of Health Malaysia (MRG Grant No. NMRR-09-842-4718)
CONTENTS
ACKNOWLEDGEMENTS vi
ABOUT NATIONAL HEALTHCARE ESTABLISHMENT AND WORKFORCE SURVEY (NHEWS) – HOSPITAL vii
MEMBERS OF NHEWS (HOSPITAL) PROJECT TEAM viii
MEMBERS OF NHEWS (HOSPITAL) EXPERT PANELS ix
SUMMARY OF STUDY PROCESS xi
STUDY METHODOLOGY xii
CONSORT DIAGRAM xix
Consort Diagram NHEWS 2011 (Acute Curative Hospitals) xix
Consort Diagram NHEWS 2011 (Maternity Services) xx
Consort Diagram NHEWS 2011 (General Surgery Services) xxi
Consort Diagram NHEWS 2011 (Oncology Services) xxii
Consort Diagram NHEWS 2011 (Psychiatry Services) xxiii
Consort Diagram NHEWS 2011 (Ophthalmology Services) xxiv
ABBREVIATIONS xxv
SYMBOLS xxvi
CHAPTER 1 | OVERVIEW OF HOSPITALS AND SPECIALISTS SERVICES IN MALAYSIA 1
CHAPTER 2 | ACUTE CURATIVE HOSPITAL SERVICES IN MALAYSIA 5
Table 2.1 Hospitals Providing Acute Curative Care 7
Table 2.2 Types of Hospitals Establishment Providing Acute Curative Care 8
Table 2.3 Different Types of Private Hospital’s Entrepreneurship 9
Table 2.4 Inpatient beds 10
Table 2.5 Operating theatre (OT), Operating Rooms (ORs) and Functioning ORs 11
Table 2.6 Doctors and Patients Admission 12
Table 2.7 Average Length of Stay (ALOS), Bed Occupancy Rate (BOR), and Turnover Interval (TOI) 13
Table 2.8 Average Length of Stay (ALOS) by Acute Hospital Type 14
Table 2.9 Bed Occupancy Rate (BOR) 15
Table 2.10 Turnover Interval (TOI) by Acute Hospital Type 16
Table 2.11 Hospital Doctors, Staff Nurses (with and without Post Basic Training) 17
Table 2.12 Community Nurses and Assistant Nurses 18
Table 2.13 Assistant Medical Officers (AMO) 19
Table 2.14 Pharmacists, Physiotherapists, Occupational Therapists, and Dieticians 20
Table 2.15 Medical Record Officers and Medical Social Officers 21
Table 2.16 Computed Tomography (CT) Scanners and Rate of CT scan Procedures 22
Table 2.17 Magnetic Resonance Imaging (MRI) and Rate of MRI Procedures 23
CHAPTER 3 | MATERNITY SERVICES IN MALAYSIAN HOSPITALS AND MATERNITY HOMES 25
Table 3.1 Hospitals Providing Maternity Services 28
Table 3.2 Functioning Delivery Beds 29
Table 3.3 Dedicated OT Facilities and Functioning ORs 30
Table 3.4 Functional Obstetric High Dependency Unit (HDU) Beds 30
Table 3.5 Total Deliveries 31
Table 3.6 Spontaneous Vertex Deliveries (SVD) 32
Table 3.7 Vaginal Breech Deliveries 33
Table 3.8 Instrumental Deliveries using Vacuum 34
Table 3.9 Instrumental Deliveries using Forceps 35
Table 3.10 Caesarean Surgeries 36
Table 3.11 Lower Segment Caesarean Section (LSCS), Caesarean Hysterectomy and Hysterotomy 37
Table 3.12 Multiple Pregnancies Deliveries 38
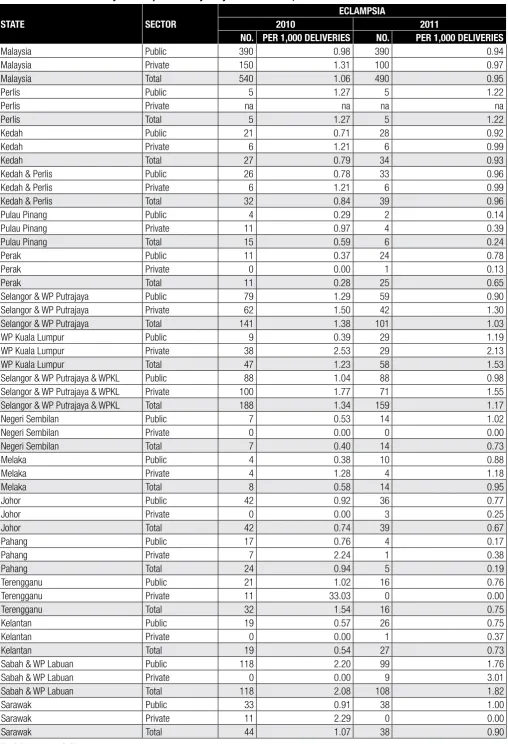
Table 3.13 Eclampsia 39
Table 3.14 Post Partum Haemorrhage (PPH) 40
Table 3.15 Newborns Delivered & Admitted to Paediatrics, NICU & SCN 41
Table 3.16 Obstetrics & Gynaecology (O&G) Specialists and Medical Officers 42
Table 3.17 Staff Nurses and Community Nurses in O&G services 43
Table 3.18 Staff Nurses with Midwifery and Community Nurses (Public Hospitals Obstetric Ward) 44
Table 3.19 Staff Nurses with Midwifery and Community Nurses (Public Hospitals Labour Ward) 44
Table 3.20 Staff Nurses with Midwifery and Community Nurses (Public Hospitals Obstetric HDU) 45
CHAPTER 4 | SURGICAL SERVICES IN MALAYSIAN HOSPITALS 47
Table 4.1 Hospitals Providing General Surgery Services 49
Table 4.2 Total Surgeons, Operation Theatre (OT) and Theatre Scrub Nurses 50
Table 4.3 Dedicated Emergency/Trauma Theatres (Public Hospitals) 51
Table 4.4 General Surgeons and Total Elective Operating Hours (Public Hospitals) 51
Table 4.5 Elective Cases in General Surgery (Public Hospitals) 52
Table 4.6 Emergency Cases in General Surgery (Public Hospitals) 52
Table 4.7 Mastectomies 53
Table 4.8 Total, Open and Laparoscopic Inguinal Hernia Surgeries 54
Table 4.9 Total, Open and Laparoscopic Cholecystectomies 55
Table 4.10 OGDS Scopes and OGDS Cases by Surgical and Medical Specialists (Public Hospitals) 56
Table 4.11 OGDS Scopes and OGDS Cases (Private Hospitals) 56
Table 4.12 Colonoscopes and Colonoscopy Cases by Surgical and Medical Specialists (Public Hospitals) 57
Table 4.13 Colonoscopes and Colonoscopy Cases (Private Hospitals) 57
Table 4.14 ERCP Scopes and ERCP Cases by Surgical and Medical Specialists (Public Hospitals) 58
Table 4.15 ERCP Scopes and ERCP Cases (Private Hospitals) 58
Table 4.16 OGDS Scopes, Colonoscopes and ERCP Scopes 59
Table 4.17 Theatre Scrub Nurses 60
Table 4.18 General Surgeons and Anaesthesiologists 61
Table 4.19 Breast Surgeons, Breast and Endocrine Surgeons 62
Table 4.20 Vascular Surgeons, Hepatobiliary Surgeons, and Colorectal Surgeons 63
CHAPTER 5 | ONCOLOGY SERVICES IN MALAYSIAN HOSPITALS 65
Table 5.1 Hospitals Providing Oncology Services 67
Table 5.2 Hospitals Providing Oncology Services (with and without Oncologist) 68
Table 5.3 Clean Room for Reconstitution of Cytotoxic Drugs 69
Table 5.4 Hospitals Providing Cytotoxic Drug Reconstitution (CDR) Services 70
Table 5.5 Chemotherapy Day Care Services, Chemotherapy Beds and Chairs 71
Table 5.6 Oncologists 72
Table 5.7 Oncology Trained Nurses, Radiation Therapists and Physicists 73
Table 5.8 Megavoltage Machines, Brachytherapy Machines and Simulators 74
Table 5.9 Physics Equipment and Treatment Planning System Devices 75
CHAPTER 6 | PSYCHIATRIC SERVICES IN MALAYSIAN HOSPITALS 77
Table 6.1 Hospitals Providing Psychiatry Services 80
Table 6.2 Inpatient Dedicated Beds and Functioning Inpatient Dedicated Beds 81
Table 6.3 Inpatient Psychiatry Admissions, Dedicated Beds and Mean Bed Occupancy Rate 82
Table 6.4 Follow up Outpatient Visits, New Cases and Referrals from Wards or Emergency Department 83
Table 6.5 Community Psychiatric and Psychiatric Rehabilitation Services (Public Hospital) 84
Table 6.6 Hospital Visits with Patients below 18 Years Old and above 60 Years Old 85
Table 6.7 Methadone Replacement Therapy (MRT) Services & Total MRT Patients (Public Hospital) 86
Table 6.8 ECT Machines and Procedures 89
Table 6.9 Psychiatrists 88
Table 6.10 Clinical Psychologists 89
Table 6.11 Counsellors in Psychiatry Services (Full Time and Common User) 90
Table 6.12 Medical Social Workers in Psychiatry Services (Full Time and Common User) (Public Hospital) 91
Table 6.13 Nurses in Psychiatry 92
Table 6.14 Assistant Medical Officers in Psychiatry Service (Public Hospital) 93
CHAPTER 7 | OPHTHALMOLOGY SERVICES IN MALAYSIAN HOSPITALS 95
Table 7.1 Hospitals Providing Ophthalmology Services 97
Table 7.2 Dedicated Ophthalmology Operating Rooms (ORs) (Public Hospitals) 98
Table 7.3 Ophthalmology Elective Operating Hours (Public Hospitals) 98
Table 7.4 Cataract Surgery (Day care and Inpatient) 99
Table 7.5 Glaucoma Surgery (with and without Implant) 100
Table 7.6 Vitreoretinal Surgeries 101
Table 7.7 Ophthalmologists 102
Table 7.8 Optometrists 103
Table 7.9 Assistant Medical Officers (AMOs) in Ophthalmology Services (Public Hospital) 104
Table 7.10 Nurses in Ophthalmology Services (Public Hospital) 104
Table 7.11 Ophthalmology Devices 105
APPENDICES 107
APPENDIX 1 | LIST OF DEFINITIONS 109
Chapter 2 : Hospital 109
Chapter 3 : Obstetrics 112
Chapter 4 : General Surgery 113
Chapter 5 : Oncology 114
Chapter6 : Psychiatry 116
Chapter 7 : Ophthalmology 117
APPENDIX 2 | PARTICIPANTS FOR NHEWS (HOSPITAL) 2011 119
Hospital Sector: Public/ Ministry Of Health 119
Hospital Sector: Public/ Ministry Of Health/Psychiatric Institution 120
Hospital Sector: Public/ University 121
Hospital Sector: Public/ Jabatan Kemajuan Orang Asli 121
Hospital Sector: Private 122
Hospital Sector: Private/ Maternity Homes 123
APPENDIX 3 | MALAYSIAN POPULATION, 2011 125
Table A3.1 Total Population by State, Malaysia 2011 125
Table A3.2 Total Population of Females by State, Malaysia 2011 125
Table A3.3 Number of Live Births by State, Malaysia 2011 126
Table A3.4 Total Population Under 19 Years Old by State, Malaysia 2011 126
APPENDIX 4 | DATA QUALITY STATEMENT 129
APPENDIX 5 | SURVEY PROFILES & RESPONSE RATE 133
Chapter 2: Hospital Services in Malaysia 133
Chapter 3: Maternity Services in Malaysian Hospitals and Maternity Homes 135
Chapter 4: Surgical Services in Malaysian Hospitals 137
Chapter 5: Oncology Services in Malaysian Hospitals 139
Chapter 6: Psychiatric Services in Malaysian Hospitals 141
Chapter 7: Ophthalmology Services In Malaysian Hospitals 143
APPENDIX 6 | MEDICAL SUBSPECIALTIES 145
Table A6.1 Anaesthesiologists, Emergency Medicine Specialists and Paediatricians 145
Table A6.2 Internal Medicine and Infectious Diseases Specialists 146
Table A6.3 Nephrologists and Endocrinologists 147
Table A6.4 Cardiologists and Respiratory Medicine Specialists 148
Table A6.5 Hepatologists and Gastroenterologists 149
Table A6.6 Clinical Haematologists 150
Table A6.7 Neurologists and Rheumatologists 151
Table A6.8 Geriatric Medicine Specialists 152
APPENDIX 7 | OTHER SPECIALTIES IN MEDICINE 153
Table A7.1 Cardiothoracic and Paediatric Surgeons 153
Table A7.2 Plastic and Reconstructive Surgeons 154
Table A7.3 Neurosurgery and Urology Specialists 155
Table A7.4 Orthopaedic Surgeons and Sport Medicine Specialists 156
Table A7.5 Radiologists and Nuclear Medicine Specialists 157
Table A7.6 Pathologists and Forensic Pathologists 158
ACKNOWLEDGEMENTS
The National Healthcare Statistics Initiative team would like to thank the Director General of Health Malaysia for his continuous support towards this survey and permission to publish the report.
Also, our sincere appreciation to the following for their participation, assistance, support and contributions:
• Deputy Director General of Health (Research and Technical Support), MOH
• Deputy Director General of Health (Medical), MOH
• Deputy Director General of Health (Public Health), MOH
• Director, National Clinical Research Centre (NCRC), National Institutes of Health (NIH)
• Director, Medical Development Division, MOH
• Director, Medical Practice Division, MOH
• Health Informatics Centre, MOH
• Private Medical Practice Control Section (National level)
• Private Medical Practice Control Unit (State level)
• The Association of Private Hospitals of Malaysia (APHM)
• All participating public, private and university hospitals which provided or allowed access to their establishment and workforce data.
• KPJ Healthcare Berhad
• Pantai Holdings Berhad
• Columbia Asia Sdn Bhd
• Malaysian Medical Council, Association of Private Hospitals of Malaysia, Obstetrical & Gynaecological Society of Malaysia, Malaysian
Psychiatric Association, Malaysian Oncological Society
• Head of Clinical Services, MOH
• Members of NHEWS (Hospital) Expert Panels
• All medical doctors and support personnel who participated in the NHEWS (Hospital)
• All those who have supported or contributed to the success of the NHEWS (Hospital) and publication of this report
Thank you.
National Healthcare Statistics Initiative (NHSI)
ABOUT NATIONAL HEALTHCARE ESTABLISHMENT AND WORKFORCE SURVEY (NHEWS) – HOSPITAL
BACKGROUND
The National Healthcare Establishment and Workforce Survey (NHEWS) – Hospital is an initiative to gather information on the Hospital establishment and specialty clinical services, facilities, workforce and the medical devices available in the country. This survey covers all acute curative hospitals and related specialty services within the public and private settings.
The rationale for this survey was to gather the relevant information that would be important for the country to develop an accurate and robust capacity for evaluating, monitoring and implementing its healthcare policies.
OBJECTIVES
GENERAL OBJECTIVE
To document the availability and distribution of the healthcare facilities, services, workforce and devices in the country.
SPECIFIC OBJECTIVES
• To estimate the number and density of hospital or related healthcare establishments and specialty service in Malaysia by geographical area • To establish trends in these services through continuous, consistent and reliable data collection
MEMBERS OF NHEWS (HOSPITAL) PROJECT TEAM
PRINCIPAL INVESTIGATOR DATUK DR. NOOR HISHAM ABDULLAH
PRINCIPAL CO-INVESTIGATORS
DR. SHEAMINI SIVASAMPU
DR. GOH PIK PIN
CO-INVESTIGATORS
DATO’ DR. NOORAINI BABA
DR. MD KHADZIR SHEIKH AHMAD
MR. ZAMANE ABDUL RAHMAN
PROJECT LIASON OFFICERS
DR. LAILI MURNI MOKHTAR
DR. AFIDAH ALI
PROJECT MANAGERS
DR. TAHRANI PERIANA KOVINDEAR
DR. ARUNAH CHANDRAN
DR. FOO CHEE YOONG (JAN 2013 – PRESENT)
SURVEY COORDINATORS
MS. FAIZAH AHMAD
MS. KAMILAH DAHIAN
MRS. FATIHAH MAHMUD
STATISTICIAN MS. LENA YEAP LAY LING
MEMBERS OF NHEWS (HOSPITAL) EXPERT PANELS
HOSPITAL SERVICES
EXPERT PANEL INSTITUTION
Datin Dr. Nor Akma Yusuf Medical Development Division, Ministry of Health
Dato’ Dr. Hjh. Juita Ghazalie Hospital Sultanah Bahiyah, Alor Setar
Dr. Siti Zaleha Mohd Salleh Hospital Selayang
Dr. Laili Murni Mokhtar Medical Development Division, Ministry of Health
Dr. Khalid Ibrahim Hospital Sungai Buloh
Dr. Farique Rizal Abd Hamid Hospital Sultanah Bahiyah, Alor Setar
Matron Hjh. Rosena Abdul Ghani Nursing Division, Ministry of Health
Dr. Sheamini Sivasampu National Clinical Research Centre, Ministry of Health
Mrs. Fatihah Mahmud National Clinical Research Centre, Ministry of Health
MATERNITY SERVICES
EXPERT PANEL INSTITUTION
Dr. Ravichandran Jeganathan Hospital Sultanah Aminah, Johor Bahru
Dato’ Dr. Ravindran Jegasothy Hospital Kuala Lumpur
Dr. Sharmini Diana Parampalam Hospital Seberang Jaya
Dr. Shamala Devi Karalasingam National Clinical Research Centre, Ministry of Health
Dr. Arunah Chandran National Clinical Research Centre, Ministry of Health
Ms. Faizah Ahmad National Clinical Research Centre, Ministry of Health
SURGICAL SERVICES
EXPERT PANEL INSTITUTION
Dato’ (Mr.) Abdul Jamil Abdullah Hospital Sultanah Nur Zahirah
Mr. Andrew Gunn Kean Beng Hospital Sultanah Aminah, Johor Bahru
Dato’ (Mr.) Wan Khamizar Wan Khazim Hospital Sultanah Bahiyah, Alor Setar
Dato’ (Mr.) Jiffre Din Hospital Tengku Ampuan Afzan, Kuantan
Dato’ (Mr) Mohamed Yusof Abd. Wahab Hospital Tengku Ampuan Rahimah, Klang
Mr. Tan Wee Jin Hospital Pulau Pinang
Mr. Nik Azim Nik Abdullah Hospital Umum Sarawak
Mr. Yan Yang Wai Hospital Raja Permaisuri Bainun, Ipoh
Mr. Chuah Jitt Aun Hospital Queen Elizabeth, Kota Kinabalu
Mr. Clement Edward Thaumanavar Hospital Tuanku Fauziah, Kangar
Mr. Nik Mohamad Shukri Nik Yahya Hospital Raja Perempuan Zainab II, Kota Bharu
Ms. Jasiah Zakaria Hospital Tuanku Jaafar, Seremban
Dr. Tahrani Periana Kovindear National Clinical Research Centre, Ministry of Health
ONCOLOGY SERVICES
EXPERT PANEL INSTITUTION
Dr. Gerard Lim Chin Chye Hospital Kuala Lumpur
Assoc. Prof. (Clinical) Dato’ Dr. Fuad Ismail Universiti Kebangsaan Malaysia Medical Center
Dr. Nellie Cheah Hospital Pulau Pinang
Dr. Nik Muhd. Aslan Abdullah Universiti Kebangsaan Malaysia Medical Center
Dr. Lau Kah Liew Hospital Kuala Lumpur
Mdm. Lim Yeok Siew Hospital Ampang
Dr. Hafizah Zaharah Ahmad Hospital Kuala Lumpur
Mdm. Sarah Lee Abdullah Hospital Kuala Lumpur
Dr. Foo Chee Yoong National Clinical Research Centre, Ministry of Health
Ms. Kamilah Dahian National Clinical Research Centre, Ministry of Health
PSYCHIATRY SERVICES
EXPERT PANEL INSTITUTION
Dr. Toh Chin Lee Hospital Selayang
Dr. Lim Chong Hum Hospital Ampang
Dr. Khairuddin Abdul Wahab Hospital Melaka
Dr. Azizul Awaluddin Hospital Putrajaya
Dr. Siti Nor Aizah Ahmad Hospital Kuala Lumpur
Dr. Chee Kok Yoon Hospital Kuala Lumpur
Dr. Rahima Dahlan @ Mohd Shafie Hospital Kajang
Dr. Ong Lieh Yan Hospital Bahagia, Ulu Kinta
Mrs. Fatihah Mahmud National Clinical Research Centre, Ministry of Health
OPHTHALMOLOGY SERVICES
EXPERT PANEL INSTITUTION
Dr. Elias Hussien Hospital Selayang
Dr. Anusiah K. Selvaathurai Hospital Melaka
Dr. Mariam Ismail Hospital Selayang
Dr. Chandramalar T. Santhirathelagan Hospital Sungai Buloh
Dr. Norlaila Talib Hospital Serdang
Dr. Thayanithi K. Sandragasu Hospital Kuala Lumpur
Dr. Arunah Chandran National Clinical Research Centre, Ministry of Health
SUMMARY OF STUDY PROCESS
CRF Development and Pilot Test
Survey Population
Hospital Induction and CRF Distribution
Data Collection and Data Entry
Data Cleaning, Verification and Standardisation
Data Analysis
Report / Manuscript Writing
Q
U
E
R
I
E
STUDY METHODOLOGY
Survey Population Framework Development
To determine the total hospitals and related healthcare establishment population, we first matched the records of the hospitals in the existing National Healthcare Establishment and Workforce Survey (NHEWS) Hospital database against the independent databases of the Private Medical Practice Control Division (private hospitals), and Medical Development Division, MOH (public hospitals). Both, the matched and unmatched records were then reviewed by the NHEWS team. Verification was conducted by contacting each unmatched site to confirm their operational status and establishment details as of 31st December 2011. These processes were performed for both the private and public hospital list. All verified changes were updated to our database (Figure 1).
The NHEWS 2011 survey collected data from all related healthcare establishments in Malaysia that fulfilled the criteria and definition relevant to the specific survey as shown below:
Table 1 Inclusion and Exclusion Criteria of the Respective Surveys
SURVEY INCLUSION CRITERIA EXCLUSION CRITERIA
Acute Curative Hospital All general and specialized hospital providing acute curative care
● Aboriginals (Orang Asli) Hospital ● Military hospitals
● Hospital units of institution, such as prison hospitals ● NGO hospitals
● Long term care hospitals e.g. rehabilitation and palliative care, nursing homes, leprosy centres and psychiatric institutions ● Hospitals that were non-operational in 2011
General Surgery Services All hospitals providing general surgical services Independent, stand-alone general surgery centres Ophthalmology Services All hospitals providing ophthalmology services Independent, stand-alone eye clinics or day surgery centre Maternity Services All hospitals providing maternity services.
All maternity homes
Public health clinics that conduct deliveries
Psychiatry Services All hospitals providing psychiatry services. All public psychiatric institutions
Stand alone psychiatric clinics
Oncology Services All hospitals providing basic oncology services
Table 2 Definition of Specialty Services
SERVICE DEFINITION REMARKS
General Surgical Services Services provided by permanent/ resident or visiting general surgeons with procedures performed within the establishment
● Include general, breast & endocrine, upper gastrointestinal, colorectal, vascular, hepatobilliary, trauma and thoracic surgeries
● Exclude paediatric, plastic, urology, neurosurgery and cardiothoracic surgeries
Ophthalmology Services Services provided by permanent/ resident or visiting ophthalmologist with procedures performed within the establishment
Obstetric Services Not specified
Psychiatry Services Services headed by a permanent/ resident psychiatrists
Oncology Services Services provided by permanent/ resident and visiting medical or clinical oncologists, surgeons or respiratory physicians with a special interest in oncology, including hospitals that deliver basic chemotherapies
Exclude services provided by haematologists and paediatric oncologists
Note: List of data definitions used in this survey are included in Appendix 1.
The total number of the establishments (included and excluded) in the study is summarised in Table 3.
Table 3 Summary of Total Number of Healthcare Establishment by Category
HOSPITALS BY SECTOR CATEGORY OF HEALTHCARE ESTABLISHMENT TOTAL NUMBER
IN THE POPULATION
NUMBER OF HOSPITALS INCLUDED IN THE STUDY
Public Acute Curative Hospitals Ministry of Health 131 131
University 3 3
Aboriginals 1 0
Psychiatric Institutions 4 4
Private Acute Curative Hospitals (General) 124 124
Single Specialty 11 11
Maternity Homes 70 70
Survey Structure
NHEWS 2011 comprised one main and 5 sub-surveys (Figure 2). The Acute Curative Hospitals survey was the main survey that provided the population framework. Maternity homes and psychiatric institutions were included only for the specific service surveys. General Surgical, Ophthalmology and Oncology surveys were conducted using a specific subset of the total hospital population that provides for the specific services.
Figure 2 NHEWS (Hospital) 2011 Survey Structure
Case Report Form (CRF) Development and Pilot Testing
The CRF was developed by the NHEWS project team with input from the respective NHEWS expert panels. Separate sets of CRFs were developed for the public and private sector because of their different practices and administrative structures.
Variables were grouped by sections based on their establishment details, facilities, activities and services, workforce and medical device. Two different types of CRF were developed, Printed and Online. English and Malay versions of the CRF were available for the main hospital survey. However, only the English version of CRF was used for the specialty services survey. This is to cater for the English literacy among the respondents for the specialty services; they were most likely to be doctors or nurses and they would not have problems understanding the the CRF in English.
Definitions of services were stated at the beginning of the general surgery, ophthalmology and oncology survey forms to ensure a more accurate and consistent response since these services are generally poorly defined.
Suitable respondents for certain specialty services were selected from the responding establishment to improve on the reliability of the data. These included obstetrics, general surgery and psychiatry service survey. This was based on our experiences from the two previous cycles where, general support staff had shown difficulty in understanding the survey content and providing reliable answers.
Additional feature of historical consistency references was available for respondents who submitted an online CRF upon request. This was designed to assist in the consistency of data.
A process of verification was incorporated into the CRF: Information on the person who coordinates or completes the survey was first obtained. This was followed by a verification of the information by the CEO or the relevant Department heads and with their signature incorporated.
Specified text boxes were provided for each question on both of the survey forms. The online forms had incorporated automated validation rules that applied directly at time of data entry. No data could be submitted if it did not pass the validation rules. Units of certain answers (e.g. in days, %) were also specified. Answers marked “to be auto calculated” required no input from the respondent.
Lists of the definition of terms and specialty code (for workforce list) were provided at the end of each survey form, and arranged by sections.
The CRFs were pilot-tested with the Person-In-Charge (PIC) of the respective services. Revisions and improvements were then made to the form accordingly. Lists of definitions used in this survey are included in Appendix 1 of this report.
CRF Distribution
Induction of MOH hospitals was undertaken by briefing the hospital directors or representatives first.
The following documents were distributed to them and in their respective hospitals:
● Survey instruction manual
● An endorsement letter from the State Health Directors (for public hospital) or Association of Private Hospital Malaysia (APHM) ● Username and password access details for electronic CRF
● NHEWS 2010 hospital report
The induction session began with a presentation by a NHEWS hospital team member with a brief overview on the project and the aims of the survey. This was followed by a demonstration on how to fill in the paper and electronic CRFs. Hospitals that were not represented at the induction meeting were contacted and briefed later by phone and the survey instrument sets were delivered to them by post.
For private hospitals, the induction was done by sending a compilation of self-explanatory documents to the hospital’s highest authority e.g. CEO. An endorsement letter by the Association of Private Hospitals Malaysia (APHM) was attached. Follow-up calls were made to each private hospital to ensure the documents were received.
Data Collection
Respondents had the option to choose between two modes of data submission which included:
1. Paper data submission via hardcopy Case Report Form (Printed CRF) 2. Electronic data submission via web application (eCRF)
The processed datasets of the list of doctors for each hospital were pre-uploaded to the online eCRFs to minimize the need for manual data entry. These datasets were obtained from record matches on the doctor workforce from the previous year’s NHEWS survey against the databases of Malaysian Medical Council, National Specialist Register (NSR) and Medical Development Division (MDD). The edited list was then sent to the corresponding heads of services in the MOH or other related authorized personnel for verification.
Data Entry
Data from paper submissions were checked manually and reviewed for their completeness and logical consistency before data entry by trained members. Data entry through eCRF was submitted directly into the NHEWS database and monitored in real-time basis. Quality of data entry was constantly checked and maintained by several built-in features such as a compulsory data checking function, consistency checks, auto calculations and auto default data from the previous year’s survey. Activities performed in the database were recorded by a built-in tracking system. Historical consistency check was used for repeated variables.
Data Processing
Data cleaning was performed in parallel with data entry and based on the results of edit checks. An edit check is a checking procedure for tracing doubtful data being entered. The editing was performed by NHEWS team members who were familiar with hospital settings. Any queries were then attended to by contacting the data entry personnel or any authorised representative at the participant’s site to seek further clarification or verification.
Exploratory data analysis was performed before database locking to ensure that the data was acceptable for analysis. Data duplication, range and consistency checks were done to detect outliers and data that deviated; these procedures were undertaken with the source data providers. In cases where the data was not verifiable with the source, cross checks were done against other sources such as the Health Information Management System Reports, Malaysian Medical Council Doctor Database, professional societies, National Specialist Register and Registry Central Surveys.
Statistical and Estimation Procedures
NHEWS uses the census of all hospitals and related establishments from the Medical Development Division and the Private Healthcare Registration and Enforcement Unit (CKAPS) to derive its estimates of the total facility, devices, activity and workforce of related healthcare services within the country. As participation is voluntary, non-response was anticipated and two sources of non-response were accounted for:
Unit non-response – occured as a result of the healthcare establishment not responding to the survey. Item non-response – occured as some respondents returned partially completed survey forms.
A survey unit will be considered as non-response if the item non-response exceeds 50% of the total questions. Imputation techniques were used to account for item non-response and weighting for unit non-response.
Imputation: Estimating Item Non-Response
The imputation process consists of 2 stages. First, the missing values are imputed with reasonable assumptions (Logical/ Conditional Imputation). For example, hospitals without CT scans will have zero CT imaging performed. Similarly, it is assumed that centres without operating microscopes do not perform any cataract surgery.
The remaining missing values after logical and conditional imputation is further accessed for its suitability of other imputation techniques. Regression imputation is used in cases where the proportion of missing values is less than 5% of the total. One fundamental assumption of missing data imputation is that respondent and non-respondent share similar characteristics.
Weighting: Estimating Unit Non-Response
Estimates of the Total Number of the Device/ Activity/ Facility/ Workforce (T)
Where:
Ti is the number of device/ activity/ facility/ workforce available in the ith facility in the year,
Wi is the calculated weight of the ith facility
Limitation of the Estimating Procedures
NHEWS is a census survey because all in-scope Malaysian Hospitals and related healthcare establishments of study were given the survey forms. However, because response is not mandatory, there will be a significant level of “respondent-bias” in the data. Because of this non-random response in our survey, standard errors are not a suitable means of gauging variability.
The fundamental purpose of imputation and weighting is to adjust for bias in the responding units and produce estimates. However, these procedures can only account for and adjust to known population characteristics. If information for a variable is not known for the whole population, the adjustment process will not be possible.
Furthermore, as mentioned above, assumptions of the similarity of respondent and non-respondent in terms of their population characteristics is made when imputation and weighting is used to derive estimates. Thus, if the assumption is wrong i.e. non-respondents are different from respondents, then the estimates will have a certain degree of bias. The level of bias in the estimates will not be quantifiable without a further study of the non-respondents.
List of Formula
Facilities, devices, activities and workforce of related healthcare establishment and services are expressed as an absolute count by state, sector and year.
Turnover interval (TOI) is calculated as:
Where:
B is number of inpatient beds
N is number of inpatient admissions
ALOS is average length of stay
The densities of hospitals and respective healthcare services are calculated as follows:
Number of hospitals and healthcare services details/ 10,000 population =
Number of hospitals and healthcare services details/ million population =
Where:
T is an estimate of the total quantity of the variable available in the country in the year under consideration.
For maternity services:
Number of hospitals and healthcare services details/ 10,000 female population =
Where:
T is an estimate of the total quantity of the variable available in the country in the year under consideration.
P is the midyear female population of Malaysia or the relevant geographic region where the survey was conducted.
Number of hospitals and specialist services details/ 100 deliveries =
Number of hospitals and specialist services details/ 1,000 deliveries =
Where:
T is an estimate of the total quantity of the variable available in the country in the year under consideration.
P is the total obstetric deliveries of Malaysia or the relevant geographic region where the survey was conducted.
Details of the Malaysian population statistics for 2011 by state are available in Appendix 3.
Data-Set Finalisation and Locking
All processed data were reviewed by the project team and all members of the expert panel to ensure validity and accuracy before the finalization. The decision to lock the data-set was made by the project team only after the finalization. No further amendments to the data-set were allowed except for errors supported by valid evidence as determined by the project team and/or expert panel. All amendments of data-set, if any, must be approved by the co-investigator(s).
Data Security
The NHEWS hospital data collection was authorized under the Private Healthcare Facilities and Services Act 1998. However, participation was voluntary. Data collected in the NHEWS survey is regulated by the Personal Data Protection Act 2010 where applicable. All information collected is held in the strictest confidence and according to legal and research ethics guidelines.
Data Quality
CONSORT DIAGRAM NHEWS 2011 (ACUTE CURATIVE HOSPITALS
(a))
Total number of hospitals in Malaysia
n = 353
n = 349
Analysis 1. Establishments ceased operations = 2
a. Multimedic Specialist & Maternity Centre b. Hope Children Hospital – Farlim 2. Establishment changed from Hospital
to Maternity Home =2 a. Pusat Rawatan Mahsuri b. Klinik Wanita Nara
Losses (Closed premise), n = 4
1. Chronic (curative) care(b), n = 2 a. Columbia Asia Extended
Care Hospital – Shah Alam b. Pudu Specialists Centre 2. Fertility centre = 1
a. TMC Women’s Specialist (Kuantan) Sdn. Bhd.
i. Rajah Charles Brooke Memorial Hospital b. Psychiatry, n = 4
i. Hospital Mesra Bukit Padang ii. Hospital Bahagia Ulu Kinta iii. Hospital Permai
(a) Acute Curative Hospital
ALOS<10 days
(b) Chronic Curative Hospital ALOS≥10 days
Note: List of new hospitals in 2011, n = 8:
Ministry of Health
CONSORT DIAGRAM NHEWS 2011 (MATERNITY SERVICES)
Ministry of Health & University
Hospital
Included Included Included Included
Private
Total In-scope Establishment with Maternity Services
n = 119
Hospital
Establishments closed operations a. Asia Maternity Homes
1. Zero beds
a. Joe Medical Centre - Pandan Jaya b. Joe Medical Centre - Pandan Indah Status changed from hospital to
maternity homes
a. Pusat Rawatan Mahsuri b. Klinik Wanita Nara
Establisments ceased operations
a. Multimedic Specialist & Maternity Centre
No admissions
a. Helen Ngu Women Hospital
Losses, n = 1
List of new private hospitals with maternity services in 2011, n = 2:
1. Pusat Perubatan UniKL-RCMP
2. Darul Makmur Medical Centre
List of new maternity centre in 2011, n = 1:
CONSORT DIAGRAM NHEWS 2011 (GENERAL SURGERY SERVICES)
NHEWS 2011 (General Surgery Services)
n = 169
n = 109
Provide only consultation a) Klinik Bersalin Yasmin b) Sentul Medical Centre c) Hospital Pusrawi SMC
n = 106
n = 60
n = 166
Analysis
Private
Excluded, n = 3
Included
Public
Total In-scope Establishment with General Surgery Services
n = 7
n = 7
MOH Non-Specialist Hospital
n = 50
n = 50
n = 3
n = 3
MOH Specialist Hospital
University Hospital
Included Included Included
CONSORT DIAGRAM NHEWS 2011 (ONCOLOGY SERVICES)
NHEWS 2011 (Oncology Services)
n = 58
n = 27 n = 31
n = 58
Analysis
Private Public
Total In-scope Establishment with Oncology Services
n = 3 n = 28
MOH Specialist Hospital
n = 28 n = 3
Included Included
n = 27
Included
University Hospital
Note:
List of hospitals included in 2011 survey but not in 2010 survey due to the difference in the definition of inclusion criteria, n = 3:
1. Hospital Sandakan
2. Hospital Tawau
3. Hospital Selayang
CONSORT DIAGRAM NHEWS 2011 (PSYCHIATRY SERVICES)
NHEWS 2011 (Psychiatry Services)
n = 94
n = 45
n = 45
n = 49
n = 94
Analysis
Private
Included
Public
Total In-scope Establishment with Psychiatry Services
n = 4
n = 4 n = 3
n = 3
MOH Psychiatry Institution
Included University
Hospital
Included
n = 42
n = 42
Acute Curative Psychiatry Hospital
Included Hospital
CONSORT DIAGRAM NHEWS 2011 (OPHTHALMOLOGY SERVICES)
NHEWS 2011 (Ophthalmology Services)
n = 102
n = 63
Provide only consultation a) Perdana Specialist Hospital b) Kota Bharu Medical Centre c) Columbia Asia Nusajaya d) Kuantan Clinical Diagnostic n = 59
n = 39
n = 98
Analysis
Private
Excluded, n = 3
Included Specialist Hospital
Public
Total In-scope Establishment with Ophthalmology Services
n = 36 n = 3
MOH Specialist Hospital
University Hospital
(a)
n = 3 n = 36
Included Included
(a) Have visiting ophthalmologist for consultation, but all the procedures to be carried out are referred to hospitals or clinics.
ABBREVIATIONS
ALOS Average Length of Stay
AMO Assistant Medical Officer
APHM Association of Private Hospitals Malaysia
BER Beyond Economic Repair
BOR Bed Occupancy Rate
CDR Cytotoxic Drug Reconstitution
CEO Chief Executive Officer
CKAPS Cawangan Kawalan Amalan Perubatan Swasta
CRF Case Report Form
CS Caesarean Section
CT Computed Tomography
DOS Department of Statistics
eCRF Electronic Case Report Form
ECT Electroconvulsive Therapy
IPH Institute for Public Health
LA Local Anaesthesia
LDR Low Dose Radiation
LSCS Lower Segment Caesarean Section
MDD Medical Development Division
MMA Malaysian Medical Association
MMC Malaysian Medical Council
MREC MOH Medical Research and Ethics Committee
MRG Malaysian Research Grant
MRI Magnetic Resonance Imaging
NHEWS National Healthcare Establishment and Workforce Survey
NHSI National Healthcare Statistics Initiative
NICU Neonatal Intensive Care Unit
NIH National Institute of Health
NMRR National Medical Research Register
NRIG National Radiotherapy Implementation Group
O&G Obstetrics and Gynaecology
OECD Organisation For Economic Co-operation and Development
OGDS Oesophagogastroduodenoscopy
OR Operating Room
OT Operating Theatre
PET Positron Emission Tomography
PMP Per Million Population
PMPCS Private Medical Practice Control Section
PPH Post Partum Haemorrhage
QA Quality Assurance
RT Radiotherapy
SCN Special Care Nursery
SDP Source Data Provider
SRS Stereotactic Radiotherapy
SVD Spontaneous Vertex Delivery
TOI Turn Over Interval
UK United Kingdom
WP Wilayah Persekutuan
WPKL Wilayah Persekutuan Kuala Lumpur
SYMBOLS
na not applicable
1
Over
view on Hospitals and Specialists Ser
vices in Mala
ysia
CHAPTER 1
|
OVERVIEW OF HOSPITALS AND SPECIALISTS SERVICES IN MALAYSIA
Sivasampu S1*, Foo CY1, Tahrani PK1,Arunah C1, Kamilah D1, Fatihah M1, Faizah A1 1. National Clinical Research Centre, Ministry of Health
* Corresponding author.
Our third NHEWS report aims to provide consistent and reliable data on healthcare establishments, activities, selected devices and the workforce in the country. In addition, it was to show the trends in those activities. This report consists of six chapters. The first chapter covers the overall statistics on the acute curative hospitals. The other chapters examine the specific healthcare services:
● Chapter 2 : Acute curative hospital establishment survey
● Chapter 3 : Maternity services survey
● Chapter 4 : General surgical services survey
● Chapter 5 : Oncology services survey
● Chapter 6 : Psychiatry services survey
● Chapter 7 : Ophthalmology services survey
Improved methods of data collection and in project management have contributed to better data quality and response rates. Here is the summary of those changes:
● Development of different and separate Case Report Forms (CRFs) for public and private establishments to accommodate their different practices and
administrative requirements
● Specified definition of each service to avoid ambiguity of inclusion and exclusion criteria
● Suitable respondents were suggested for both private and public sector for more reliable data collection e.g. the operating theatre manager was
identified as the suitable respondent for the surgical chapter.
● Incorporated two levels of data verification process to improve accuracy of data:
m First level – verified by Hospital Director/ Department Heads before submission
m Second level – verified with the relevant personnel of the responding establishment during the review process after submission
● Enhancing electronic data validation for online data submissions
● Redefining channels of distributing survey forms to facilitate the process of reaching the appropriate personnel and to shorten the response and submission times
● Enabling historical consistency checks for repeated variables. Any inconsistent data was verified with source personnel and corrected accordingly.
Summary of response rate by chapter:
NO. SERVICE SURVEY SURVEY POPULATION (N) RESPONSE RATE (%)
1 Acute Curative Hospital 339 77.9%
2 Maternity Service 317 81.4%
3 General Surgery Service 166 85.4%
4 Oncology Service 58 100.0%
5 Psychiatry Service 94 95.7%
6 Ophthalmology Service 98 91.8%
Note: Details of item and unit non-response by chapter are available in Appendix 5.
Here we summarise our key findings of this report:
Acute Curative Hospital Survey
● Overall, 51,076 bed facilities were available in 339 acute curative hospitals; the majority of them were public hospitals (73%).
● The hospital admission rates have increased by 8% for both sectors in 2011. The mean bed occupancy rate (BOR) for private hospitals (41.9%) was lower than that of public hospitals (59.6%).
● Of the hospital healthcare workforces, most doctors (78%), staff nurses (72.4%) and assistant medical officers (AMO) (98.8%) worked in the public hospitals.
● The use of Computed Tomography (CT) scanners, Magnetic Resonance Imaging (MRIs) and Positron Emission Tomography (PET) scanners increased by 14%, 15% and 22% respectively in 2011.
● The number of medical doctors has increased over the past 3 years (2009-2011).
Maternity Services Survey
● Three hundred and seventeen hospitals and 26 maternity homes provided maternity services in 2011. These included 130 Ministry of Health (MOH)
hospitals, 3 public University Hospitals and 184 private hospitals.
● Eighty per cent of deliveries were conducted in public hospitals. The Caesarean section rate in private hospitals (34.7%) was almost twice that of the
public hospitals (19.7%).
● The instrumental delivery rate in the public hospitals (3.2 per 100 deliveries) was less than that in the private hospitals (14.85 per 100 deliveries).
● There were 839 obstetricians and gynaecologists (O&G) of whom 327 (39%) worked in the public sector and 512 (61%) in the private sector.
● The ratio of midwifery-trained nurse to delivery beds in specialist hospitals was 1.6 to 1 per shift.
General Surgical Services Survey
● The majority (64%) of hospitals providing general surgical services were from the private sector (n=106).
● There was a marked increase in the number of mastectomies done (18.6%, n=662) over the two years. The private sector reported an increase of
1,414 to 1,993 (41%) over the 2 year period.
● There was an increased preference for laparoscopic inguinal hernia surgery (11.8%) and laparoscopic cholecystectomy (7.3%) over the same period
of time.
● In 2011, there were 557 general surgeons, 298 in the public and 259 in the private sector. When compared to 2010, there was an increase of 21
surgeons (3.9%) all of whom came from the private sector.
Oncology Services Survey
● There were 58 hospitals providing oncology services in 2011, with a density of 0.02 per 10,000 population
● Only 4 hospitals provided data on selected oncology activities, e.g. chemotherapy and radiotherapy with curative intent (please refer to relevant chapter).
● A total of 67 oncologists were providing services in the country for 2011, with 68% of them serving in the West Coast of Peninsular Malaysia.
● Core oncology devices including 29 simulators, 36 megavoltage machines and 14 brachytherapy machines were available within the country in 2011.
Psychiatry Services Survey
● Twenty percent of hospitals in Malaysia provided psychiatric services of which, 49 were public and 45 were private hospitals.
● The majority of the psychiatric services were carried out in the public hospitals; public hospitals providing 88.7% of out-patient care and 97.1% of the in-patient care.
● Most psychiatrists (79.5%, n=186) were employed by the public sector.
● The availability of allied health personnel in psychiatry was low and limited to few centres.
● Overall inpatient and outpatient electroconvulsive therapy (ECT) had decreased to 14% and 1% respectively for 2011 when compared to 2010.
Ophthalmology Services Survey
● Thirty-six MOH, three Universities, and 59 private hospitals provided ophthalmology services in Malaysia with the Klang Valley and Melaka having the highest density.
● Fifty-two per cent of the cataract surgeries were performed as day care and 48% as inpatient. The majority (70%) of them being done in the public sector.
● Most of the vitreoretinal surgeries were performed in public hospitals.
● The ratio of ophthalmologist to population was 1 to 76,923 for 2011.
● The private sector had a higher number of ophthalmological devices with the exception of stand-alone vitrectomy and automated perimetry devices.
In our appendices, we have also included the number of specialists available in the various specialties and subspecialties other than the 5 fields mentioned above (Appendices 6 and 7).
1
Over
view on Hospitals and Specialists Ser
vices in Mala
CHAPTER 2
|
ACUTE CURATIVE HOSPITAL SERVICES IN MALAYSIA
Sivasampu S1*, Fatihah M1*, Akma NY2, Laili MM2, Khalid I3, Siti ZS4, Juita5, Farique5, Rosena O6
1. National Clinical Research Centre, Ministry of Health 2. Medical Development Division, Ministry of Health 3. Hospital Sungai Buloh, 4. Hospital Selayang 5. Hospital Sultanah Bahiyah, Alor Setar, 6. Nursing Division, Ministry of Health
* Corresponding author.
Summary: This chapter highlights several issues with regards to hospital efficiency in terms of the underutilisation and/ or overutilization of hospital beds, especially in the public hospitals. This is the first time such information on functioning beds is available from both, the public and private hospitals. Surprisingly, the private specialist hospitals reported low bed occupancy rates in 2011. With an increasing number of medical doctors in the public hospitals, there is a need to redistribute them, taking into account the hospital workload (BOR, admission to doctor ratio) and the hospital type (specialists or non specialists’ hospitals). This chapter also demonstrates the maldistribution of human resources in the public sector both, at national and state levels, especially those of nurses and assistant medical officers (AMOs) with post basic training. Furthermore, the proper allocation of medical devices such as PET scanners need to be looked into since an increase in the use of these devices has been seen over the past three years.
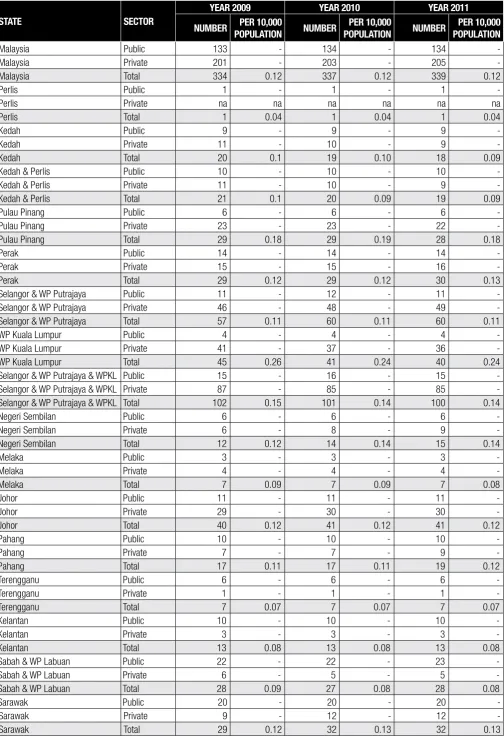
There were 339 acute curative hospitals in 2011, of which 134 were public and 205 were private hospitals. (Table 2.1) There were 8 new acute curative hospitals in 2011, but only one was public – the Hospital Queen Elizabeth II (HQEII), a 291-bedded hospital in Sabah. During the same period, two existing private hospitals were closed and another two more had changed their status from hospital to maternity homes. The hospital designated for the aborigines and one private hospital with average length of stay (ALOS) of more than 10 days were excluded from this year’s analysis. This raised the total number of private hospitals from 203 in 2010 to 205 in 2011 (Table 2.1).
The response rate increased from 75% in 2010 to 78%in 2011. The endorsement given by Association of Private Hospitals of Malaysia (APHM) may have contributed to this increase from the private sector (from 59% to 64%). Many of the non respondents (36.6%) were private maternity centres.
We have categorised the hospitals into three main types (Table 2.2), namely:
• Non specialist hospitals
These are hospitals without resident/ permanent specialists. They were seen mainly in the public sector. There was only one hospital in the private sector that fell into this category.
• Specialisthospitals
These are hospitals that provide secondary and tertiary care (Appendix 1) and also those who provide services for specific disciplines e.g. the National Heart Institute and the Tun Hussein Onn Eye Hospitals from the private sector and the Institute of Respiratory Medicine from the public sector.
• Maternity centres are centres that provide obstetric or delivery services. They were all in the private sector.
In this report, entrepreneurship refers to ownership of the hospitals (Table 2.3). Most of the private hospitals were incorporated as corporate bodies (84.9%) followed by sole proprietorship (12.7%), partnership (1.5%) and societies (1.0%).
Facilities
There were 51,076 inpatient beds in all acute curative hospitals, of which 73% (37,493 beds) were in the public hospitals. A new term of “functioning bed” was introduced in the present report to address the issue of inpatient beds being non-functioning. Without a precise definition of `functioning beds’, assessing the bed occupancy rate (BOR) may be an issue because, a hospital with high non-functioning bed may have a misleadingly low BOR despite actually being crowded. Based on this new definition, we found that only 74% of the beds in public hospitals were reported as `functioning’ (35,415 beds). In contrast, 90 per cent (12,273 beds) of the private hospital beds were functioning (Table 2.4).
In 2011, there were 575 operating rooms in public hospitals of which, 511 were functioning (88.9%). These were mostly concentrated in Wilayah Persekutuan Kuala Lumpur (WPKL) and with a density of 0.5 per 10,000 population (Table 2.5).
2
ACUTE CURA
TIVE HOSPIT
AL SERVICES IN MALA
Activities
The majority (67.9%) of admissions were to the public hospitals. The ratio of the number of admissions to doctors in public hospitals was 181.9 per doctor per year as compared to 316.4 admissions per doctor per year in the private hospitals (Table 2.6). The overall ALOS in 2011 was 3.3 days in the public hospitals and 2.4 days in the private hospitals (Table 2.7). The ALOS for non specialists and specialists’ public hospitals was 2.82 and 3.88 respectively (Table 2.8).
The mean BOR of the public hospitals had increased from 56.2% to 59.6% over three years. Further analysis showed that the mean BOR of the public specialist hospitals was 70.7% when compared to 50.0% for the non specialists public hospitals (Table 2.9). This shows that the demand for specialists care has increased (Table 2.9). We feel that underutilisation of non specialist hospitals needs to be addressed. In contrast, the mean BOR of the private sector has decreased from 46.6 to 41.9% over the three years. The mean BOR for the private specialist hospitals was 52.0% and it was 22.9% for the maternity centres.
The mean turn over interval (TOI) for public hospitals was 3.4 days in non specialist hospitals and 2 days in specialist hospitals. Melaka had the lowest TOI with 0.68 days followed by Terengganu 0.74 days and Kedah 0.94. (Table 2.10)
Health Workforce
There were 16,643 doctors serving in all the hospitals in 2011; a density of 5.8 doctors per 10,000 populations (Table 2.11). Of the total, 12,966 (79%) were employed in the public hospitals. For the purposes of this report, medical doctors include hospital clinical specialists and medical officers only.
There were 58,780 hospital staff nurses, of which 42,548 were in the public and 16,232 in the private sector. The highest density of staff nurses with or without post basic training was seen in WPKL (Table 2.11). Out of 18,215 staff nurse with post basic training, 16.2 % were employed in WPKL (Table 2.11) .
There were 8,712 community nurses working in hospitals in 2011, of which 8,474 (97.3 %) were employed by the public hospitals. However, most (85.3 %) of the 3,091 assistant nurses worked in the private hospitals. The MOH is in the process of phasing out the assistant nurses in the public sector. At the same time, it is upgrading the training of community nurses to staff nurses (Table 2.12).
There were 6,064 assistant medical officers (AMOs) (with and without post basic training) working in hospitals in 2011. Most were employed by the public hospitals (Table 2.13).
There were 2,654 pharmacists in 2011 of which 90% were in the public sector. Of the 845 physiotherapist employed, 63% were in the public sector. Of the 643 occupational therapist employed, 94% were in the public sector and of the 271 dieticians, 70% were in the public sector (Table 2.14). However, of the 473 medical record officers 57% worked in the private sector. By comparison, only 21 medical social officers (9%) worked in private sector (Table 2.15).
Medical Devices and Procedures
Over the past three years, the number of Computed Tomography (CT) Scanners and Magnetic Resonance imaging (MRIs) in the country has decreased by 1.4% (Table 2.16 and Table 2.17). But the number of Positron Emission Tomography (PET) scanners available has remained constant since 2009 (Table 2.18).
Limitations
1. The BOR and TOI of some private hospitals, especially the maternity centres, may have been under-reported because, the number of admissions was unrealistically low. This may have skewed some of the overall state figures. The NHEWS team has made attempts to query such data. Corrections and resubmissions have been made to those who have responded. However the data cannot be corrected for the non-responders.
2. In this survey, hospital units of special institution e.g. prison hospitals, military hospitals and hospitals operated by NGOs were excluded. We felt it was justified because of their unique nature of practice and the kind of patients being served.
Table 2.1 Number and Density of Hospitals Providing Acute Curative Care Services in Malaysia by State and Sector, 2009 – 2011
STATE SECTOR
YEAR 2009 YEAR 2010 YEAR 2011
NUMBER PER 10,000
Malaysia Private 201 - 203 - 205
-Malaysia Total 334 0.12 337 0.12 339 0.12
Perlis Public 1 - 1 - 1
-Perlis Private na na na na na na
Perlis Total 1 0.04 1 0.04 1 0.04
Kedah Public 9 - 9 - 9
-Kedah Private 11 - 10 - 9
-Kedah Total 20 0.1 19 0.10 18 0.09
Kedah & Perlis Public 10 - 10 - 10
-Kedah & Perlis Private 11 - 10 - 9
-Kedah & Perlis Total 21 0.1 20 0.09 19 0.09
Pulau Pinang Public 6 - 6 - 6
-Pulau Pinang Private 23 - 23 - 22
-Pulau Pinang Total 29 0.18 29 0.19 28 0.18
Perak Public 14 - 14 - 14
-Perak Private 15 - 15 - 16
-Perak Total 29 0.12 29 0.12 30 0.13
Selangor & WP Putrajaya Public 11 - 12 - 11
-Selangor & WP Putrajaya Private 46 - 48 - 49
-Selangor & WP Putrajaya Total 57 0.11 60 0.11 60 0.11
WP Kuala Lumpur Public 4 - 4 - 4
-WP Kuala Lumpur Private 41 - 37 - 36
-WP Kuala Lumpur Total 45 0.26 41 0.24 40 0.24
Selangor & WP Putrajaya & WPKL Public 15 - 16 - 15
-Selangor & WP Putrajaya & WPKL Private 87 - 85 - 85
-Selangor & WP Putrajaya & WPKL Total 102 0.15 101 0.14 100 0.14
Negeri Sembilan Public 6 - 6 - 6
-Negeri Sembilan Private 6 - 8 - 9
-Negeri Sembilan Total 12 0.12 14 0.14 15 0.14
Melaka Public 3 - 3 - 3
-Melaka Private 4 - 4 - 4
-Melaka Total 7 0.09 7 0.09 7 0.08
Johor Public 11 - 11 - 11
-Johor Private 29 - 30 - 30
-Johor Total 40 0.12 41 0.12 41 0.12
Pahang Public 10 - 10 - 10
-Pahang Private 7 - 7 - 9
-Pahang Total 17 0.11 17 0.11 19 0.12
Terengganu Public 6 - 6 - 6
-Terengganu Private 1 - 1 - 1
-Terengganu Total 7 0.07 7 0.07 7 0.07
Kelantan Public 10 - 10 - 10
-Kelantan Private 3 - 3 - 3
-Kelantan Total 13 0.08 13 0.08 13 0.08
Sabah & WP Labuan Public 22 - 22 - 23
-Sabah & WP Labuan Private 6 - 5 - 5
-Sabah & WP Labuan Total 28 0.09 27 0.08 28 0.08
Sarawak Public 20 - 20 - 20
-Sarawak Private 9 - 12 - 12
-Sarawak Total 29 0.12 32 0.13 32 0.13
Abbreviation: na – not applicable; - – not available 2
ACUTE CURA
TIVE HOSPIT
AL SERVICES IN MALA
Table 2.2 Number and Density of Types of Hospitals Establishment Providing Acute Curative Care Services in Malaysia by State & Sector, 2011
Malaysia Total 73 0.03 52 0.02 132 0.05 12 0.00 70 0.02
Perlis Public 0 - 1 - 0 - 0 - 0
-Selangor & WP Putrajaya Total 3 0.01 13 0.02 27 0.05 2 0.00 15 0.03
WP Kuala Lumpur Public 0 - 1 - 2 - 1 - 0
-WP Kuala Lumpur Private 0 - 9 - 10 - 4 - 13
-WP Kuala Lumpur Total 0 0.00 10 0.06 12 0.07 5 0.03 13 0.08
Selangor & WP Putrajaya & WPKL Public 3 - 2 - 9 - 1 - 0
-Selangor & WP Putrajaya & WPKL Private 0 - 21 - 30 - 6 - 28
-Selangor & WP Putrajaya & WPKL Total 3 0.00 23 0.03 39 0.05 7 0.01 28 0.04
Negeri Sembilan Public 3 - 1 - 2 - 0 - 0
-Negeri Sembilan Private 0 - 1 - 6 - 0 - 2
-Negeri Sembilan Total 3 0.03 2 0.02 8 0.08 0 0.00 2 0.02
Melaka Public 2 - 1 - 0 - 0 - 0
Table 2.3 Number and Density of Different Types of Private Hospital’s Entrepreneurship in Malaysia by State, 2011
STATE
NUMBER OF HOSPITALS IN PRIVATE SECTOR
SOLE PROPRIETOR PARTNERSHIP CORPORATE BODY SOCIETY
NO. % NO. % NO. % NO. %
Malaysia 205 26 12.68 3 1.46 174 84.88 2 0.98
Perlis 0 0 - 0 - 0 - 0
-Kedah 9 0 0.00 0 0.00 9 100.00 0 0.00
Kedah & Perlis 9 0 0.00 0 0.00 9 100.00 0 0.00
Pulau Pinang 22 2 9.09 0 0.00 19 86.36 1 4.55
Perak 16 2 12.50 0 0.00 14 87.50 0 0.00
Selangor & WP Putrajaya 49 7 14.29 0 0.00 42 85.71 0 0.00
WP Kuala Lumpur 36 4 11.11 2 5.56 29 80.56 1 2.78
Selangor & WP Putrajaya & WPKL 85 11 12.94 2 2.35 71 83.53 1 1.18
Negeri Sembilan 9 0 0.00 0 0.00 9 100.00 0 0.00
Melaka 4 0 0.00 0 0.00 4 100.00 0 0.00
Johor 30 4 13.33 0 0.00 26 86.67 0 0.00
Pahang 9 4 44.44 1 11.11 4 44.44 0 0.00
Terengganu 1 0 0.00 0 0.00 1 100.00 0 0.00
Kelantan 3 0 0.00 0 0.00 3 100.00 0 0.00
Sabah & WP Labuan 5 0 0.00 0 0.00 5 100.00 0 0.00
Sarawak 12 3 25.00 0 0.00 9 75.00 0 0.00
Abbreviation: - – not available
2
ACUTE CURA
TIVE HOSPIT
AL SERVICES IN MALA
Table 2.4 Number and Density of Inpatient Beds in Acute Curative Hospital in Malaysia by State and Sector, 2010 and 2011
STATE SECTOR
2010 2011
TOTAL INPATIENT BEDS TOTAL INPATIENT BEDS FUNCTIONING
INPATIENT BEDS
Malaysia Public 36,256 - 37,493 - 35,415
-Malaysia Private 12,605 - 13,583 - 12,273
-Malaysia Total 48,861 17.24 51,076 17.63 47,688 16.46
Perlis Public 404 - 404 - 390
-Perlis Private na na na na na na
Perlis Total 404 17.45 404 17.01 390 16.42
Kedah Public 2,350 - 2,390 - 2,294
-Kedah Private 542 - 535 - 530
-Kedah Total 2,892 14.85 2,925 14.82 2,824 14.31
Kedah & Perlis Public 2,754 - 2,794 - 2,684
-Kedah & Perlis Private 542 - 535 - 530
-Kedah & Perlis Total 3,296 15.12 3,329 15.06 3,214 14.54
Pulau Pinang Public 1,939 - 1,947 - 1,947
-Pulau Pinang Private 2,135 - 2,147 - 2,041
-Pulau Pinang Total 4,074 26.09 4,094 25.69 3,988 25.03
Perak Public 3,470 - 3,580 - 3,324
-Perak Private 988 - 974 - 894
-Perak Total 4,458 18.95 4,554 18.99 4,218 17.59
Selangor & WP Putrajaya Public 4,797 - 4,877 - 4,391
-Selangor & WP Putrajaya Private 2,836 - 3,282 - 2,962
-Selangor & WP Putrajaya Total 7,633 13.79 8,159 14.43 7,353 13.01
WP Kuala Lumpur Public 4,137 - 4,651 - 4,075
-WP Kuala Lumpur Private 2,859 - 2,915 - 2,454
-WP Kuala Lumpur Total 6,996 41.78 7,566 44.65 6,529 38.53
Selangor & WP Putrajaya & WPKL Public 8,934 - 9,528 - 8,466
-Selangor & WP Putrajaya & WPKL Private 5,695 - 6,197 - 5,416
-Selangor & WP Putrajaya & WPKL Total 14,629 20.29 15,725 21.40 13,882 18.89
Negeri Sembilan Public 1,527 - 1,527 - 1,513
-Negeri Sembilan Private 428 - 512 - 510
-Negeri Sembilan Total 1,955 19.15 2,039 19.55 2,023 19.40
Melaka Public 1,006 - 1,006 - 1,006
-Melaka Private 690 - 813 - 686
-Melaka Total 1,696 20.66 1,819 21.84 1,692 20.31
Johor Public 3,609 - 3,634 - 3,578
-Johor Private 1,111 - 1,126 - 1,041
-Johor Total 4,720 14.10 4,760 13.99 4,619 13.58
Pahang Public 1,907 - 2,030 - 1,962
-Pahang Private 204 - 326 - 324
-Pahang Total 2,111 14.07 2,356 15.45 2,286 14.99
Terengganu Public 1,342 - 1,342 - 1,342
-Terengganu Private 20 - 33 - 33
-Terengganu Total 1,362 13.15 1,375 12.80 1,375 12.80
Kelantan Public 2,399 - 2,399 - 2,399
-Kelantan Private 162 - 162 - 162
-Kelantan Total 2,561 16.63 2,561 15.86 2,561 15.86
Sabah & WP Labuan Public 3,962 - 4,253 - 3,884
-Sabah & WP Labuan Private 165 - 269 - 173
-Sabah & WP Labuan Total 4,127 12.53 4,522 13.28 4,057 11.91
Sarawak Public 3,407 - 3,453 - 3,310
-Sarawak Private 465 - 489 - 463
-Sarawak Total 3,872 15.67 3,942 15.67 3,773 14.99
Table 2.5 Number and Density of Operating theatre (OT), Operating Rooms (OR) and Functioning Operating Rooms (OR) in Acute Curative Public Hospitals in Malaysia by State 2011
STATE
OPERATING THEATRE (OT) OPERATING ROOMS (OR) FUNCTIONING OPERATING
ROOMS (OR)
NUMBER PER 10,000
POPULATION NUMBER
PER 10,000
POPULATION NUMBER
PER 10,000 POPULATION
Malaysia 178 0.06 575 0.20 511 0.18
Perlis 1 0.04 5 0.21 5 0.21
Kedah 12 0.06 39 0.20 29 0.15
Kedah & Perlis 13 0.06 44 0.20 34 0.15
Pulau Pinang 7 0.04 28 0.18 26 0.16
Perak 19 0.08 37 0.15 31 0.13
Selangor & WP Putrajaya 18 0.03 105 0.19 99 0.18
WP Kuala Lumpur 12 0.07 85 0.50 78 0.46
Selangor & WP Putrajaya & WPKL 30 0.04 190 0.26 177 0.24
Negeri Sembilan 6 0.06 15 0.14 14 0.13
Melaka 4 0.05 13 0.16 12 0.14
Johor 13 0.04 47 0.14 39 0.11
Pahang 16 0.10 36 0.24 30 0.20
Terengganu 8 0.07 17 0.16 15 0.14
Kelantan 15 0.09 36 0.22 33 0.20
Sabah & WP Labuan 27 0.08 57 0.17 53 0.16
Sarawak 20 0.08 55 0.22 47 0.19
2
ACUTE CURA
TIVE HOSPIT
AL SERVICES IN MALA