FAKULTAS TEKNIK
UNIVERSITAS NEGERI YOGYAKARTA
LAB SHEET
Semester : 5 Data Mining Regresi 200 menit
No. : LST/PTI/PTI 222/01 Revisi : 01 Tgl. : 31-8-2009 Hal. 1 dari 3 hal.
Handaru Jati, Ph.D
Universitas Negeri Yogyakarta
[email protected]
1. Kompetensi
Mengenal dan memahami regresi dengan datamining.
2. Sub Kompetensi
Dapat membuat model perkiraan menggunakan regresi di dataamining.
3. Dasar Teori
Regresi
Regresi adalah teknik termudah untuk digunakan, tetapi juga mungkin paling kuat. Model ini bisa semudah satu variabel input dan satu variabel keluaran (disebut Scatter diagram di Excel, atau XYDiagram pada OpenOffice.org). Tentu saja juga bias lebih kompleks dari itu, termasuk puluhan variabel input. Akibatnya, model regresi cocok dengan pola umum yang sama. Ada sejumlah variabel independen, yang, apabila diambil bersama-sama, menghasilkan hasil - sebuah variabel dependen. Model regresi ini kemudian digunakan untuk memprediksi hasil dari variabel dependen yang tidak diketahui, mengingat nilai-nilai variabel
independen.
Building the data det for WEKA
To load data into WEKA, we have to put it into a format that will be understood. WEKA's preferred method for loading data is in the Attribute-Relation File Format (ARFF), where you can define the type of data being loaded, then supply the data itself. In the file, you define each column and what each column contains. In the case of the regression model, you are limited to a NUMERIC or a DATE column. Finally, you supply each row of data in a comma-delimited format. The ARFF file we'll be using with WEKA appears below. Notice in the rows of data that we've left out my house. Since we are creating the model, we cannot input my house into it since the selling price is unknown.
Listing 1. WEKA file format
@RELATION house
@ATTRIBUTE houseSize NUMERIC @ATTRIBUTE lotSize NUMERIC @ATTRIBUTE bedrooms NUMERIC @ATTRIBUTE granite NUMERIC @ATTRIBUTE bathroom NUMERIC @ATTRIBUTE sellingPrice NUMERIC
@DATA
3529,9191,6,0,0,205000 3247,10061,5,1,1,224900 4032,10150,5,0,1,197900 2397,14156,4,1,0,189900 2200,9600,4,0,1,195000 3536,19994,6,1,1,325000 2983,9365,5,0,1,230000
Loading the data into WEKA
Now that the data file has been created, it's time to create our regression model. Start WEKA, then choose the Explorer. You'll be taken to the Explorer screen, with the
Preprocess tab selected. Select the Open File button and select the ARFF file you created in the section above. After selecting the file, your WEKA Explorer should look similar to the screenshot in Figure 3.
In this view, WEKA allows you to review the data you're working with. In the left section of the Explorer window, it outlines all of the columns in your data (Attributes) and the number of rows of data supplied (Instances). By selecting each column, the right section of the Explorer window will also give you information about the data in that column of your data set. For example, by selecting the houseSize column in the left section (which should be selected by default), the right-section should change to show you additional statistical information about the column. It shows the maximum value in the data set for this column is 4,032 square feet, and the minimum is 2,200 square feet. The average size is 3,131 square feet, with a standard deviation of 655 square feet. (Standard deviation is a statistical measure of variance.) Finally, there's a visual way of examining the data, which you can see by clicking the Visualize All
button. Due to our limited number of rows in this data set, the visualization is not as powerful as it would be if there were more data points (in the hundreds, for example).
Creating the regression model with WEKA
To create the model, click on the Classify tab. The first step is to select the model we want to build, so WEKA knows how to work with the data, and how to create the appropriate model:
1. Click the Choose button, then expand the functions branch. 2. Select the LinearRegression leaf.
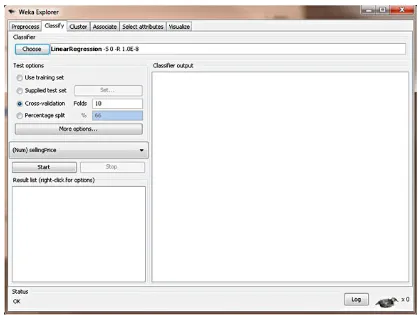
give you a good indication of how we are only touching the surface of this subject. Also of note: There is another choice called SimpleLinearRegression in the same branch. Do not choose this because simple regression only looks at one variable, and we have six. When you've selected the right model, your WEKA Explorer should look like Figure 4.
Figure 4. Linear regression model in WEKA
Now that the desired model has been chosen, we have to tell WEKA where the data is that it should use to build the model. Though it may be obvious to us that we want to use the data we supplied in the ARFF file, there are actually different options, some more advanced than what we'll be using. The other three choices are Supplied test set, where you can supply a different set of data to build the model; Cross-validation,
which lets WEKA build a model based on subsets of the supplied data and then average them out to create a final model; and Percentage split, where WEKA takes a percentile subset of the supplied data to build a final model. These other choices are useful with different models, which we'll see in future articles. With regression, we can simply choose Use training set. This tells WEKA that to build our desired model, we can simply use the data set we supplied in our ARFF file.
Finally, the last step to creating our model is to choose the dependent variable (the column we are looking to predict). We know this should be the selling price, since that's what we're trying to determine for my house. Right below the test options, there's a combo box that lets you choose the dependent variable. The column
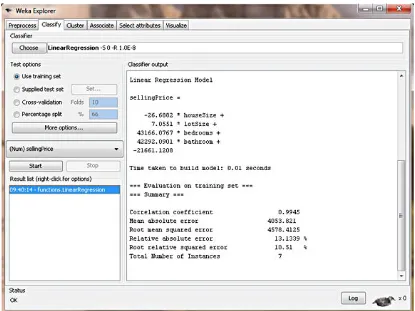
Now we are ready to create our model. Click Start. Figure 5 shows what the output should look like.
Figure 5. House price regression model in WEKA
Interpreting the regression model
WEKA doesn't mess around. It puts the regression model right there in the output, as shown in Listing 2.
Listing 2. Regression output
sellingPrice = (-26.6882 * houseSize) + (7.0551 * lotSize) + (43166.0767 * bedrooms) + (42292.0901 * bathroom) - 21661.1208
Listing 3 shows the results, plugging in the values for my house.
Listing 3. House value using regression model
(7.0551 * 9669) +
However, looking back to the top of the article, data mining isn't just about outputting a single number: It's about identifying patterns and rules. It's not strictly used to produce an absolute number but rather to create a model that lets you detect patterns, predict output, and come up with conclusions backed by the data. Let's take another step and interpret the patterns and conclusions that our model tells us, besides just a strict house value:
Granite doesn't matter — WEKA will only use columns that statistically contribute to the accuracy of the model (measured in R-squared, but beyond the scope of this article). It will throw out and ignore columns that don't help in creating a good model. So this regression model is telling us that granite in your kitchen doesn't affect the house's value.
Bathrooms do matter — Since we use a simple 0 or 1 value for an upgraded bathroom, we can use the coefficient from the regression model to determine the value of an upgraded bathroom on the house value. The model tells us it adds $42,292 to the house value.
Bigger houses reduce the value — WEKA is telling us that the bigger our house is, the lower the selling price? This can be seen by the negative coefficient in front of the houseSize variable. The model is telling us that every additional square foot of the house reduces its price by $26? That doesn't make any sense at all. This is America! Bigger is better, especially where I live in Texas. How should we interpret this? This is a good example of garbage in, garbage out. The house size, unfortunately, isn't an independent variable because it's related to the bedrooms variable, which makes sense, since bigger houses tend to have more bedrooms. So our model isn't perfect. But we can fix this. Remember: On the Preprocess tab, you can remove columns from the data set. For your own practice, remove the houseSize column and create another model. How does it affect the price of my house? How does this new model make more sense? (My amended house value: $217,894).
To take this simple example to the next level, let's take a look at a data file that the WEKA Web site supplies to us as a regression example. Theoretically, this should be much more complex than our simple example with seven houses. This sample data file attempts to create a regression model to predict the miles per gallon (MPG) for a car based on several attributes of the car (this data is from 1970 to 1982, so keep that in mind). The model includes these possible attributes of the car: cylinders,
displacement, horsepower, weight, acceleration, model year, origin, and car make. Further, this data set has 398 rows of data and meets many of the statistical
To produce the regression model with this data set, you should follow the exact same steps you followed for the house data, so I won't repeat it. So go ahead and create the regression model. It should produce the output shown in Listing 4.
Listing 4. MPG data regression model
class (aka MPG) =
1.6184 * model=75,71,76,74,77,78,79,81,82,80 + 1.8307 * model=77,78,79,81,82,80 +
Expected Value = 15 mpg
Regression Model Output = 14.2 mpg

