1
OECD Economic Outlook, Volume 2017 Issue 1© OECD 2017
STATISTICAL ANNEX
This annex contains data on key economic series which provide a background to the
recent economic developments in the OECD area described in the main body of this report.
Data for 2017 to 2018 are OECD estimates and projections. Data in some of the tables have
been adjusted to conform to internationally agreed concepts and definitions in order to
make them more comparable across countries, as well as consistent with historical data
shown in other OECD publications. Regional aggregates are based on time-varying weights.
For details on aggregation, see
OECD Economic Outlook
Sources and Methods.
The OECD projection methods and underlying statistical concepts and sources are
described in detail in
OECD Economic Outlook
Sources and Methods (
www.oecd.org/eco/
sources-and-methods.htm
).
Corrigenda for the current and earlier issues, as applicable, can be found at
www.oecd.org/about/publishing/corrigenda.htm
.
The statistical data for Israel are supplied by and under the responsibility of the
relevant Israeli authorities. The use of such data by the OECD is without prejudice to the
status of the Golan Heights, East Jerusalem and Israeli settlements in the West Bank under
the terms of international law.
NOTE ON QUARTERLY PROJECTIONS
STATISTICAL ANNEX
OECD ECONOMIC OUTLOOK, VOLUME 2017 ISSUE 1 © OECD 2017 – PRELIMINARY VERSION
3
Additional information
2015 weights used for real GDP regional aggregates
OECD euro
area1 OECD World
OECD euro
area1 OECD World
Australia 2.1 1.0 Spain 11.7 3.1 1.4 Austria 3.1 0.8 0.4 Sweden 0.9 0.4 Belgium 3.7 1.0 0.5 Switzerland 1.0 0.5
Canada 3.0 1.4 Turkey 3.6 1.7
Chile 0.8 0.4 United Kingdom 5.2 2.4
Czech Republic 0.7 0.3 United States 34.4 16.0 Denmark 0.5 0.2 Euro area 100.0 26.4 12.3 Estonia 0.3 0.1 0.0 Total OECD 100.0 46.6 Finland 1.7 0.4 0.2
France 19.7 5.2 2.4 Non-OECD World
Germany 28.4 7.5 3.5
Greece 2.1 0.5 0.3 Argentina 1.5 0.8
Hungary 0.5 0.2 Brazil 5.4 2.9
Iceland 0.0 0.0 China 32.2 17.2
Ireland 2.3 0.6 0.3 Colombia 1.1 0.6
Israel 0.6 0.3 Costa Rica 0.1 0.1
Italy 16.4 4.3 2.0 India 13.0 7.0
Japan 9.9 4.6 Indonesia 4.7 2.5
Korea 3.4 1.6 Lithuania 0.1 0.1
Latvia 0.4 0.1 0.0 Russia 5.8 3.1 Luxembourg 0.4 0.1 0.1 Saudi Arabia 2.8 1.5
Mexico 4.1 1.9 South Africa 1.2 0.7
Netherlands 6.1 1.6 0.7 Dynamic Asian Economies 8.7 4.7 New Zealand 0.3 0.2 Other major oil producers 10.9 5.8 Norway 0.6 0.3 Rest of non-OECD 12.3 6.6
Poland 1.9 0.9
Portugal 2.2 0.6 0.3 Total non-OECD 53.4 Slovak Republic 1.2 0.3 0.1
Slovenia 0.5 0.1 0.1 World 100.0
Note:
1. Countries that are members of both the euro area and the OECD. Source: OECD Economic Outlook 101 database.
Irrevocable euro conversion rates
National currency unit per euro
Austria 13.7603 Latvia 0.7028
Belgium 40.3399 Luxembourg 40.33990
Estonia 15.6466 Netherlands 2.204
Finland 5.94573 Portugal 200.482
France 6.55957 Spain 166.386
Germany 1.95583 Slovak Republic 30.13
Greece 340.75 Slovenia 239.64
Ireland 0.78756
Italy 1936.27 Lithuania 3.4528
Source: European Central Bank.
Non-OECD trade regions
Weights are calculated using nominal GDP at PPP rates in 2015. Regional aggregates are calculated using moving nominal GDP weights evaluated at PPP rates.
Dynamic Asian Economies:
Chinese Taipei; Hong Kong, China; Malaysia; Philippines; Singapore; Thailand and Vietnam.
STATISTICAL ANNEX
OECD ECONOMIC OUTLOOK, VOLUME 2017 ISSUE 1 © OECD 2017 – PRELIMINARY VERSION
5
National accounts reporting systems, base years and latest data updates
(con't)
The status of national accounts is as follows :
Government accounts Balance
Financial Non financial of payments
.. .. BPM6 (1994-2016) Argentina
SNA08 (1988-2016) SNA08 (1959q3-2016q4) BPM6 (1959q3-2016q4) Australia ESA10 (1995-2015) ESA10 (1995-2016) BPM6 (2006q1-2016q4) Austria ESA10 (1998-2016) ESA10 (1995-2016) BPM6 (2003q1-2016q4) Belgium
.. .. BPM6 (2014q1-2016q4) Brazil
SNA08 (1990q1-2016q4) SNA08 (1981q1-2016q4) BPM6 (1981q1-2016q4) Canada
.. .. BPM6 (2003q1-2017q1) Chile
.. .. BPM6 (1998q1-2017q1) China
.. ESA10 (2000-2015) BPM6 (2000q1-2016q4) Colombia
.. .. BPM6 (2009-2016) Costa Rica
ESA10 (1999-2016) ESA10 (1995-2016) BPM6 (1993q1-2016q4) Czech Republic ESA10 (1994-2016) ESA10 (1995-2016) BPM6 (1995q1-2016q4) Denmark ESA10 (1995-2016) ESA10 (1995-2016) BPM6 (1993q1-2016q4) Estonia ESA10 (1995-2016) ESA10 (1975-2016) BPM6 (1995q1-2016q4) Finland ESA10 (1995-2016) ESA10 (1978-2016) BPM6 (2008q1-2016q4) France ESA10 (1991-2016) ESA10 (1991-2016) BPM6 (1991q1-2017q1) Germany ESA10 (1995-2015) ESA10 (1995-2015) BPM6 (2002-2016) Greece ESA10 (1995-2016) ESA10 (1995-2016) BPM6 (1995q1-2016q4) Hungary SNA08 (2003-2013) SNA08 (1998-2015) BPM6 (1995q1-2016q2) Iceland
.. .. BPM6 (2004q1-2017q1) Indonesia
.. .. BPM6 (2010q1-2016q4) India
ESA10 (1998-2015) ESA10 (1995-2016) BPM6 (2002q1-2016q4) Ireland SNA08 (1995-2015) SNA08 (1995-2015) BPM6 (1995q1-2016q4) Israel ESA10 (1995-2016) ESA10 (1995-2016) BPM6 (1995q1-2016q4) Italy SNA08 (1994-2015) SNA08 (1994-2015) BPM6 (1996q1-2017q1) Japan SNA08 (2008-2015) SNA08 (1975-2016) BPM6 (1980q1-2017q1) Korea ESA10 (1998-2016) ESA10 (1995-2016) BPM6 (2000q1-2016q4) Latvia ESA10 (1995-2015) ESA10 (1995-2016) BPM6 (2004q1-2016q4) Lithuania ESA10 (1999-2016) ESA10 (1995-2016) BPM6 (2002q1-2016q4) Luxembourg
.. .. BPM6 (2010q1-2016q4) Mexico
ESA10 (1995-2016) ESA10 (1995-2016) BPM6 (2008q1-2016q4) Netherlands SNA08 (1994-2016) SNA08 (1986-2015) BPM6 (1971q2-2016q4) New Zealand SNA08 (1995-2016) SNA08 (1995-2016) BPM6 (1981q1-2016q4) Norway ESA10 (1998-2016) ESA10 (2010-2016) BPM6 (2004q1-2016q4) Poland ESA10 (1995-2016) ESA10 (1995-2016) BPM6 (1996q1-2016q4) Portugal
.. .. BPM6 (2000q1-2016q4) Russia
ESA10 (1995-2016) ESA10 (1995-2015) BPM6 (2004q1-2016q4) Slovak Republic ESA10 (2001-2016) ESA10 (1995-2016) BPM6 (1994q1-2017q1) Slovenia
.. .. BPM6 (1990q1-2016q4) South Africa
ESA10 (1995-2016) ESA10 (1995-2016) BPM6 (1995q1-2016q4) Spain ESA10 (1997-2016) ESA10 (1993-2016) BPM6 (2006q1-2016q4) Sweden ESA10 (1999-2015) ESA10 (1995-2015) BPM6 (2000q1-2016q4) Switzerland
.. .. BPM6 (1992q1-2016q4) Turkey
ESA10 (1987q1-2016q4) ESA10 (1987q1-2016q4) BPM6 (1987q1-2016q4) United Kingdom NIPA (SNA08) (1952q1-2016q4) NIPA (SNA08) (1947q1-2017q1) BPM6 (1960q1-2016q4) United States
Note:
BPM: Balance of Payments and International Investment Position Manual, edition 6.
STATISTICAL ANNEX
OECD ECONOMIC OUTLOOK, VOLUME 2017 ISSUE 1 © OECD 2017 – PRELIMINARY VERSION
7
Annex Tables
Demand and Output
1. Real GDP. . . .
9
2. Nominal GDP. . . .
10
3. Real private consumption expenditure. . . .
11
4. Real public consumption expenditure . . . .
12
5. Real total gross fixed capital formation . . . .
13
6. Real gross private non-residential fixed capital formation . . . .
14
7. Real gross residential fixed capital formation . . . .
15
8. Real total domestic demand . . . .
16
9. Foreign balance contributions to changes in real GDP . . . .
17
10. Quarterly demand and output projections. . . .
18
11. Contributions to changes in real GDP in OECD countries . . . .
20
12. Output gaps . . . .
22
Inflation, Wages, Costs, Unemployment and Labour
13. GDP deflators . . . .
23
14. Private consumption deflators . . . .
24
15. Consumer price indices. . . .
25
16. Oil and other primary commodity markets . . . .
26
17. Compensation per employee . . . .
27
18. Labour productivity . . . .
28
19. Employment and labour force . . . .
29
20. Labour force, employment and unemployment . . . .
30
21. Unemployment rates: national definitions . . . .
31
22. Harmonised unemployment rates. . . .
32
23. Quarterly price, cost and unemployment projections . . . .
33
Key Supply-side Data
24. Potential GDP and productive capital stock . . . .
34
25. Structural unemployment and unit labour costs . . . .
35
Saving
26. Household saving rates . . . .
36
27. Gross national saving. . . .
37
28. Household wealth and indebtedness . . . .
38
Fiscal Balances and Public Indebteness
29. General government total outlays . . . .
39
30. General government total tax and non-tax receipts . . . .
40
STATISTICAL ANNEX
OECD ECONOMIC OUTLOOK, VOLUME 2017 ISSUE 1 © OECD 2017 – PRELIMINARY VERSION
8
32. General government cyclically-adjusted balances . . . .
42
33. General government underlying balances . . . .
43
34. General government underlying primary balances. . . .
44
35. General government net debt interest payments . . . .
45
36. General government gross financial liabilities. . . .
46
37. General government net financial liabilities . . . .
47
38. Maastricht definition of general government gross public debt . . . .
48
Interest Rates and Exchange Rates
39. Short-term interest rates. . . .
49
40. Long-term interest rates . . . .
50
41. Nominal exchange rates (vis-à-vis the US dollar) . . . .
51
42. Effective exchange rates . . . .
52
House prices
43. Nominal house prices . . . .
53
44. Real house prices . . . .
54
45. House price-to-rent ratio. . . .
55
46. House price-to-income ratio. . . .
56
External Trade and Payments
47. Export volumes of goods and services . . . .
57
48. Import volumes of goods and services . . . .
58
49. Export prices of goods and services. . . .
59
50. Import prices of goods and services . . . .
60
51. Indicators of competitiveness based on relative consumer prices . . . .
61
52. Indicators of competitiveness based on relative unit labour costs. . . .
62
53. Export market growth in goods and services . . . .
63
54. Export performance for total goods and services . . . .
64
55. Import penetration. . . .
65
56. Shares in world exports and imports . . . .
66
57. Geographical structure of world trade growth . . . .
67
58. Trade balances for goods and services . . . .
68
59. Balance of primary income . . . .
69
60. Balance of secondary income . . . .
70
61. Current account balances . . . .
71
62. Current account balances as a percentage of GDP . . . .
72
STATISTICAL
The adoption of national accounts systems has been proceeding at an uneven pace among countries, both with respect to variables and the time period covered. As a consequence, there are breaks in many national series. For further information, see table National Accounts Reporting Systems, base years and latest data updates at the beginning of the Statistical Annex.
2011
STATISTICAL
The adoption of national accounts systems has been proceeding at an uneven pace among countries, both with respect to variables and the time period covered. As a consequence, there are breaks in many national series. For further information, see table National Accounts Reporting Systems, base years and latest data updates at the beginning of the Statistical Annex.
2018 2013 2014 2016 2017 2009
STATISTICAL
The adoption of national accounts systems has been proceeding at an uneven pace among countries, both with respect to variables and the time period covered. As a consequence, there are breaks in many national series. For further information, see table National Accounts Reporting Systems, base years and latest data updates at the beginning of the Statistical Annex.
2003 2004 2005 2006 2007 2008 2009 2010 2011 2012 2013 2014 2018
STATISTICAL
ANNE
X
OECD
ECONOMIC
OUTLOOK,
V
OLUME
2017
ISSU
E
1
©
OECD
2017
–
PRELIMIN
AR
Y
VERSION
14
Annex Table 6.
Real gross private non-residential fixed capital formation
1 2 http://dx.doi.org/10.1787/888933438069 Percentage changes
Average 2016 2017 2018
1992-02
Australia 6.2 11.9 7.6 12.4 8.2 11.5 6.7 -2.4 0.6 12.9 15.2 -2.0 -4.8 -6.4 -8.4 -2.1 0.5 -6.7 -2.0 2.0 Belgium 2.3 -2.4 11.1 2.9 2.3 6.5 3.4 -7.5 -2.1 6.5 0.0 -0.3 5.6 3.1 1.2 2.8 3.5 5.7 0.8 3.5 Canada 5.0 6.6 9.1 11.2 9.0 2.5 4.0 -20.2 14.0 11.6 7.1 4.3 1.5 -11.3 -8.0 -1.9 3.5 -7.1 2.9 3.6 Denmark 4.3 -1.1 -0.9 3.6 15.3 2.2 3.9 -13.3 -8.1 -6.1 6.2 7.7 0.4 4.0 4.1 5.1 4.2 8.2 2.1 5.2
Finland 5.4 -1.5 2.1 5.5 2.2 16.6 4.9 -15.6 -6.3 3.1 -3.1 -7.3 -1.8 2.9 4.6 6.6 2.5 9.6 2.4 3.2 France 2.5 0.8 2.7 2.6 5.1 8.2 3.6 -11.6 3.0 4.8 1.0 -0.9 2.5 2.9 3.9 2.6 2.7 2.8 2.7 3.1 Germany 0.6 -0.9 1.6 3.6 8.5 7.8 2.1 -15.5 6.2 7.3 -1.7 -0.8 4.4 0.9 1.1 2.5 3.1 -0.3 4.4 3.0 Iceland 4.6 18.4 31.7 54.9 25.8 -22.5 -21.8 -50.4 0.0 23.9 7.6 -4.9 17.0 28.3 24.7 6.2 -3.9 11.0 6.6 -8.7 Japan -0.5 2.4 3.8 8.5 2.1 1.0 -2.8 -13.4 -0.9 4.0 4.1 3.7 5.2 1.1 1.3 2.4 2.7 2.9 1.6 2.8 Korea 5.1 2.1 3.2 2.0 6.4 7.6 0.9 -3.7 14.2 3.3 0.2 0.9 3.3 2.4 2.7 4.0 3.2 6.6 3.1 3.5 Netherlands 3.6 -1.6 0.0 3.2 7.1 8.9 6.1 -10.5 -3.0 12.8 -3.9 -2.4 2.8 7.5 2.1 4.3 2.3 -6.0 8.3 2.5 New Zealand 6.9 16.1 14.6 7.4 0.7 11.6 -0.1 -21.2 -0.8 13.4 8.8 4.8 6.1 0.8 6.1 7.4 5.8 5.7 9.5 4.2 Norway 4.0 -3.4 10.7 16.7 10.9 15.4 2.2 -10.4 -8.9 6.2 9.4 5.1 -1.9 -7.9 -5.9 -1.1 1.6 -2.0 -0.9 2.5 Sweden 5.2 3.2 4.6 5.1 9.5 10.2 3.9 -15.2 3.4 7.2 3.0 0.8 4.3 6.0 1.2 1.2 1.7 -2.6 2.8 1.6 Switzerland 3.0 -3.8 5.7 4.7 7.1 7.2 0.5 -10.6 4.1 5.1 3.9 1.4 3.3 1.8 2.5 1.8 2.5 1.4 3.1 2.4 United Kingdom 3.9 -0.3 -3.5 15.7 -7.3 9.2 -1.1 -16.0 6.0 4.3 7.2 2.6 3.9 5.1 -1.5 -0.6 -3.0 -0.9 -1.2 -3.3 United States 6.8 1.9 5.2 7.0 7.1 5.9 -0.7 -15.6 2.5 7.7 9.0 3.5 6.0 2.1 -0.5 4.4 4.3 -0.1 5.3 4.8
Note:
Source: OECD Economic Outlook 101 database.
2005
Q4 / Q4
2006 2011
The adoption of national accounts systems has been proceeding at an uneven pace among countries, both with respect to variables and the time period covered. As a consequence, there are breaks in many national series. For further information, see table National Accounts Reporting Systems, base years and latest data updates at the beginning of the Statistical Annex.
STATISTICAL
ANNE
X
OECD
ECONOMIC
OUTLOOK,
V
OLUME
2017
ISSUE
1
©
OECD
2017
–
PRELIMIN
AR
Y
VERSION
15
Annex Table 7.
Real gross residential fixed capital formation
1 2 http://dx.doi.org/10.1787/888933438076
Percentage changes
Average 2016 2017 2018
1992-02
Australia 4.9 5.2 5.8 -1.9 -3.1 2.2 2.4 -4.8 5.9 -1.0 -6.4 2.5 6.9 10.0 7.9 4.5 3.5 5.6 6.0 2.0 Austria 0.6 -4.1 0.8 1.4 0.5 1.9 0.7 -1.6 0.7 2.9 -1.3 -0.1 -0.6 0.9 0.3 2.3 2.3 -0.2 3.5 1.6 Belgium -0.6 4.7 3.9 15.6 4.8 4.7 -2.2 -10.4 1.8 -2.5 -0.1 -3.9 4.7 0.8 4.5 2.3 2.0 3.6 2.0 2.0 Canada 3.0 3.5 8.3 4.9 2.4 2.6 -4.1 -5.8 7.7 1.3 5.8 0.0 2.4 3.5 2.7 3.8 1.8 2.2 4.8 0.7
Denmark 4.8 13.5 12.1 16.7 11.4 -5.5 -16.7 -20.4 -8.9 15.8 -5.5 -7.8 8.6 3.8 11.0 0.2 1.6 6.1 1.8 1.5 Finland 2.8 11.3 11.2 5.0 3.8 -0.3 -10.6 -13.9 24.1 5.3 -3.5 -5.3 -6.5 2.0 9.1 3.6 2.3 7.7 1.8 3.1 France 2.6 2.7 4.0 4.3 4.9 2.6 -4.0 -11.9 1.6 1.1 -2.0 -0.3 -3.3 -0.7 2.1 3.5 3.6 2.7 3.6 3.6 Germany 0.3 -1.9 -4.2 -4.1 6.8 -1.5 -4.0 -3.2 4.1 10.0 4.2 -0.7 2.9 1.0 3.8 2.9 3.2 3.4 3.4 2.9 Greece 0.2 18.2 16.6 -9.2 17.6 15.0 -24.0 -19.7 -26.3 -14.4 -38.1 -31.1 -53.1 -26.0 -12.6 1.0 2.8 -3.1 2.2 3.0 Iceland 2.4 3.7 14.2 11.9 16.5 13.2 -21.9 -55.7 -18.0 5.4 6.9 8.0 14.8 -3.1 33.7 22.1 20.0 67.3 2.2 18.2 Ireland 8.9 18.1 11.1 16.3 2.7 -12.1 -17.5 -39.9 -34.0 -16.5 -19.4 8.9 20.5 4.6 17.9 10.3 10.2 20.6 7.6 11.7 Italy 0.5 3.9 2.5 6.2 5.2 1.0 -1.9 -9.3 -0.2 -6.4 -7.7 -4.5 -6.7 1.5 3.3 2.1 2.4 2.5 1.9 2.5 Latvia .. -9.0 62.0 17.8 34.4 41.4 -11.9 -52.4 -28.9 1.3 13.8 -1.3 9.7 -19.5 -11.1 -10.7 9.7 -21.4 24.8 7.9 Japan -2.0 -1.3 1.7 -0.5 0.7 -9.5 -6.6 -16.4 -3.7 4.9 2.5 8.0 -4.3 -1.6 5.6 3.8 2.0 7.5 2.1 2.1 Korea 1.8 12.0 3.1 2.1 -2.3 -3.5 -9.4 -2.5 -12.0 -8.0 -2.9 23.4 11.1 18.9 22.1 8.4 2.0 21.6 3.4 2.0 Netherlands 2.0 -4.0 4.6 5.5 5.8 5.1 0.4 -14.9 -16.0 -4.4 -12.9 -12.2 6.1 27.4 19.0 11.8 6.0 19.7 7.5 6.5 New Zealand 4.6 20.3 3.7 -4.0 -2.1 3.1 -18.1 -14.1 1.2 -0.1 18.1 16.7 9.9 1.3 9.6 3.8 4.8 10.6 3.7 5.0 Norway 7.1 1.8 16.3 9.7 4.0 2.7 -9.0 -8.1 -1.6 17.0 10.9 5.3 -1.4 1.6 9.9 9.5 3.8 10.9 6.0 3.7 Spain 7.1 8.2 4.9 6.5 6.7 1.3 -9.2 -20.3 -11.6 -13.3 -10.3 -10.2 6.2 3.1 3.7 5.2 4.3 3.8 4.8 5.1 Sweden -5.4 5.2 12.8 10.1 14.5 6.6 -13.3 -18.8 12.5 8.0 -11.7 0.9 15.5 15.8 17.3 7.7 4.6 14.9 5.7 4.0 Switzerland -1.1 14.4 7.0 1.1 -1.6 -3.0 -4.2 1.8 3.5 2.2 1.5 1.7 2.3 1.2 2.7 2.5 3.2 1.2 4.4 2.9 United Kingdom 1.0 4.0 7.0 4.1 3.3 1.9 -23.2 -26.2 4.8 2.1 -1.5 9.5 13.2 3.6 3.7 3.4 -1.1 1.5 2.6 -1.5 United States 4.5 9.1 10.0 6.6 -7.6 -18.8 -24.0 -21.2 -2.5 0.5 13.5 11.9 3.5 11.7 4.9 5.4 4.8 1.1 6.2 5.2
Note:
Source: OECD Economic Outlook 101 database.
2007 2008
Q4 / Q4
2009 2014 2018
The adoption of national accounts systems has been proceeding at an uneven pace among countries, both with respect to variables and the time period covered. As a consequence, there are breaks in many national series. For further information, see table National Accounts Reporting Systems, base years and latest data updates at the beginning of the Statistical Annex.
2015 2016 2017 2010 2011 2012 2013
STATISTICAL
The adoption of national accounts systems has been proceeding at an uneven pace among countries, both with respect to variables and the time period covered. As a consequence, there are breaks in many national series. For further information, see table National Accounts Reporting Systems, base years and latest data updates at the beginning of the Statistical Annex.
2003 2004 2005 2006 2007 2008 2009 2010 2011 2012 2013 2014 2015 2018
STATISTICAL
Contributions to per cent change from the previous period, seasonnally adjusted at annual rates.
STATISTICAL ANNEX
OECD ECONOMIC OUTLOOK, VOLUME 2017 ISSUE 1 © OECD 2017 – PRELIMINARY VERSION
18
Annex Table 10.
Quarterly demand and output projections
1 2 http://dx.doi.org/10.1787/888933438105
Percentage changes, seasonally adjusted at annual rates, volume
2016 2017 2018 2016 2017 2018
Q4 Q1 Q2 Q3 Q4 Q1 Q2 Q3 Q4
Private consumption
Canada 2.2 3.1 1.9 2.4 4.8 3.4 2.2 1.8 1.7 1.7 1.7 1.7 2.3 3.0 1.7 France 1.8 1.2 1.4 2.4 0.6 1.4 1.4 1.4 1.4 1.4 1.4 1.4 2.0 1.2 1.4 Germany 1.9 1.3 1.4 0.6 1.2 1.6 1.5 1.5 1.5 1.4 1.4 1.4 1.7 1.4 1.4 Italy 1.3 0.7 0.4 0.3 0.7 0.7 0.7 0.7 0.3 0.2 0.2 0.2 0.9 0.7 0.2 Japan 0.4 0.9 0.6 0.2 1.4 0.7 0.7 0.9 0.7 0.4 0.4 0.3 0.9 0.9 0.4 United Kingdom 2.8 2.0 1.1 2.8 1.4 1.7 1.5 1.2 1.1 1.0 0.9 0.8 2.9 1.4 1.0 United States 2.7 2.4 2.4 3.5 0.6 2.6 2.3 2.3 2.4 2.5 2.5 2.5 3.1 2.0 2.5 Euro area 1.9 1.4 1.4 1.6 1.0 1.6 1.5 1.4 1.3 1.3 1.3 1.3 1.9 1.4 1.3 Total OECD 2.3 2.1 2.0 3.3 1.3 1.9 1.8 1.8 2.2 2.1 2.1 1.9 2.6 1.7 2.1
Public consumption
Canada 2.0 1.5 0.8 2.1 1.9 1.7 1.1 0.9 0.7 0.6 0.6 0.6 2.3 1.4 0.7 France 1.4 1.2 1.1 1.1 1.4 1.2 1.1 1.1 1.1 1.1 1.1 1.1 1.3 1.2 1.1 Germany 4.0 1.7 2.3 1.1 1.7 2.5 2.4 2.3 2.3 2.3 2.2 2.1 2.7 2.2 2.2 Italy 0.6 0.6 0.1 2.4 0.8 0.6 0.4 0.0 0.0 0.0 0.0 0.0 1.0 0.5 0.0 Japan 1.5 0.3 0.1 0.3 0.6 1.1 0.4 -0.3 -0.8 0.4 0.5 0.9 0.6 0.5 0.2 United Kingdom 0.8 1.4 1.1 -0.1 3.1 2.0 1.7 1.5 0.9 0.8 0.7 0.5 0.4 2.1 0.7 United States 0.8 0.5 2.4 -0.8 -1.1 1.3 2.1 2.3 2.5 2.6 2.6 2.6 0.3 1.1 2.6 Euro area 1.8 1.2 1.3 1.2 1.2 1.5 1.4 1.3 1.2 1.2 1.2 1.1 1.5 1.4 1.2 Total OECD 1.7 1.1 1.6 1.2 0.8 1.5 1.6 1.5 1.5 1.7 1.7 1.8 1.1 1.3 1.7
Business investment
Canada -8.0 -1.9 3.5 -16.1 2.0 3.0 3.3 3.3 3.5 3.6 3.7 3.8 -7.1 2.9 3.6 France 3.9 2.6 2.7 3.6 4.9 2.0 2.0 2.0 2.8 3.2 3.2 3.2 2.8 2.7 3.1 Germany 1.1 2.5 3.1 -2.1 9.2 2.5 3.0 3.2 3.2 3.0 3.0 3.0 -0.3 4.4 3.0 Japan 1.3 2.4 2.7 7.6 0.9 1.2 1.4 2.7 3.9 3.1 2.4 2.0 2.9 1.6 2.8 United Kingdom -1.5 -0.6 -3.0 -3.6 2.4 -2.0 -2.5 -2.8 -3.0 -3.2 -3.4 -3.6 -0.9 -1.2 -3.3 United States -0.5 4.4 4.3 0.9 11.4 3.0 3.0 4.0 4.5 4.8 4.9 4.9 -0.1 5.3 4.8
Total investment
Canada -3.2 1.4 3.3 -6.0 4.9 4.8 4.0 3.3 3.1 3.0 3.0 3.0 -2.4 4.2 3.0 France 2.7 2.3 2.8 2.3 3.6 2.3 2.4 2.4 2.9 3.2 3.2 3.2 2.0 2.7 3.1 Germany 2.0 2.8 3.0 1.8 6.9 2.8 3.2 3.2 3.1 2.9 2.9 2.9 0.5 4.0 3.0 Italy 3.1 3.4 3.2 5.3 2.5 2.5 2.5 3.0 3.0 3.5 4.0 4.0 4.2 2.6 3.6 Japan 0.9 2.1 1.5 2.5 1.0 2.9 3.3 1.5 1.1 1.1 0.9 0.5 2.1 2.2 0.9 United Kingdom 0.5 1.2 -1.8 0.6 4.9 -0.9 -1.4 -1.7 -1.8 -1.9 -2.1 -2.2 1.0 0.2 -2.0 United States 0.7 3.9 4.2 3.1 9.6 3.3 3.1 3.9 4.4 4.6 4.8 4.8 0.1 5.0 4.6 Euro area 3.4 3.4 3.3 13.8 -1.8 2.4 3.0 3.1 3.4 3.5 3.6 3.6 5.0 1.6 3.5 Total OECD 1.3 3.2 3.1 5.1 4.4 2.5 2.7 2.8 3.1 3.3 3.5 3.5 1.6 3.1 3.4
Note:
Source: OECD Economic Outlook 101 database. 2016 2017 2018
The adoption of national accounts systems has been proceeding at an uneven pace among countries, both with respect to variables and the time period covered. As a consequence, there are breaks in many national series. For further information, see table National Accounts Reporting Systems, base years and latest data updates at the beginning of the Statistical Annex.
STATISTICAL ANNEX
OECD ECONOMIC OUTLOOK, VOLUME 2017 ISSUE 1 © OECD 2017 – PRELIMINARY VERSION
19
Annex Table 10.
Quarterly demand and output projections (cont.)
1 2 http://dx.doi.org/10.1787/888933438105
Percentage changes, seasonally adjusted at annual rates, volume
2016 2017 2018 2016 2017 2018
Q4 Q1 Q2 Q3 Q4 Q1 Q2 Q3 Q4
Total domestic demand
Canada 0.6 2.4 2.0 -2.2 5.0 3.3 2.4 2.0 1.8 1.8 1.8 1.8 1.2 3.1 1.8 France 1.8 1.9 1.6 1.1 3.7 1.0 1.5 1.5 1.6 1.7 1.7 1.7 1.3 1.9 1.7 Germany 2.2 1.7 2.0 2.7 0.6 2.1 2.1 2.0 2.0 1.9 1.9 1.9 1.9 1.7 1.9 Italy 1.1 1.0 0.9 0.9 1.1 1.0 1.0 1.0 0.7 0.8 0.8 0.8 1.0 1.0 0.8 Japan 0.4 0.9 0.7 -0.1 1.6 1.3 1.3 0.8 0.5 0.5 0.5 0.5 0.5 1.2 0.5 United Kingdom 1.5 2.1 0.6 -4.8 6.6 1.3 1.0 0.7 0.6 0.5 0.4 0.3 1.6 2.4 0.4 United States 1.7 2.4 2.7 3.9 1.0 3.3 2.4 2.5 2.7 2.8 2.8 2.9 2.1 2.3 2.8 Euro area 2.1 1.8 1.8 4.8 -0.1 1.7 1.8 1.8 1.7 1.8 1.8 1.8 2.4 1.3 1.8 Total OECD 1.8 2.2 2.1 3.0 1.8 2.3 2.0 2.0 2.2 2.2 2.3 2.2 2.0 2.0 2.2
Exports of goods and services
Canada 1.1 2.3 4.4 1.3 2.5 3.2 3.8 4.2 4.6 4.6 4.7 4.7 0.8 3.4 4.7 France 1.2 2.5 3.9 5.8 -2.8 5.7 3.5 3.6 3.8 3.9 4.0 4.0 2.0 2.5 3.9 Germany 2.5 4.2 3.7 6.9 5.3 4.1 4.0 3.8 3.8 3.6 3.5 3.3 4.1 4.3 3.5 Italy 2.6 4.1 3.6 7.6 2.2 3.8 3.8 3.5 3.5 3.5 3.5 3.5 3.8 3.3 3.5 Japan 1.2 6.4 3.4 14.1 8.9 3.7 1.1 2.7 3.6 4.3 4.3 4.3 4.4 4.0 4.1 United Kingdom 1.8 1.9 2.6 19.8 -6.1 2.2 2.4 2.5 2.7 2.8 2.9 3.0 0.6 0.1 2.8 United States 0.4 2.9 3.0 -4.5 5.9 2.7 2.7 2.7 3.0 3.1 3.2 3.3 1.5 3.5 3.1 Total OECD1
2.3 4.2 3.9 6.9 4.2 3.5 3.4 3.6 3.9 4.1 4.2 4.2 3.1 3.7 4.1
Imports of goods and services
Canada -1.0 0.8 3.2 -13.5 6.2 4.3 3.4 3.0 3.1 3.1 3.1 3.1 -1.3 4.2 3.1 France 3.5 4.4 4.2 3.3 6.0 3.7 3.6 3.8 4.3 4.6 4.6 4.6 2.4 4.3 4.5 Germany 3.7 4.1 3.9 10.3 1.6 3.9 4.0 3.9 3.8 3.9 4.1 4.1 4.9 3.3 4.0 Italy 3.1 4.7 3.9 8.9 3.2 3.2 3.2 3.5 4.0 4.5 4.5 4.5 4.3 3.3 4.4 Japan -2.3 3.2 1.9 5.3 5.5 4.6 2.4 2.2 1.5 1.5 1.5 1.5 -2.0 3.7 1.5 United Kingdom 2.8 3.8 1.3 -4.1 11.1 1.8 1.7 1.4 1.3 1.2 1.1 1.1 2.0 3.9 1.2 United States 1.1 4.7 5.1 8.9 3.8 5.0 4.9 4.9 5.2 5.2 5.2 5.2 2.6 4.6 5.2 Total OECD1 2.7 4.4 4.0 7.6 4.0 4.0 3.8 3.7 4.0 4.2 4.3 4.3 3.2 3.9 4.2
GDP
Canada 1.4 2.8 2.3 2.6 3.8 3.0 2.5 2.3 2.3 2.2 2.3 2.3 1.9 2.9 2.3 France 1.1 1.3 1.5 1.8 1.0 1.6 1.5 1.4 1.4 1.5 1.5 1.5 1.2 1.4 1.5 Germany 1.8 2.0 2.0 1.7 2.4 2.3 2.2 2.2 2.1 1.9 1.8 1.7 1.8 2.3 1.9 Italy 1.0 1.0 0.8 0.7 0.8 1.3 1.2 1.1 0.7 0.6 0.7 0.7 1.0 1.1 0.6 Japan 1.0 1.4 1.0 1.4 2.2 1.2 1.1 0.9 0.9 1.0 1.0 1.0 1.7 1.3 1.0 United Kingdom 1.8 1.6 1.0 2.7 0.7 1.4 1.2 1.1 1.0 0.9 0.9 0.8 1.9 1.1 0.9 United States 1.6 2.1 2.4 2.1 1.2 2.9 2.0 2.2 2.4 2.5 2.5 2.6 2.0 2.1 2.5 Euro area 1.7 1.8 1.8 1.9 1.8 2.0 1.9 1.8 1.8 1.7 1.7 1.7 1.8 1.9 1.7 Total OECD 1.8 2.1 2.1 2.7 1.9 2.1 1.8 1.9 2.2 2.2 2.3 2.2 2.0 1.9 2.2
Note:
1. Includes intra-regional trade.
Source: OECD Economic Outlook 101 database. 2016 2017 2018
The adoption of national accounts systems has been proceeding at an uneven pace among countries, both with respect to variables and the time period covered. As a consequence, there are breaks in many national series. For further information, see table National Accounts Reporting Systems, base years and latest data updates at the beginning of the Statistical Annex.
STATISTICAL ANNEX
OECD ECONOMIC OUTLOOK, VOLUME 2017 ISSUE 1 © OECD 2017 – PRELIMINARY VERSION
20
Annex Table 11.
Contributions to changes in real GDP in OECD countries
1 2 http://dx.doi.org/10.1787/888933438115
2015 2016 2017 2018 2015 2016 2017 2018
Australia Germany
Final domestic demand 1.3 1.6 2.0 2.4 Final domestic demand 1.8 2.2 1.6 1.8 Stockbuilding 0.0 0.1 0.1 0.0 Stockbuilding -0.4 -0.1 0.0 0.0 Net exports 0.8 1.4 0.6 0.8 Net exports 0.1 -0.3 0.4 0.2
GDP 2.4 2.4 2.5 2.9 GDP 1.5 1.8 2.0 2.0
Austria Greece
Final domestic demand 0.5 1.8 1.9 1.7 Final domestic demand -0.2 0.7 2.3 2.1 Stockbuilding -0.1 0.5 0.5 0.0 Stockbuilding -1.0 -0.1 -1.7 0.1 Net exports 0.2 -0.8 -0.1 0.0 Net exports 0.9 -0.7 0.5 0.3
GDP 0.8 1.6 2.2 1.7 GDP -0.3 -0.1 1.1 2.5
Belgium Hungary
Final domestic demand 1.2 1.0 1.3 1.6 Final domestic demand 2.3 -0.9 4.2 4.1 Stockbuilding 0.3 0.1 0.4 0.0 Stockbuilding -1.0 2.2 -0.2 0.0 Net exports 0.0 0.1 0.0 0.2 Net exports 1.8 0.6 -0.3 -0.7
GDP 1.5 1.2 1.6 1.7 GDP 3.1 1.9 3.8 3.4
Canada Iceland
Final domestic demand 0.3 0.9 2.5 2.0 Final domestic demand 5.6 8.0 4.8 2.1 Stockbuilding -0.3 -0.3 0.0 0.0 Stockbuilding -0.9 -0.6 0.0 0.0 Net exports 1.0 0.7 0.4 0.3 Net exports -1.5 -0.8 0.6 0.6
GDP 0.9 1.4 2.8 2.3 GDP 4.1 7.2 5.3 2.6
Chile Ireland
Final domestic demand 1.7 2.0 2.1 3.0 Final domestic demand 9.2 9.2 2.9 2.3 Stockbuilding 0.3 -0.8 0.8 0.0 Stockbuilding -0.8 1.2 1.0 0.0 Net exports 0.3 0.4 -0.8 -0.2 Net exports 18.3 -6.6 -0.9 0.2
GDP 2.3 1.6 1.6 2.8 GDP 26.3 5.2 3.7 2.5
Czech Republic Israel
Final domestic demand 4.2 0.6 2.2 2.6 Final domestic demand 3.2 6.4 2.3 3.7 Stockbuilding 0.3 0.7 -0.1 0.0 Stockbuilding 0.6 -0.7 -0.4 0.1 Net exports 0.1 1.0 0.9 0.0 Net exports -1.2 -1.7 1.2 -0.5
GDP 4.6 2.3 2.9 2.6 GDP 2.6 4.0 3.2 3.3
Denmark Italy
Final domestic demand 1.5 1.9 1.4 1.9 Final domestic demand 1.1 1.4 1.1 0.8 Stockbuilding -0.3 -0.4 -0.3 0.0 Stockbuilding 0.2 -0.4 -0.1 0.0 Net exports 0.4 -0.2 0.5 0.2 Net exports -0.6 -0.1 0.0 0.0
GDP 1.6 1.3 1.6 2.1 GDP 0.7 1.0 1.0 0.8
Estonia Japan
Final domestic demand 2.2 1.8 3.4 3.6 Final domestic demand 0.1 0.7 1.0 0.7 Stockbuilding -1.5 0.9 1.0 0.0 Stockbuilding 0.6 -0.3 -0.2 0.0 Net exports 0.6 -0.7 -0.5 -0.5 Net exports 0.4 0.6 0.5 0.3
GDP 1.5 1.7 2.6 3.1 GDP 1.1 1.0 1.4 1.0
Finland Korea
Final domestic demand 1.1 2.3 1.6 1.0 Final domestic demand 3.0 3.4 3.5 2.7 Stockbuilding 0.4 -0.2 -0.2 0.0 Stockbuilding 0.7 0.0 0.4 0.0 Net exports -0.4 -0.7 0.6 0.5 Net exports -1.0 -0.7 -1.0 0.4
GDP 0.3 1.4 2.0 1.5 GDP 2.8 2.8 2.6 2.8
France Latvia
Final domestic demand 1.4 1.9 1.5 1.7 Final domestic demand 2.3 0.1 3.9 4.4 Stockbuilding 0.1 -0.1 0.4 0.0 Stockbuilding 0.2 2.9 -0.2 0.0 Net exports -0.3 -0.7 -0.7 -0.2 Net exports 0.3 -1.1 -0.2 -0.9
GDP 1.2 1.1 1.3 1.5 GDP 2.7 2.0 3.5 3.5
Note:
Source: OECD Economic Outlook 101 database.
STATISTICAL ANNEX
OECD ECONOMIC OUTLOOK, VOLUME 2017 ISSUE 1 © OECD 2017 – PRELIMINARY VERSION
21
Annex Table 11.
Contributions to changes in real GDP in OECD countries (cont.)
1 2 http://dx.doi.org/10.1787/888933438115
2015 2016 2017 2018 2015 2016 2017 2018
Luxembourg Sweden
Final domestic demand 1.2 0.9 2.9 2.2 Final domestic demand 3.3 3.0 2.5 2.2 Stockbuilding 0.8 -0.2 0.0 0.0 Stockbuilding 0.3 0.1 -0.1 0.0
Net exports 2.2 2.1 1.5 2.0 Net exports 0.3 0.0 0.3 0.0
GDP 4.0 4.2 4.5 4.2 GDP 3.8 3.1 2.7 2.3
Mexico Switzerland
Final domestic demand 2.7 1.9 1.7 1.6 Final domestic demand 1.2 1.4 1.6 1.8 Stockbuilding -0.2 -0.1 -0.2 0.0 Stockbuilding 0.5 -1.6 -0.6 0.0 Net exports 0.5 0.3 0.7 0.4 Net exports -0.9 1.5 0.5 0.1
GDP 2.7 2.0 1.9 2.0 GDP 0.8 1.3 1.5 1.9
Netherlands Turkey
Final domestic demand 2.6 1.9 2.3 1.8 Final domestic demand 6.4 3.6 4.1 3.6 Stockbuilding -0.6 0.0 -0.2 0.0 Stockbuilding -1.6 0.3 -0.8 0.1 Net exports 0.0 0.2 0.4 0.3 Net exports 0.6 -1.5 0.2 -0.2
GDP 2.0 2.1 2.4 2.1 GDP 5.9 3.1 3.4 3.5
New Zealand United Kingdom
Final domestic demand 2.6 4.2 4.2 3.4 Final domestic demand 2.4 2.0 1.8 0.7 Stockbuilding -0.5 0.6 0.2 -0.1 Stockbuilding -0.4 -0.5 0.3 0.0 Net exports 1.0 -0.7 -1.4 -0.2 Net exports 0.0 -0.3 -0.6 0.4
GDP 3.1 3.9 3.1 3.1 GDP 2.2 1.8 1.6 1.0
Norway United States
Final domestic demand 0.4 1.3 1.9 1.9 Final domestic demand 3.1 2.1 2.5 2.8 Stockbuilding 0.2 0.3 -0.2 0.0 Stockbuilding 0.2 -0.4 0.0 0.0 Net exports 1.0 -0.4 -0.5 -0.4 Net exports -0.7 -0.1 -0.3 -0.4
GDP 1.6 1.1 1.3 1.5 GDP 2.6 1.6 2.1 2.4
Poland
Final domestic demand 3.4 1.1 3.4 3.3 Stockbuilding -0.2 1.2 -0.1 0.0 Net exports 0.6 0.3 0.9 -0.2
GDP 3.8 2.7 3.6 3.1
Portugal Euro area
Final domestic demand 2.5 1.6 2.1 1.2 Final domestic demand 1.8 2.1 1.7 1.7 Stockbuilding 0.0 -0.1 -0.1 0.0 Stockbuilding -0.1 -0.1 0.1 0.0 Net exports -0.8 0.0 0.2 0.3 Net exports 0.2 -0.4 0.1 0.1
GDP 1.6 1.4 2.1 1.6 GDP1 1.5 1.7 1.8 1.8
Slovak Republic Total OECD
Final domestic demand 5.7 -0.2 2.1 3.5 Final domestic demand 2.4 2.0 2.2 2.2 Stockbuilding -1.1 1.2 0.0 0.0 Stockbuilding 0.0 -0.2 0.0 0.0 Net exports -0.7 1.8 0.2 0.6 Net exports -0.1 -0.1 0.0 0.0
GDP 3.8 3.3 3.3 4.1 GDP1 2.2 1.8 2.1 2.1
Slovenia
Final domestic demand 0.9 1.4 3.5 3.1 Stockbuilding 0.4 0.8 0.0 0.0 Net exports 1.1 0.3 0.2 0.0
GDP 2.3 2.5 3.8 3.1
Spain
Final domestic demand 3.2 2.6 2.2 2.2 Stockbuilding 0.1 0.1 0.0 0.0 Net exports -0.1 0.5 0.5 0.2
GDP 3.2 3.2 2.8 2.4
Note:
Source: OECD Economic Outlook 101 database.
The adoption of national accounts systems has been proceeding at an uneven pace among countries, both with respect to variables and the time period covered. As a consequence, there are breaks in many national series. For further information, see table National Accounts Reporting Systems, base years and latest data updates at the beginning of the Statistical Annex. Totals may not add up due to rounding and/or statistical discrepancy.
STATISTICAL
For methodological details, see Sources & Methods of the OECD Economic Outlook (http://www.oecd.org/eco/sources-and-methods.htm). 2010
2002 2012 2013 2016
2000 2001 2003 2005 2006 2007 2008 2009 2011 2014 2015 2017 2018
STATISTICAL
The adoption of national accounts systems has been proceeding at an uneven pace among countries, both with respect to variables and the time period covered. As a consequence, there are breaks in many national series. For further information, see table National Accounts Reporting Systems, base years and latest data updates at the beginning of the Statistical Annex.
2003 2004 2005 2006 2007 2008 2009 2010 2011 2012 2016 2018
Q4 / Q4 2017
STATISTICAL
STATISTICAL
STATISTICAL
2. Indices through are based on data compiled by the International Energy Agency for oil and by the Hamburg Institute of International Economics (HWWI) for the prices of other primary commodities. 3. North Sea Dated, London close, midpoint.
4.
Source: OECD Economic Outlook 101 database; and International Energy Agency, Oil Market Report.
STATISTICAL
ANNE
X
OECD
ECONOMIC
OUTLOOK,
V
OLUME
2017
ISSUE
1
©
OECD
2017
–
PRELIMIN
AR
Y
VERSION
27
Annex Table 17.
Compensation per employee
1 2 http://dx.doi.org/10.1787/888933438177 Percentage changes from previous period
Average 1989-1999
Australia 3.9 3.7 4.6 3.6 3.5 5.2 3.6 4.5 6.3 4.0 1.1 5.3 5.7 3.6 1.8 2.5 0.5 0.8 1.5 2.4 Austria 3.5 2.4 1.5 2.0 1.7 2.0 2.1 3.1 3.0 3.3 1.6 1.0 2.1 2.7 2.1 1.9 1.9 1.4 1.9 2.7 Belgium 3.9 2.1 3.5 3.9 2.0 1.7 1.9 3.6 3.5 3.7 1.1 1.4 3.4 3.1 2.4 1.0 0.0 0.0 2.7 2.7 Canada 3.1 5.2 1.9 1.4 1.8 4.0 4.5 4.3 4.1 3.2 1.3 1.4 3.4 3.1 2.8 3.0 2.0 1.7 2.1 3.3 Czech Republic .. 7.5 8.4 7.8 7.7 7.9 3.9 5.9 6.2 4.1 -0.6 3.3 2.9 1.7 -0.3 2.6 2.6 3.9 4.2 4.7 Denmark 3.4 3.1 4.0 3.8 3.5 3.1 3.4 3.5 3.7 3.9 2.8 3.2 1.4 1.8 1.6 1.5 1.5 1.5 2.1 2.1 Estonia .. 14.6 9.6 9.2 11.7 11.8 11.0 13.8 24.9 10.3 -3.2 2.3 0.4 6.0 3.9 5.9 6.7 5.6 5.6 5.4 Finland 3.8 3.9 3.6 1.7 2.2 3.6 3.5 3.4 3.3 4.3 2.0 2.2 3.6 2.8 1.3 1.0 1.6 1.0 -0.5 0.4 France 2.4 2.5 2.8 3.5 2.9 3.4 3.0 3.2 2.5 2.6 1.6 2.8 2.3 2.2 1.6 1.1 1.1 1.2 1.7 1.8 Germany .. 1.4 1.9 1.3 1.5 0.2 0.2 1.0 0.9 2.1 0.2 2.6 3.0 2.5 1.8 2.8 2.4 2.3 2.4 2.5 Greece .. 5.8 5.9 11.0 7.9 3.9 3.5 3.1 4.6 3.7 3.1 -2.0 -3.8 -3.0 -7.5 -2.1 -2.9 0.8 0.0 1.0 Hungary .. 15.5 15.5 11.3 11.5 9.8 7.6 5.3 5.7 7.3 -1.4 0.6 3.0 2.0 1.6 1.4 1.5 5.3 6.5 6.8 Iceland 6.5 9.0 7.3 8.8 2.2 9.7 8.7 12.4 8.4 1.9 -3.2 5.7 9.3 5.2 5.6 3.3 6.3 9.6 6.5 4.8 Ireland .. 7.8 7.8 5.4 6.5 5.1 5.6 4.3 5.7 3.9 -1.0 -3.6 0.5 0.7 1.4 1.8 2.8 3.0 3.0 3.0 Israel .. 6.1 2.6 0.6 -2.1 0.3 1.9 5.6 2.5 2.9 -0.9 3.8 4.2 2.4 2.2 0.9 2.9 4.1 4.4 4.8 Italy 4.6 2.5 3.0 2.4 3.0 3.2 2.8 2.3 2.1 2.9 0.5 2.3 1.1 -1.1 0.8 0.2 0.8 0.6 1.0 1.1 Japan 1.4 -0.3 -1.3 -2.8 -1.0 -0.9 0.6 -0.2 -0.5 0.6 -3.5 -0.1 0.2 0.0 -0.6 0.7 0.4 0.8 1.2 1.6 Korea 10.7 3.9 7.2 6.3 7.2 4.8 5.8 3.7 4.6 3.9 2.2 3.8 3.7 3.2 2.2 2.0 2.9 3.7 2.9 3.4 Latvia .. 8.5 3.4 2.6 12.0 15.0 26.4 22.2 36.7 16.9 -11.5 -6.9 2.6 7.5 5.7 8.2 6.9 7.2 6.7 6.8 Luxembourg 3.7 5.6 3.3 3.9 1.3 3.9 3.8 4.2 4.2 2.8 1.7 1.9 1.9 1.8 2.7 2.2 1.7 0.5 2.8 2.7 Mexico 20.3 15.9 10.8 5.5 6.7 4.4 5.9 4.6 5.8 5.4 2.8 -1.9 5.8 3.0 3.6 4.8 4.1 5.4 5.0 3.6 Netherlands 2.8 5.5 3.1 4.1 3.2 3.1 1.1 1.6 3.2 3.8 2.4 0.4 1.8 2.1 2.1 1.6 0.2 1.7 1.7 2.3 Norway 4.3 4.9 5.7 4.4 4.1 4.2 4.7 5.5 6.3 6.3 3.4 3.1 4.8 4.6 4.4 3.2 2.8 1.7 1.5 2.5 Poland .. 11.4 10.0 2.5 1.6 2.4 2.1 2.0 5.8 8.6 3.2 5.5 5.3 3.6 1.7 2.2 1.7 2.1 4.6 4.7 Portugal .. 6.0 4.2 3.6 3.6 2.8 4.7 1.8 3.5 2.6 2.4 2.1 -1.8 -3.1 3.6 -1.8 -0.3 1.4 2.0 2.3 Slovak Republic .. 13.2 5.6 8.9 8.1 8.0 9.1 8.0 8.7 6.6 2.6 5.4 2.0 2.6 2.6 1.8 3.1 1.8 4.0 4.7 Slovenia .. 10.5 11.6 8.3 7.7 7.5 6.2 5.6 6.2 7.0 1.8 3.9 1.6 -0.7 0.2 1.3 1.4 2.3 2.6 4.0 Spain 5.6 2.8 3.8 3.5 2.8 2.3 2.9 3.3 4.6 6.7 4.5 0.2 0.7 -1.4 0.3 0.1 0.9 0.1 1.1 1.7 Sweden 4.8 6.8 4.2 3.2 3.7 4.3 3.1 3.1 5.3 3.7 2.7 2.2 3.2 3.0 2.0 2.2 3.5 2.5 3.0 3.0 Switzerland .. 2.4 3.8 1.4 0.1 0.0 2.5 1.7 3.1 1.7 1.0 0.7 1.2 0.8 0.7 -0.5 -0.9 -0.9 0.4 0.8 United Kingdom 5.4 5.7 5.8 2.5 4.8 4.7 3.5 6.0 5.4 0.5 2.3 3.3 1.1 1.7 2.1 0.7 1.2 2.8 2.5 1.5 United States 3.7 6.4 3.3 2.7 3.9 4.8 3.4 3.9 4.2 2.8 0.7 2.9 2.6 2.4 1.1 2.6 2.6 2.1 2.5 3.3 Euro area .. 3.0 3.0 3.0 2.8 2.4 2.4 2.6 3.0 3.5 1.4 1.8 1.8 1.1 1.3 1.4 1.4 1.4 1.8 2.1 Total OECD 5.2 5.1 3.7 2.5 3.2 3.3 3.1 3.2 3.6 3.1 0.8 2.0 2.5 1.9 1.4 2.0 1.9 2.1 2.4 2.7
Source: OECD Economic Outlook 101 database.
2017 2018 2016
2002 2003 2008 2009 2013 2014
STATISTICAL
ANNE
X
OECD
ECONOMIC
OUTLOOK,
V
OLUME
2017
ISSU
E
1
©
OECD
2017
–
PRELIMIN
AR
Y
VERSION
30
Annex Table 20.
Labour force, employment and unemployment
1 2 http://dx.doi.org/10.1787/888933438207 Millions
Labour force
Total of major countries 341.4 345.2 347.1 348.7 351.0 352.6 355.8 359.4 362.4 364.6 364.6 364.5 364.9 367.5 369.1 370.7 372.7 377.0 379.7 382.2 Total of smaller countries 194.8 196.9 199.4 202.6 204.4 208.4 211.5 214.8 218.0 221.5 224.4 227.3 230.3 233.7 236.0 238.9 242.0 244.7 247.5 250.1 Euro area 142.4 143.7 145.2 146.6 148.0 149.3 151.2 152.9 154.5 156.1 156.4 156.5 157.0 158.1 158.4 158.6 158.9 160.2 161.2 162.1 Total OECD 536.2 542.2 546.4 551.3 555.4 561.0 567.3 574.2 580.3 586.1 589.0 591.9 595.2 601.2 605.1 609.6 614.7 621.7 627.2 632.2
Employment
Total of major countries 320.9 325.9 326.9 326.3 327.8 330.2 333.9 338.7 342.7 343.4 335.4 334.9 337.0 340.4 342.9 347.0 351.1 356.4 360.0 363.0 Total of smaller countries 180.7 183.5 185.4 187.6 188.9 192.4 196.0 200.7 204.9 207.8 205.7 207.7 210.8 213.0 214.3 217.8 222.1 225.9 229.5 232.5 Euro area 128.9 131.3 133.4 134.2 134.7 135.6 137.6 140.2 142.9 144.3 141.5 140.7 141.0 140.2 139.4 140.2 141.6 144.2 146.1 147.8 Total OECD 501.5 509.4 512.3 513.9 516.7 522.5 530.0 539.3 547.7 551.2 541.1 542.6 547.8 553.4 557.2 564.8 573.1 582.4 589.5 595.5
Unemployment
Total of major countries 20.6 19.3 20.2 22.3 23.2 22.4 21.9 20.7 19.6 21.3 29.2 29.7 27.9 27.1 26.2 23.7 21.7 20.6 19.6 19.2 Total of smaller countries 14.1 13.4 14.0 15.1 15.5 16.1 15.5 14.1 13.0 13.6 18.7 19.6 19.5 20.8 21.6 21.2 20.0 18.8 18.0 17.6 Euro area 13.5 12.4 11.7 12.4 13.3 13.7 13.7 12.8 11.6 11.8 15.0 15.8 15.9 17.9 19.0 18.4 17.3 16.1 15.0 14.4 Total OECD 34.7 32.8 34.2 37.4 38.7 38.5 37.4 34.8 32.6 34.9 47.9 49.3 47.4 47.8 47.8 44.8 41.6 39.4 37.7 36.8
Source: OECD Economic Outlook 101 database.
2012 2013 2014 2015 2016 2017 2018 2007
2006
2004 2008 2009 2010 2011
2001
2000 2003 2005
STATISTICAL
Note: Labour market data are subject to differences in definitions across countries and to many breaks in series, though the latter are often of a minor nature. 1. Based on National Employment Survey.
Source: OECD Economic Outlook 101 database.
STATISTICAL
In so far as possible, the data have been adjusted to ensure comparability over time and to conform to the guidelines of the International Labour Office. Annual figures are calculated by averaging the monthly and/or quarterly estimates (for both unemployed and the labour force). Further information is available from OECD.stat (http://stats.oecd.org/index.aspx), see the metadata relating to the harmonised unemployment rate.
STATISTICAL ANNEX
OECD ECONOMIC OUTLOOK, VOLUME 2017 ISSUE 1 © OECD 2017 – PRELIMINARY VERSION
33
Annex Table 23.
Quarterly price, cost and unemployment projections
1 2 http://dx.doi.org/10.1787/888933438239
Percentage changes, seasonally adjusted at annual rates
2016 2017 2018 2016 2017 2018
Q4 Q1 Q2 Q3 Q4 Q1 Q2 Q3 Q4
Consumer price index1
Canada 1.4 1.9 2.0 1.7 2.7 2.0 1.6 1.9 2.0 2.1 2.2 2.2 1.4 2.0 2.1 France 0.3 1.3 1.2 1.1 1.8 0.9 1.2 1.2 1.2 1.2 1.2 1.2 0.7 1.3 1.2 Germany 0.4 1.9 1.6 2.7 2.6 1.5 1.2 1.5 1.6 1.7 1.8 1.8 1.0 1.7 1.7 Italy -0.1 1.5 1.3 0.9 3.8 1.1 0.5 0.6 3.0 0.9 0.9 1.0 0.2 1.5 1.4 Japan -0.1 0.6 1.0 2.4 -0.1 0.7 0.8 1.0 1.0 1.0 1.0 1.0 0.3 0.6 1.0 United Kingdom 0.6 2.8 2.7 2.2 3.7 3.1 3.0 2.8 2.6 2.5 2.4 2.3 1.2 3.2 2.4 United States 1.3 2.5 2.2 3.0 3.1 2.1 2.1 2.1 2.2 2.2 2.3 2.3 1.8 2.4 2.2 Euro area 0.2 1.7 1.4 1.9 3.0 1.2 1.0 1.2 1.8 1.5 1.5 1.6 0.7 1.6 1.6
GDP deflator
Canada 0.6 2.6 1.9 4.3 3.1 2.0 1.5 1.8 2.0 2.1 2.1 2.1 1.8 2.1 2.1 France 0.8 0.9 1.1 0.9 1.2 0.7 1.1 1.1 1.2 1.2 1.2 1.2 0.7 1.0 1.2 Germany 1.4 0.9 1.7 2.4 -1.1 1.6 1.5 1.6 1.7 1.8 1.9 1.9 1.3 0.9 1.8 Italy 0.8 1.2 1.2 1.8 2.5 1.1 0.7 0.5 2.6 0.8 0.7 0.8 0.7 1.2 1.2 Japan 0.3 -0.4 1.0 0.3 -2.2 0.7 0.8 0.9 1.0 1.0 1.1 1.1 0.0 0.0 1.0 United Kingdom 1.7 2.2 1.9 3.2 2.2 2.1 2.0 1.9 1.8 2.0 1.9 1.9 2.8 2.0 1.9 United States 1.3 2.1 2.3 2.1 2.2 2.2 2.2 2.2 2.3 2.3 2.4 2.4 1.6 2.2 2.3 Euro area 0.9 1.2 1.5 1.8 0.7 1.5 1.3 1.3 1.7 1.4 1.5 1.5 0.9 1.2 1.5 Total OECD 1.4 2.0 2.2 3.4 2.0 1.9 0.9 3.4 2.3 2.1 1.0 3.7 1.8 2.1 2.3
Unit labour costs (total economy)
Canada 1.1 1.0 1.9 3.0 0.7 0.6 1.3 1.6 2.0 2.3 2.4 2.5 1.1 1.0 2.3 France 0.9 1.1 1.0 1.1 1.4 0.8 0.9 1.0 1.0 1.0 1.0 1.0 1.0 1.0 1.0 Germany 2.0 1.8 1.2 3.4 1.3 1.1 0.8 0.9 1.1 1.4 1.6 1.7 2.1 1.0 1.4 Italy 1.5 1.1 1.0 2.7 0.9 0.5 0.5 0.7 1.2 1.3 1.3 1.2 1.6 0.6 1.3 Japan 1.3 0.3 0.5 1.0 -1.3 0.5 0.8 0.7 0.4 0.2 0.3 0.5 0.6 0.2 0.4 United Kingdom 1.9 2.0 1.5 -0.9 1.6 4.6 1.6 1.4 -1.9 5.2 1.6 1.7 2.2 2.3 1.6 United States 2.3 1.9 2.2 -2.8 2.9 3.5 2.6 2.5 1.9 1.7 1.9 2.0 0.8 2.9 1.9 Euro area 1.3 1.2 1.2 1.8 1.2 1.1 0.9 1.1 1.2 1.3 1.4 1.4 1.3 1.1 1.3 Total OECD 2.0 1.7 1.7 0.2 1.7 2.6 2.0 1.9 1.4 1.7 1.6 1.6 1.6 2.0 1.6
Unemployment Per cent of labour force
Canada 7.0 6.5 6.1 6.9 6.7 6.5 6.4 6.3 6.3 6.2 6.1 6.0 France 10.0 9.7 9.6 9.9 9.8 9.7 9.7 9.7 9.7 9.6 9.6 9.5 Germany 4.2 3.8 3.7 4.0 3.9 3.8 3.8 3.8 3.8 3.8 3.7 3.7 Italy 11.7 11.5 11.2 11.9 11.7 11.5 11.4 11.4 11.3 11.2 11.2 11.1 Japan 3.1 2.8 2.7 3.1 2.8 2.8 2.8 2.8 2.8 2.7 2.7 2.7 United Kingdom 4.9 4.8 5.3 4.8 4.6 4.7 4.8 4.9 5.0 5.2 5.3 5.5 United States 4.9 4.6 4.3 4.7 4.7 4.6 4.6 4.5 4.4 4.3 4.3 4.2 Euro area 10.0 9.3 8.9 9.7 9.5 9.4 9.2 9.1 9.0 8.9 8.8 8.7 Total OECD 6.3 6.0 5.8 6.2 6.1 6.0 6.0 5.9 5.9 5.8 5.8 5.7
Note:
1. For the United Kingdom, the euro area countries and the euro area aggregate, the Harmonised Index of Consumer Prices (HICP) is used. Source: OECD Economic Outlook 101 database.
2016 2017 2018
The adoption of national accounts systems has been proceeding at an uneven pace among countries, both with respect to variables and the time period covered. As a consequence, there are breaks in many national series. For further information, see table National Accounts Reporting Systems, base years and latest data updates at the beginning of the Statistical Annex.
STATISTICAL
STATISTICAL
ANNE
X
OECD
ECONOMIC
OUTLOOK,
V
OLUME
2017
ISSU
E
1
©
OECD
2017
–
PRELIMIN
AR
Y
VERSION
36
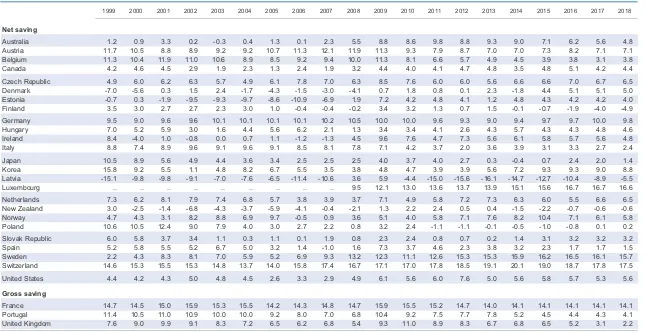
Annex Table 26.
Household saving rates
1 2 http://dx.doi.org/10.1787/888933438261
Per cent of disposable household income
Net saving
Australia 1.2 0.9 3.3 0.2 -0.3 0.4 1.3 0.1 2.3 5.5 8.8 8.6 9.8 8.8 9.3 9.0 7.1 6.2 5.6 4.8 Austria 11.7 10.5 8.8 8.9 9.2 9.2 10.7 11.3 12.1 11.9 11.3 9.3 7.9 8.7 7.0 7.0 7.3 8.2 7.1 7.1 Belgium 11.3 10.4 11.9 11.0 10.6 8.9 8.5 9.2 9.4 10.0 11.3 8.1 6.6 5.7 4.9 4.5 3.9 3.8 3.1 3.8 Canada 4.2 4.6 4.5 2.9 1.9 2.3 1.3 2.4 1.9 3.2 4.4 4.0 4.1 4.7 4.8 3.5 4.8 5.1 4.2 4.4 Czech Republic 4.9 6.0 6.2 6.3 5.7 4.9 6.1 7.8 7.0 6.3 8.5 7.6 6.0 6.0 5.6 6.6 6.6 7.0 6.7 6.5 Denmark -7.0 -5.6 0.3 1.5 2.4 -1.7 -4.3 -1.5 -3.0 -4.1 0.7 1.8 0.8 0.1 2.3 -1.8 4.4 5.1 5.1 5.0 Estonia -0.7 0.3 -1.9 -9.5 -9.3 -9.7 -8.6 -10.9 -6.9 1.9 7.2 4.2 4.8 4.1 1.2 4.8 4.3 4.2 4.2 4.0 Finland 3.5 3.0 2.7 2.7 2.3 3.0 1.0 -0.4 -0.4 -0.2 3.4 3.2 1.3 0.7 1.5 -0.1 -0.7 -1.9 -4.0 -4.9 Germany 9.5 9.0 9.6 9.6 10.1 10.1 10.1 10.1 10.2 10.5 10.0 10.0 9.6 9.3 9.0 9.4 9.7 9.7 10.0 9.8 Hungary 7.0 5.2 5.9 3.0 1.6 4.4 5.6 6.2 2.1 1.3 3.4 3.4 4.1 2.6 4.3 5.7 4.3 4.3 4.8 4.6 Ireland 8.4 -4.0 1.0 -0.8 0.0 0.7 1.1 -1.2 -1.3 4.5 9.6 7.6 4.7 7.3 5.6 6.1 5.8 5.7 5.6 4.8 Italy 8.8 7.4 8.9 9.6 9.1 9.6 9.1 8.5 8.1 7.8 7.1 4.2 3.7 2.0 3.6 3.9 3.1 3.3 2.7 2.4 Japan 10.5 8.9 5.6 4.9 4.4 3.6 3.4 2.5 2.5 2.5 4.0 3.7 4.0 2.7 0.3 -0.4 0.7 2.4 2.0 1.4 Korea 15.8 9.2 5.5 1.1 4.8 8.2 6.7 5.5 3.5 3.8 4.8 4.7 3.9 3.9 5.6 7.2 9.3 9.3 9.0 8.8 Latvia -15.1 -9.8 -9.8 -9.1 -7.0 -7.6 -6.5 -11.4 -10.6 3.6 5.9 -4.4 -15.0 -15.6 -16.1 -14.7 -12.7 -10.4 -8.9 -5.5 Luxembourg .. .. .. .. .. .. .. .. .. 9.5 12.1 13.0 13.6 13.7 13.9 15.1 15.6 16.7 16.7 16.6 Netherlands 7.3 6.2 8.1 7.9 7.4 6.8 5.7 3.8 3.9 3.7 7.1 4.9 5.8 7.2 7.3 6.3 6.0 5.5 6.6 6.5 New Zealand 3.0 -2.5 -1.4 -6.8 -4.3 -3.7 -5.9 -4.1 -0.4 -2.1 1.3 2.2 2.4 0.5 0.4 -1.5 -2.2 -0.7 -0.6 -0.6 Norway 4.7 4.3 3.1 8.2 8.8 6.9 9.7 -0.5 0.9 3.6 5.1 4.0 5.8 7.1 7.6 8.2 10.4 7.1 6.1 5.8 Poland 10.6 10.5 12.4 9.0 7.9 4.0 3.0 2.7 2.2 0.8 3.2 2.4 -1.1 -1.1 -0.1 -0.5 -1.0 -0.8 0.1 0.2 Slovak Republic 6.0 5.8 3.7 3.4 1.1 0.3 1.1 0.1 1.9 0.8 2.3 2.4 0.8 0.7 0.2 1.4 3.1 3.2 3.2 3.2 Spain 5.2 5.8 5.5 5.2 6.7 5.0 3.2 1.4 -1.0 1.6 7.3 3.7 4.6 2.3 3.8 3.2 2.3 1.7 1.7 1.5 Sweden 2.2 4.3 8.3 8.1 7.0 5.9 5.2 6.9 9.3 13.2 12.3 11.1 12.6 15.3 15.3 15.9 16.2 16.5 16.1 15.7 Switzerland 14.6 15.3 15.5 15.3 14.8 13.7 14.0 15.8 17.4 16.7 17.1 17.0 17.8 18.5 19.1 20.1 19.0 18.7 17.8 17.5 United States 4.4 4.2 4.3 5.0 4.8 4.5 2.6 3.3 2.9 4.9 6.1 5.6 6.0 7.6 5.0 5.6 5.8 5.7 5.3 5.6
Gross saving
France 14.7 14.5 15.0 15.9 15.3 15.5 14.2 14.3 14.8 14.7 15.9 15.5 15.2 14.7 14.0 14.1 14.1 14.1 14.1 14.1 Portugal 11.4 10.5 11.0 10.9 10.0 10.0 9.2 8.0 7.0 6.8 10.4 9.2 7.5 7.7 7.8 5.2 4.5 4.4 4.3 4.1 United Kingdom 7.6 9.0 9.9 9.1 8.3 7.2 6.5 6.2 6.8 5.4 9.3 11.0 8.9 8.3 6.7 6.8 6.5 5.2 3.1 2.2
Note:
Source: OECD Economic Outlook 101 database.
The adoption of new national account systems has been proceeding at an uneven pace among countries, both with respect to variables and the time period covered. As a consequence, there are breaks in many national series. See table National Accounts Reporting Systems, base years and latest data updates at the beginning of the Statistical Annex. Most countries report household saving on a net basis (i.e. gross saving minus consumption of fixed capital by households and unincorporated businesses). In most countries "households" refer to the household sector plus non-profit institutions servicing households (in some cases referred to as personal saving).
STATISTICAL
ANNE
X
OECD
ECONOMIC
OUTLOOK,
V
OLUME
2017
ISSUE
1
©
OECD
2017
–
PRELIMIN
AR
Y
VERSION
37
Annex Table 27.
Gross national saving
1 2 http://dx.doi.org/10.1787/888933438277 Per cent of nominal GDP
Australia 21.7 21.7 20.6 21.5 21.3 21.5 21.4 21.0 21.8 21.5 21.7 24.3 22.9 23.6 24.8 24.6 24.4 23.9 22.1 21.8 Austria .. .. .. .. .. .. .. .. .. .. .. .. .. .. .. .. .. .. .. .. Belgium 26.9 26.8 27.5 27.7 26.7 26.7 26.5 27.0 27.0 27.6 28.4 27.1 22.5 26.4 24.2 24.7 23.3 23.0 23.4 22.5 Canada 20.1 19.6 21.0 23.6 22.5 21.7 22.0 23.5 24.4 24.5 24.2 24.2 18.4 19.1 20.7 20.8 21.6 21.7 19.6 .. Chile 23.3 22.0 21.1 21.1 21.3 21.5 20.8 22.5 23.3 25.4 25.2 22.7 22.9 24.5 23.0 22.4 21.5 21.5 21.4 20.2 Czech Republic 26.9 28.9 27.2 27.8 27.6 25.5 24.8 25.5 26.5 26.2 27.4 26.2 22.6 22.0 22.4 24.0 23.6 24.6 26.1 26.5 Denmark 23.6 23.0 23.8 24.6 25.6 25.0 25.0 25.4 26.4 27.6 26.7 26.9 22.6 24.6 25.7 25.7 27.4 28.9 28.9 28.2 Estonia 20.9 22.4 21.2 23.8 23.6 22.2 22.9 21.8 23.6 23.9 23.8 22.3 23.1 23.2 26.5 27.2 27.3 26.9 25.3 24.2 Finland 26.0 27.1 28.7 30.7 31.3 30.2 27.3 28.8 28.0 28.4 29.6 27.8 23.2 23.1 22.0 20.6 19.5 19.6 20.0 20.2 France 22.1 23.2 24.0 23.8 23.5 22.4 21.9 22.3 22.0 22.5 23.0 22.7 19.7 20.2 21.0 19.7 19.4 19.3 20.4 20.6 Germany 22.2 22.6 22.1 22.2 22.0 21.8 21.1 23.7 23.5 25.5 27.6 26.5 24.0 25.4 27.3 26.4 26.3 27.2 27.7 27.7 Greece .. .. 17.6 16.8 16.4 15.9 16.4 16.6 12.6 13.9 11.6 8.7 5.8 5.7 4.9 8.6 9.3 9.4 9.8 9.9 Hungary 22.5 22.4 19.7 20.3 20.5 18.8 16.4 17.3 16.7 18.1 16.8 17.8 19.4 20.9 21.3 21.1 24.6 24.7 24.7 .. Ireland .. .. 24.4 24.9 23.4 22.5 24.6 25.4 25.7 26.2 22.8 17.8 14.3 16.1 16.1 17.6 22.0 24.6 31.9 34.7 Israel 22.3 22.7 22.3 21.6 21.2 19.9 20.4 21.8 24.1 25.3 24.6 21.5 22.2 22.0 23.0 21.9 23.3 24.0 24.5 .. Italy 22.1 21.4 21.1 20.5 20.9 21.0 20.0 20.6 19.9 20.2 20.7 18.8 17.0 16.9 17.1 18.1 18.4 18.2 18.0 17.7 Japan 32.0 31.5 30.1 30.2 28.2 27.5 27.8 28.3 28.9 29.0 29.6 27.7 24.3 25.3 24.2 23.6 24.1 24.5 26.8 .. Korea 36.2 37.7 35.5 34.1 32.1 31.6 33.1 35.2 33.4 32.6 33.0 32.8 32.7 34.8 34.7 34.4 34.5 34.5 35.6 35.7 Latvia .. .. 12.9 19.1 19.8 21.0 21.7 20.1 22.7 17.8 20.4 22.4 29.9 21.4 22.1 22.7 21.8 21.2 21.3 21.4 Mexico 19.5 23.0 22.9 23.8 22.3 20.5 21.8 22.1 21.8 22.8 23.7 24.9 23.5 21.2 22.9 23.8 23.5 23.0 25.3 25.9 Netherlands 28.7 27.4 29.1 29.5 27.7 26.5 27.4 28.7 28.2 30.5 30.8 27.6 27.2 28.1 29.4 29.3 28.5 27.0 27.7 27.6 New Zealand 19.0 18.0 18.5 20.0 22.1 21.1 21.7 20.4 17.8 17.3 18.5 15.6 18.4 17.5 17.5 17.4 19.9 19.7 20.6 .. Norway .. .. .. .. .. 32.8 31.6 34.0 38.8 40.3 39.5 41.7 35.4 36.3 38.2 39.0 38.2 39.2 36.9 34.0 Poland 19.9 20.9 20.0 19.3 18.1 16.4 17.2 14.1 16.7 17.7 18.5 18.0 17.2 16.5 17.7 17.7 18.5 19.0 20.6 .. Portugal 20.2 20.6 20.2 17.8 17.9 17.2 16.2 15.4 13.4 12.5 13.0 11.0 10.7 10.8 13.1 13.7 15.4 15.0 14.7 15.4 Slovak Republic 27.0 25.8 25.3 25.0 24.3 23.2 19.4 20.7 21.2 20.6 22.9 22.1 17.7 19.3 19.5 21.3 22.5 22.3 23.3 23.6 Slovenia .. .. 24.4 24.6 25.3 25.5 25.1 25.6 26.3 28.3 28.7 27.4 22.6 21.7 21.6 20.8 23.3 26.0 25.4 26.7 Spain 22.2 22.3 22.5 22.5 22.4 23.1 23.9 23.1 22.5 22.3 21.7 20.4 20.3 19.7 18.6 19.5 20.2 20.4 21.4 22.3 Sweden 24.2 25.2 26.3 27.4 27.8 27.1 28.4 28.4 29.2 31.8 33.2 32.7 27.7 29.6 29.1 28.3 27.6 28.1 28.9 29.8 Switzerland 33.2 34.0 34.6 36.7 34.0 31.4 35.5 35.4 38.4 39.4 34.7 28.0 34.3 39.3 35.0 35.3 35.0 32.9 34.7 .. United Kingdom 18.1 18.6 16.0 16.7 16.4 16.3 16.2 15.7 16.4 15.8 16.1 13.8 11.8 13.2 14.1 12.4 12.3 12.7 13.1 13.5 United States 20.7 21.3 20.7 20.6 19.5 18.1 17.3 17.5 17.9 19.1 17.3 15.4 14.3 15.1 15.7 17.7 18.3 19.2 19.1 18.5
Note: Based on SNA93, SNA08, ESA95 or ESA10.
Source: National accounts of OECD countries database.
2016 2005 2006 2007 2008 2009 2010 2011 2012 2013 2014 2015 2002 2003 2004
STATISTICAL ANNEX
Assets and liabilities are amounts outstanding at the end of the period, in per cent of nominal disposable income. For a more detailed description of the variables, see Sources & Methods of the OECD Economic Outlook (http://www.oecd.org/eco/sources-and-methods.htm).
STATISTICAL
ANNE
X
OECD
ECONOMIC
OUTLOOK,
V
OLUME
2017
ISSUE
1
©
OECD
2017
–
PRELIMIN
AR
Y
VERSION
39
Annex Table 29.
General government total outlays
1 2 http://dx.doi.org/10.1787/888933438298 Per cent of nominal GDP
Australia 34.3 34.6 34.8 34.1 33.4 33.9 33.7 33.6 33.5 34.2 37.1 36.6 35.5 35.9 35.5 35.7 35.8 36.3 36.0 35.7 Austria 52.3 50.7 51.4 51.1 51.4 54.0 51.4 50.5 49.5 50.3 54.5 53.1 51.1 51.5 51.3 52.7 51.7 51.0 50.0 49.6 Belgium 50.1 49.0 49.2 49.5 50.7 48.9 51.6 48.4 48.2 50.3 54.1 53.3 54.5 55.9 55.8 55.1 53.9 53.4 52.4 52.0 Canada 41.9 40.7 41.2 40.5 40.4 39.3 38.6 38.8 38.6 38.9 43.5 43.2 41.7 41.0 40.1 38.6 40.3 40.8 40.2 39.9 Czech Republic 41.2 40.3 42.5 44.3 48.5 42.2 41.9 40.8 39.9 40.2 43.6 43.0 43.1 44.5 42.6 42.2 42.1 39.9 40.1 40.0 Denmark 54.5 52.7 52.8 53.2 53.6 53.0 51.2 49.8 49.6 50.4 56.5 56.7 56.4 58.0 55.8 55.3 54.8 53.6 53.3 52.8 Estonia 40.3 36.4 35.0 36.1 35.2 34.3 34.0 33.6 34.1 39.8 46.0 40.5 37.4 39.3 38.5 38.5 40.4 40.4 40.8 41.0 Finland 51.0 48.0 47.3 48.5 49.4 49.3 49.3 48.3 46.8 48.3 54.8 54.8 54.4 56.2 57.5 58.1 57.0 56.1 55.1 54.2 France 52.1 51.1 51.2 52.3 52.8 52.6 52.9 52.5 52.2 53.0 56.8 56.5 55.9 56.8 57.0 57.3 57.0 56.6 56.1 55.9 Germany 47.8 44.7 46.8 47.2 47.7 46.5 46.3 44.7 42.8 43.6 47.6 47.4 44.8 44.3 44.6 44.3 44.0 44.4 44.5 44.5 Greece 46.2 46.3 45.9 45.7 46.5 47.6 45.5 45.1 47.1 50.9 54.1 52.4 54.2 55.4 62.3 50.6 54.3 49.1 48.6 48.0 Hungary 48.4 46.8 46.7 50.4 48.7 48.4 49.4 51.1 49.5 48.4 50.2 49.2 49.4 48.2 48.8 48.6 49.7 47.3 47.0 47.1 Iceland 41.6 41.2 41.8 43.3 44.7 43.0 41.6 41.1 41.0 55.3 48.4 49.3 45.7 45.4 43.9 45.3 42.9 41.2 40.4 39.9 Ireland 33.9 30.9 32.5 33.1 33.0 33.2 33.3 33.8 35.8 41.8 47.1 65.3 46.0 41.9 39.9 37.9 29.6 28.1 27.5 26.9 Israel 50.2 48.0 50.2 51.2 50.6 47.0 45.9 44.6 42.6 42.2 42.2 41.1 40.5 41.4 41.0 40.7 39.7 39.9 40.3 40.2 Italy 47.4 45.4 47.5 46.8 47.2 46.9 47.1 47.6 46.8 47.8 51.2 49.9 49.4 50.8 51.1 50.9 50.5 49.6 49.0 48.7 Japan 37.1 37.5 36.8 37.0 36.6 35.2 35.1 34.6 34.6 35.6 40.2 39.3 40.2 40.2 40.3 39.8 39.0 38.7 39.0 38.0 Korea 25.7 24.7 26.4 26.1 32.6 29.6 29.5 30.1 29.7 32.0 34.9 31.0 32.3 32.7 31.8 32.0 32.3 32.5 32.5 32.5 Latvia 40.8 37.3 34.8 35.2 33.5 34.8 34.3 36.1 34.0 37.5 43.7 45.0 39.0 37.3 36.9 37.5 37.0 36.3 37.5 37.2 Luxembourg 39.4 37.8 38.3 41.4 43.5 43.8 43.6 39.7 37.8 39.7 45.2 44.2 42.4 44.1 43.3 41.8 41.3 41.2 40.1 39.5 Netherlands 43.5 41.8 43.1 43.9 44.7 43.7 42.3 43.0 42.4 43.6 48.2 48.2 47.0 47.1 46.3 46.2 45.3 43.6 42.7 42.6 New Zealand 39.4 37.5 37.2 36.5 37.0 36.6 37.7 39.0 38.7 40.7 41.8 47.9 44.8 43.7 42.5 41.5 41.4 40.2 39.7 39.2 Norway 47.1 42.0 43.8 46.7 47.9 45.0 42.1 40.8 41.4 40.2 46.1 45.0 43.8 42.9 44.0 45.9 48.8 51.1 50.3 50.6 Poland 43.9 42.1 44.8 45.3 45.7 43.5 44.3 44.6 43.1 44.2 44.9 45.8 43.9 42.8 42.6 42.3 41.6 41.3 41.5 41.9 Portugal 42.6 42.6 44.1 43.7 45.3 46.1 46.7 45.2 44.5 45.3 50.2 51.8 50.0 48.5 49.9 51.8 48.3 45.1 43.9 43.2 Slovak Republic 47.9 52.0 44.4 45.1 39.9 37.8 39.8 38.8 36.3 36.9 44.1 42.1 40.8 40.6 41.4 42.0 45.6 41.6 40.7 39.9 Slovenia 45.8 46.1 47.0 45.8 45.8 45.3 44.9 44.2 42.2 43.9 48.2 49.3 50.0 48.6 60.3 50.1 48.1 45.5 44.4 44.1 Spain 39.9 39.1 38.5 38.6 38.3 38.7 38.3 38.3 39.0 41.1 45.8 45.6 45.8 48.1 45.6 44.9 43.8 42.4 41.4 40.6 Sweden 56.7 53.6 53.0 54.2 54.3 52.9 52.8 51.4 49.7 50.4 53.1 51.3 50.7 51.7 52.3 51.4 50.2 50.1 49.8 49.6 Switzerland 33.9 34.2 33.8 36.3 35.6 35.0 34.0 32.2 30.9 31.2 33.1 32.9 32.9 33.3 34.1 33.8 33.9 34.2 34.3 34.2 United Kingdom 36.0 35.9 37.2 38.2 39.4 40.6 41.7 41.4 41.5 45.3 48.6 48.3 46.6 46.5 44.9 43.7 43.0 42.4 41.9 41.3 United States1 34.3 33.9 35.2 36.3 36.8 36.5 36.6 36.4 37.2 39.7 43.2 43.2 42.0 40.2 38.9 38.2 37.9 38.1 38.1 37.9 Euro area 47.6 45.7 46.7 46.9 47.3 46.9 46.7 46.1 45.3 46.7 50.7 50.6 49.2 49.8 49.8 49.4 48.6 47.9 47.4 47.1 Total OECD 39.3 38.5 39.4 40.0 39.8 39.1 39.1 38.8 38.8 40.7 44.2 43.8 42.9 42.4 41.8 41.3 40.9 40.6 40.4 40.1
Note: Data refer to the general government sector, which is a consolidation of accounts for the central, state and local governments plus social security. 1. These data include outlays net of operating surpluses of public enterprises.
Source: OECD Economic Outlook 101 database.