Performance Summary
Contents
Page
Financial Highlights 2
Financial Review 3
Net Interest Income and Net Interest Margin 5
Non-Interest Income 6
Operating Expenses 7
Provision Charge 7
Balance Sheet 8
Asset Quality 8
Customer Loans 10
Deposits 11
Capital Adequacy Ratio 12
Unrealised Valuation Surpluses 12
Geographical Segment Analysis 13
Business Segment Analysis 14
Comparatives 15
Appendix I: Unaudited Consolidated Profit and Loss Account
Appendix II: Unaudited Consolidated Balance Sheet
Appendix III: Unaudited Balance Sheet of DBS Group Holdings Ltd
Appendix IV: Unaudited Statements of Changes in Shareholders’ Equity
Appendix V: Unaudited Consolidated Cash Flow Statement
Appendix VI: Selected Notes to the Accounts
1. Issuance of Ordinary Shares
2. Loan and Investment Exposures to Malaysia, Indonesia, Thailand, Korea, The Philippines (Regional Countries), Hong Kong and China
3. Non-Performing Loans and Provisions 4. Financial Derivatives
5. Daily Earnings at Risk and Trading Income 6. Dividend
Financial Highlights
DBS Group Holdings Ltd (“DBSH”) prepares its consolidated DBSH Group (“Group”) financial statements in accordance with Singapore Financial Reporting Standards (“FRS”).
In $ millions
3rd Qtr 2004
3rd Qtr 2003
+/(-) %
2nd Qtr 2004
9 Mths 2004
9 Mths 2003
+/(-) %
For the period
Operating income 1,087 1,113 (2) 1,553 3,906 3,145 24
Operating profit before goodwill amortisation
and provisions 596 655 (9) 1,071 2,430 1,786 36
Net profit before taxation 491 405 21 972 2,084 1,040 100
Net profit attributable to members 362 291 24 847 1,697 733 132
Net profit attributable to members (excluding
goodwill amortisation) 472 398 19 957 2,027 1,053 92
At period-end
Shareholders' funds 16,200 14,620 11 16,047 16,200 14,620 11
Interest bearing assets 140,025 135,268 4 141,290 140,025 135,268 4
Customer loans 1/ 67,221 63,902 5 65,053 67,221 63,902 5
Customer deposits 107,008 107,056 - 108,179 107,008 107,056
-Total assets 166,087 160,231 4 168,182 166,087 160,231 4
Per share (in $)
Basic earnings excluding goodwill
amortisation 2/ 1.26 1.07 18 1.56 1.70 0.94 81
Basic earnings 2/ 0.96 0.78 23 1.26 1.40 0.65 115
Diluted earnings 2/ 0.93 0.75 24 1.22 1.35 0.63 114
Net asset value at period-end
(i) based on existing ordinary share capital 10.56 9.56 10 10.47 10.56 9.56 10 (ii) assuming non-voting convertible
preference shares (“CPS”) and non-voting redeemable CPS are converted to
ordinary shares 10.39 9.40 11 10.31 10.39 9.40 11
Performance ratios
(%)
3rd Qtr 2004
3rd Qtr 2003
2nd Qtr 2004
9 Mths 2004
9 Mths 2003 On a GAAP basis
Return on assets 2/ 0.86 0.73 1.09 1.29 0.63
Return on equity 2/ 8.99 8.00 12.08 13.48 6.77
Excluding goodwill amortisation
Return on assets 2/ 1.12 1.00 1.34 1.56 0.91
Return on equity 2/ 11.72 10.93 14.87 16.31 9.73
Efficiency and revenue mix ratios
Cost-to-income ratio (excluding goodwill
amortisation) 45.2 41.2 31.0 37.8 43.2
As a percentage of total operating income:
- net interest income 59.3 52.8 41.9 49.4 55.5
- non-interest income 40.7 47.2 58.1 50.6 44.5
Capital adequacy ratios (at period-end) 3/
- Tier 1 capital 11.8 10.5 11.6 11.8 10.5
- Total capital 15.4 15.2 15.6 15.4 15.2
Notes:
1/ After deducting cumulative provisions.
2/ Earnings per share, return on assets and return on equity were computed on an annualised basis (gains from the sale of investments in Wing Lung Bank and DBS Thai Danu Bank Public Company Limited were not annualised).
Financial Review
DBSH Group’s net profit attributable to members (“NPAM”) was $362 million for third quarter 2004, up 24% over third quarter 2003 and down 57% over second quarter 2004. Excluding the one-time gains of $187 million from sale of the Group’s 10% stake in Wing Lung Bank and $310 million gain from sale of the Group’s 59% stake in DBS Thai Danu Bank Public Company Limited (“DTDB”) in second quarter 2004, NPAM would show a 3% increase over the previous quarter. The increase was driven mainly by growth in non-interest income.
• Operating income of $1.087 billion was 2% lower than third quarter 2003 due mainly to a 16% decline in non-interest income from lower treasury gains and fees from stockbroking and investment banking activities. The decline was significantly offset by a 10% growth in net interest income year on year from higher loan volumes, increased investment in debt securities and a rise in interbank interest rates. Compared to second quarter 2004, operating income (excluding one-time gains) rose 3%, largely due to higher treasury gains and fees from sales of wealth management products.
• Operating expenses rose 7% over third quarter 2003 and 2% over second quarter 2004. Changes in
expenses were mainly due to variable staff costs, which varied in tandem with revenue generation activity. Third quarter 2004 also saw increases in other expenses, a result of higher promotion and marketing activities over the same quarter last year.
• Cost-to-income ratio (excluding goodwill amortisation) was 45.2% for third quarter 2004, compared to 41.2% in third quarter 2003 and 31.0% in second quarter 2004. Excluding one-time gains, cost-to-income ratio would have been 45.6% for the second quarter 2004.
• Provision charge of $17 million was 89% lower compared to third quarter 2003, but 55% higher
compared to second quarter 2004. The lower provision charge against the previous year was mainly due to loan recoveries, improving credit quality and property valuation. The higher quarter-on-quarter provision charge was due to the partial release of general provision in the second quarter following the sale and de-consolidation of DTDB.
Profit and Loss Account 1/
In $ millions
3rd Qtr 2004
3rd Qtr 2003
+/(-) %
2nd Qtr 2004
9 Mths 2004
9 Mths 2003
+/(-) %
Net interest income 645 588 10 651 1,930 1,747 10
Non-interest income 442 525 (16) 902 1,976 1,398 41
Operating income 1,087 1,113 (2) 1,553 3,906 3,145 24
Operating expenses (491) (458) 7 (482) (1,476) (1,359) 9
Operating profit before goodwill
amortisation and provisions 596 655 (9) 1,071 2,430 1,786 36
Goodwill amortisation (110) (107) 3 (110) (330) (320) 3
Operating profit before provisions 486 548 (11) 961 2,100 1,466 43
Provisions (17) (154) (89) (11) (78) (459) (83)
Operating profit 469 394 19 950 2,022 1,007 101
Share of profits less losses of associated
and joint venture companies 22 11 100 22 62 33 88
Net profit before taxation 491 405 21 972 2,084 1,040 100
Taxation (116) (99) 17 (112) (348) (264) 32
Minority interests (13) (15) (13) (13) (39) (43) (9)
Net profit attributable to members 362 291 24 847 1,697 733 132
NPAM excluding goodwill amortisation 472 398 19 957 2,027 1,053 92
Note:
1/ Excluding one-timegains of $497 million, the following profit and loss items would have been: In $ millions
3rd Qtr 2004
3rd Qtr 2003
+/(-) %
2nd Qtr 2004
9 Mths 2004
9 Mths 2003
+/(-) %
Non-interest income 442 525 (16) 405 1,479 1,398 6
DBS Bank (Hong Kong) Limited
For third quarter 2004, net profit after taxation for DBS Bank (Hong Kong) Limited grew 14% over third quarter 2003 to $131 million. The increase was mainly due to lower provision charge, partly offset by lower non-interest income and higher operating expenses. Compared to second quarter 2004, net profit after taxation declined 6% attributable to lower net interest income and higher operating expenses.
• Net interest income was up 3% over third quarter 2003 mainly due to the wider spread between the Prime rate and HIBOR1/ and a 10% rise in customer loans. Compared to second quarter 2004, net interest income decreased 4% due to a narrowing of the Prime-HIBORspread, despite a 2% increase in customer loans.
• Non-interest income in third quarter 2004 declined 16% over third quarter 2003 mainly due to lower income from sales of treasury investment products but was comparable to second quarter 2004.
• Operating expenses were 10% higher compared to third quarter 2003 and 6% higher than second quarter
2004 due to ongoing investments in people and systems to capture business opportunities. A provision, which is not material to the earnings of DBS Bank (Hong Kong) Limited, was made for expenses and potential liabilities relating to the Mei Foo branch safe deposit box incident.
• Provision charge decreased 59% compared to a year ago and 26% over second quarter 2004, in line with the stronger economic environment and property market.
Profit and Loss Account (Based on Hong Kong Generally Accepted Accounting Principles)2/ 3/
In $ millions
3rd Qtr 2004
3rd Qtr 2003
+/(-) %
2nd Qtr 2004
9 Mths 2004
9 Mths 2003
+/(-) %
Net interest income 204 197 3 212 630 582 8 Non-interest income 94 112 (16) 95 298 276 8
Operating income 298 309 (4) 307 928 858 8
Operating expenses (130) (118) 10 (123) (377) (353) 7
Operating profit before provisions 168 191 (12) 184 551 505 9
Provisions (21) (51) (59) (28) (74) (152) (52)
Operating profit 147 140 5 156 477 353 35
Net profit before taxation 151 138 9 160 489 351 39
Net profit after taxation 131 115 14 140 421 291 45
Notes:
1/ HIBOR: Hong Kong Interbank Offer Rate
2/ The exchange rate used for all comparative periods is HK$1 = S$0.2168231.
3/ In the preparation of the consolidated DBSH Group accounts, appropriate adjustments were made to bring DBS Bank (Hong Kong) Limited accounts in line with Singapore Financial Reporting Standards (“FRS”). Under FRS, the contribution from DBS Bank (Hong Kong) Limited was as follows:
In $ millions
3rd Qtr 2004
3rd Qtr 2003
+/(-) %
2nd Qtr 2004
9 Mths 2004
9 Mths 2003
+/(-) %
Net profit before taxation 148 148 - 171 494 351 41
Net Interest Income and Net Interest Margin
Exhibit 1
Group Net Interest Income and Net Interest Margin
2,375
628 634 651 645
588 2,645 2,257 2,039 2,035 2.02
1.871.991.78
1.72 1.81 1.79 1.791.83
2.02 0 500 1,000 1,500 2,000 2,500 3,000
1999 2000 2001 2002 2003 3Q03 4Q03 1Q04 2Q04 3Q04
$ m 0 1 2 3 (% )
Net Interest Income Net Interest Margin (%)
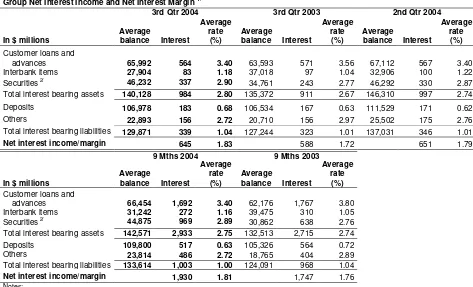
Net interest income grew 10% over third quarter 2003 but declined 1% from second quarter 2004 to $645 million in third quarter 2004.
• The 10% increase in net interest income over third quarter 2003 was largely due to growth in interest bearing assets and continuing efforts in re-balancing the Group’s asset composition by deploying funds away from the lower yielding interbank market to higher yielding customer loans and debt securities. Compared to previous quarter, the 1% decline in net interest income was due to the deconsolidation of DTDB’s net interest income from the third quarter 2004’s numbers. If DTDB’s net interest income was similarly excluded in second quarter 2004, net interest income would have increased 3% quarter-on-quarter. This increase was from Singapore lending operations due to better asset mix, partially offset by a narrowing of the Prime-HIBOR spread in Hong Kong.
• Net interest margin for third quarter 2004 was 1.83%, higher than 1.72% in third quarter 2003 and 1.79% in second quarter 2004. Average interest margins for securities and corporate loans in
Singapore improved amid strong loan competition. The re-balancing of the Group’s asset
[image:6.595.50.300.112.241.2] [image:6.595.51.524.456.743.2]composition also contributed to the overall improvement in net interest margin.
Table 1
Group Net Interest Income and Net Interest Margin 1/
3rd Qtr 2004 3rd Qtr 2003 2nd Qtr 2004
In $ millions
Average balance Interest Average rate (%) Average balance Interest Average rate (%) Average balance Interest Average rate (%) Customer loans and
advances 65,992 564 3.40 63,593 571 3.56 67,112 567 3.40
Interbank items 27,904 83 1.18 37,018 97 1.04 32,906 100 1.22
Securities 2/
46,232 337 2.90 34,761 243 2.77 46,292 330 2.87
Total interest bearing assets 140,128 984 2.80 135,372 911 2.67 146,310 997 2.74
Deposits 106,978 183 0.68 106,534 167 0.63 111,529 171 0.62
Others 22,893 156 2.72 20,710 156 2.97 25,502 175 2.76
Total interest bearing liabilities 129,871 339 1.04 127,244 323 1.01 137,031 346 1.01
Net interest income/margin 645 1.83 588 1.72 651 1.79
9 Mths 2004 9 Mths 2003
In $ millions
Average balance Interest Average rate (%) Average balance Interest Average rate (%) Customer loans and
advances 66,454 1,692 3.40 62,176 1,767 3.80
Interbank items 31,242 272 1.16 39,475 310 1.05
Securities 2/ 44,875 969 2.89 30,862 638 2.76
Total interest bearing assets 142,571 2,933 2.75 132,513 2,715 2.74
Deposits 109,800 517 0.63 105,326 564 0.72
Others 23,814 486 2.72 18,765 404 2.89
Total interest bearing liabilities 133,614 1,003 1.00 124,091 968 1.04
Net interest income/margin 1,930 1.81 1,747 1.76
Notes:
Non-Interest Income
Table 2
Group Non-Interest Income
In $ millions
3rd Qtr 2004
3rd Qtr
2003 +/(-)%
2nd Qtr 2004
9 Mths 2004
9 Mths 2003
+/(-) %
Fee and commission income
Stockbroking 40 59 (32) 44 153 110 39
Investment banking 20 30 (33) 22 68 59 15
Trade and remittances 34 29 17 32 96 83 16
Loan related 45 43 5 47 144 112 29
Deposit related 24 25 (4) 26 75 77 (3)
Credit card 22 24 (8) 21 65 65
Fund management 9 12 (25) 13 33 30 10
Wealth management (unit trust distribution
and bancassurance) 42 26 62 24 100 67 49
Others 11 11 - 11 30 30
Total 247 259 (5) 240 764 633 21
Dividend and rental income 31 25 24 44 88 66 33
Other income
Net gain on treasury related activities
(including structured investment products) 145 215 (33) 101 497 528 (6)
Net gain on investment securities 20 16 25 512 619 155 299
Net gain on fixed assets (1) 1 (200) 3 4 1 300
Others - 9 (100) 2 4 15 (73)
Total 164 241 (32) 618 1,124 699 61
Total non-interest income 442 525 (16) 902 1,976 1,398 41
Non-interest income as a percentage of
operating income (%) 40.7 47.2 58.1 50.6 44.5
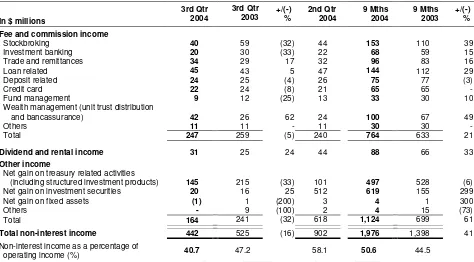
Non-interest income in third quarter 2004 declined 16% over third quarter 2003 and 51% over second quarter 2004 to $442 million. Excluding the $497 million Wing Lung Bank and DTDB disposal gains in the previous quarter, non-interest income for third quarter 2004 was 9% higher.
• Compared to the year-ago quarter, fee and commission income declined 5% to $247 million in third quarter 2004, principally due to lower stockbroking and investment banking fees from quieter regional equity markets. The decline was offset partially by strong growth in wealth management fees following the launch of several new investment products in third quarter 2004 and higher fee income from trade and remittances operations. Compared to the previous quarter, fee and commission income was 3% higher contributed mainly by an increase in wealth management fees.
• Other income was $164 million in third quarter 2004, a fall of 32% from the same quarter last year. Net gain from treasury related activities were lower as third quarter 2003 had strong gains from credit derivative trading and customer business. Excluding the one-time gains from sale of investments in Wing Lung Bank and DTDB, other income increased 36% over the previous quarter. Net gain from treasury related activities were higher contributed by gain from interest rate transactions despite a lack lustre trading environment.
Operating Expenses
Table 3
Group Operating Expenses
In $ millions
3rd Qtr 2004
3rd Qtr 2003
+/(-) %
2nd Qtr 2004
9 Mths 2004
9 Mths 2003
+/(-) %
Staff costs 241 219 10 226 717 648 11
Occupancy expenses 49 48 2 46 141 148 (5)
Technology-related expenses 74 68 9 79 230 213 8
Revenue-related expenses 45 48 (6) 48 147 130 13
Others 82 75 9 83 241 220 10
Total operating expenses 491 458 7 482 1,476 1,359 9
Cost-to-income ratio (%) (excluding goodwill
amortisation) 45.2 41.2 45.61/
43.31/
43.2
Staff headcount number (at period-end) 11,083 12,026 10,838 11,083 12,026
Note:
1/ Excludes one-time gains arising from sale of Wing Lung shares and disposal of DBS Thai Danu Bank Public Company Limited.
• Excluding goodwill amortisation, operating expenses for third quarter 2004 increased 7% to $491 million over third quarter 2003 and 2% over second quarter 2004. The increase was due mainly to higher staff costs, a result of bonus accrual in line with the stronger bottom-line performance this year. Compared to same quarter last year, technology-related expenses and investment spending on advertising and marketing for retails products were higher with increased business initiatives undertaken.
• The staff headcount at end September 2004 was 11,083, an increase of 2% over end June 2004 as
DBS continues to invest in skilled resources to meet its expansion needs.
Provision Charge
Table 4
Group Provision Charge
In $ millions
3rd Qtr 2004
3rd Qtr 2003
+/(-) %
2nd Qtr 2004
9 Mths 2004
9 Mths 2003
+/(-) % Specific provision
Loans
Singapore (18) 62 (129) 13 12 129 (91)
Hong Kong 15 54 (72) 21 53 162 (67)
Other countries - 5 (100) (10) (15) 3 (600)
Sub-Total (3) 121 (102) 24 50 294 (83)
Securities, properties and other assets 4 (5) 180 14 19 88 (78)
Total Specific Provision 1 116 (99) 38 69 382 (82)
General provision 16 38 (58) (27) 9 77 (88)
Total provision charge 17 154 (89) 11 78 459 (83)
SP + GP (loans) /
Average loan (basis point) 7 82 22 18 69
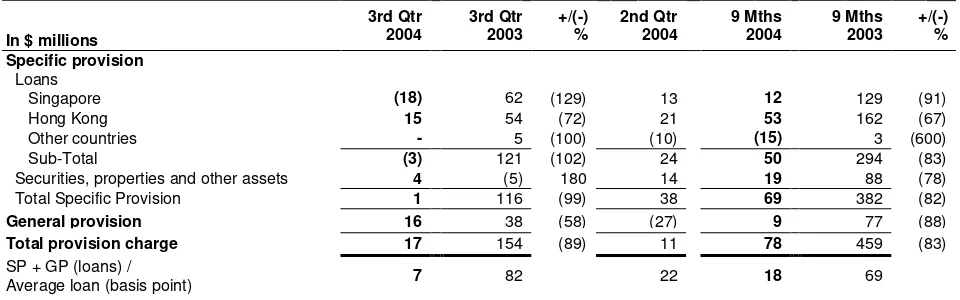
Provision charge was $17 million for third quarter 2004, down 89% from third quarter 2003 but up 55% over second quarter 2004.
• The significantly lower provision charge was due to a net write-back of $3 million specific provision charge for loan losses in third quarter 2004 compared to additional $121 million specific provision charge in third quarter 2003. The reduced charge was supported by an improvement in the overall credit quality of the loan portfolio and significant loan recoveries from Singapore corporate loans in third quarter 2004. Specific provision charge for securities, properties and other assets was $4 million in third quarter 2004 due to impairment loss taken for an equity investment. Compared to second quarter 2004, specific provision for loans and securities were also lower, on the back of stronger economic conditions in Singapore and Hong Kong.
[image:8.595.49.529.423.573.2]Balance Sheet
Table 5
Group Key Balance Sheet Items
In $ millions
Sep 30 2004 Jun 30 2004 Dec 31 2003 Sep 30 2003
Total assets 166,087 168,182 159,595 160,231
Customer loans 1/ 67,221 65,053 64,335 63,902
Customer deposits 107,008 108,179 108,041 107,056
Loan-to-deposit ratio (%) 62.8 60.1 59.5 59.7
Loan and non-trading debt securities-to-deposit ratio (%) 84.2 81.0 79.7 77.6
Note:
1/ After deducting cumulative provisions.
At the end of September 2004, total assets were $166 billion.
• Compared to end June 2004, net customer loans grew 3%. Excluding DTDB in comparative periods, customer loans grew 10% over end September 2003, driven mainly by 22%, 16% and 7% growth in manufacturing, general commerce and housing loans respectively, while loans to the building and construction sector declined 13%. Customer deposits decreased 1% to $107 billion due to maturity of foreign currency deposits not replaced during the quarter.
• The Group’s loan-to-deposit ratio at the end of September 2004 improved to 63%. Including DBSH Group’s portfolio of non-trading debt securities, the ratio of loan and non-trading debt securities to deposits was 84%.
Asset Quality
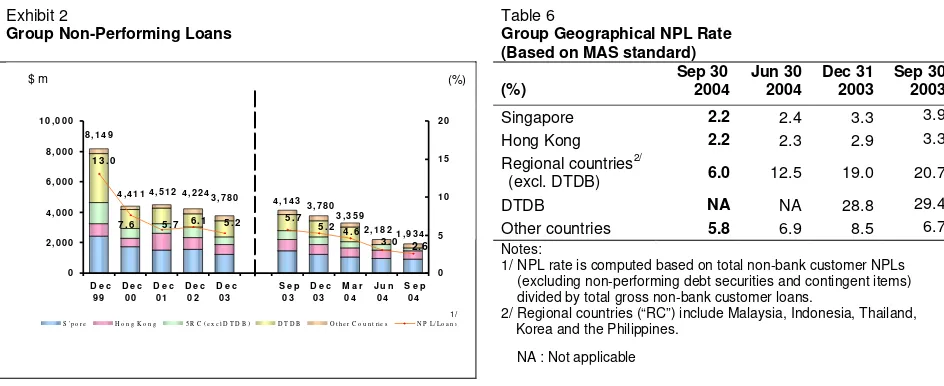
Exhibit 2
Group Non-Performing Loans
Table 6
Group Geographical NPL Rate (Based on MAS standard)
(%) Sep 30 2004 Jun 30 2004 Dec 31 2003 Sep 30 2003
Singapore 2.2 2.4 3.3 3.9
Hong Kong 2.2 2.3 2.9 3.3
Regional countries2/
(excl. DTDB) 6.0 12.5 19.0 20.7
DTDB NA NA 28.8 29.4
Other countries 5.8 6.9 8.5 6.7
4 , 2 2 4
1 , 9 3 4 2 , 1 8 2 3 , 3 5 9 3 , 7 8 0 4 , 1 4 3 3 , 7 8 0 8 , 1 4 9
4 , 4 1 1 4 , 5 1 2
2.6 5 . 2
4 . 6 3 . 0 1 3 . 0
7 . 6 5 . 7 6 . 1 5 . 7 5 . 2
0 2 , 0 0 0 4 , 0 0 0 6 , 0 0 0 8 , 0 0 0 1 0 , 0 0 0
D e c 9 9
D e c 0 0
D e c 0 1
D e c 0 2
D e c 0 3
S e p 0 3
D e c 0 3
M a r 0 4
J u n 0 4
S e p 0 4 0 5 1 0 1 5 2 0
S ' p o r e H o n g K o n g 5 R C ( e x c l D T D B ) D T D B O t h e r C o u n t rie s N P L / L o a n s
Notes:
1/ NPL rate is computed based on total non-bank customer NPLs (excluding non-performing debt securities and contingent items) divided by total gross non-bank customer loans.
2/ Regional countries (“RC”) include Malaysia, Indonesia, Thailand, Korea and the Philippines.
NA : Not applicable
• The volume of non-performing loans (“NPLs”) declined 11% from end of June 2004 to $1.9 billion at the end of September 2004. Out of the $1.9 billion NPLs, $0.5 billion or 24% were restructured NPLs.
• Singapore’s NPLs was $0.9 billion and accounted for 48% of the Group’s NPLs, while Hong Kong’s NPLs of $0.5 billion accounted for 27%.
• The ratio of NPLs to the total non-bank loans (“NPL rate”) further improved from 3% at the end of June 2004 to 2.6% at the end of September 2004. The NPL rates for Singapore, Hong Kong and regional countries operations improved to 2.2%, 2.2% and 6% respectively, at the end of September 2004 due to a reduction in non-bank NPLs and a higher loan base.
(%) $ m
Loan Grading
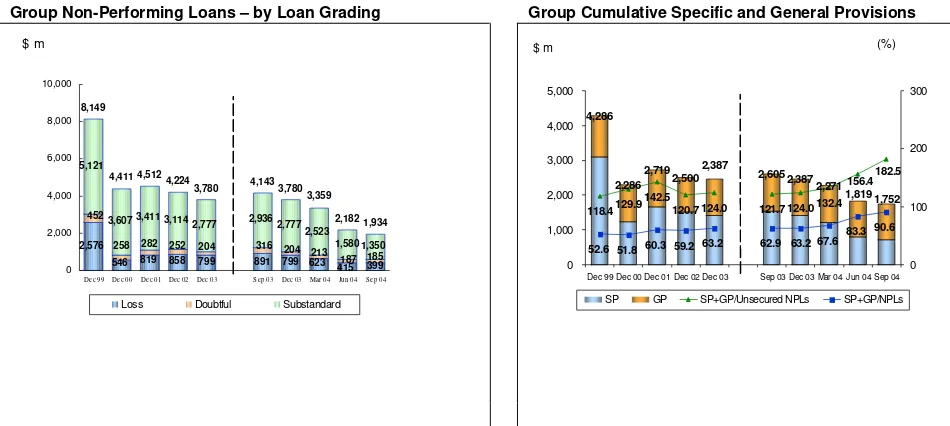
Of the total $1.9 billion NPLs at the end of September 2004, 70% were classified as substandard, 9% as doubtful and the remaining 21% in the loss category. 50% of the NPLs were secured by collateral.
Cumulative Specific and General Provisions
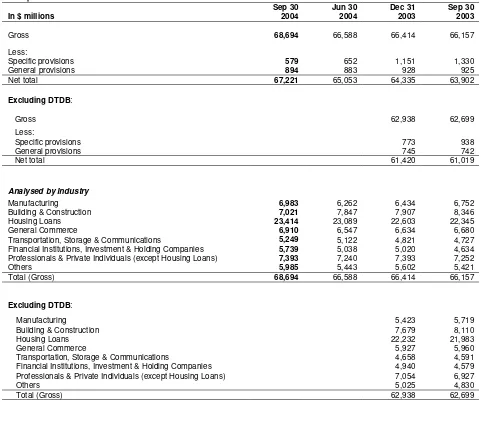
Total cumulative specific and general provisions at the end of September 2004 were 182.5% of unsecured NPLs, and 90.6% of total NPLs.
Exhibit 3
Group Non-Performing Loans – by Loan Grading
Exhibit 4
Group Cumulative Specific and General Provisions
1,752 2,271
1,819 4,286
2,286 2,719
2,500 2,387
2,605 2,387
118.4129.9
142.5
120.7 124.0 121.7 124.0132.4
52.6 51.8 60.3 59.263.2 62.9 67.6
83.3 90.6
156.4182.5
63.2
0 1,000 2,000 3,000 4,000 5,000
Dec 99 Dec 00 Dec 01 Dec 02 Dec 03 Sep 03 Dec 03 Mar 04 Jun 04 Sep 04
0 100 200 300
SP GP SP+GP/Unsecured NPLs SP+GP/NPLs $ m
2,576 282 5,121
3,607 3,411 3,114 2,777 2,9362,777
1,350
546 819 858 799 891 799 623 415 399 185 187 452
258 252 204 316 204
213 2,523
1,580 1,934 3,359 3,780 4,143 3,780 4,224 4,512 4,411 8,149
2,182
0 2,000 4,000 6,000 8,000 10,000
Dec 99 Dec 00 Dec 01 Dec 02 Dec 03 Sep 03 Dec 03 Mar 04 Jun 04 Sep 04
Loss Doubtful Substandard
[image:10.595.51.526.200.413.2]Restructured Loans
Table 7
Loans that were restructured and classified
Sep 30, 2004 Jun 30, 2004 Dec 31, 2003 Sep 30, 2003
In $ millions NPLs
Specific
provisions NPLs
Specific
provisions NPLs
Specific
provisions NPLs
Specific provisions
Substandard 375 33 416 41 1,094 125 1,231 146
Doubtful 13 13 19 17 70 54 68 52
Loss 78 78 77 76 245 243 302 301
Total 466 124 512 134 1,409 422 1,601 499
Table 8
Group Customer Loans
In $ millions
Sep 30 2004
Jun 30 2004
Dec 31 2003
Sep 30 2003
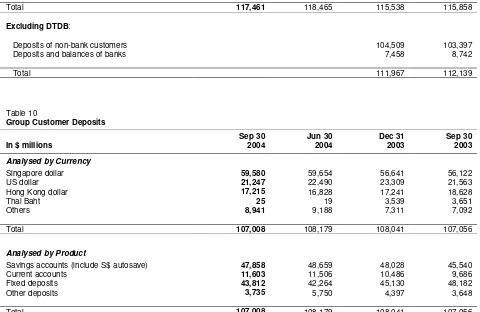
Gross 68,694 66,588 66,414 66,157
Less:
Specific provisions 579 652 1,151 1,330
General provisions 894 883 928 925
Net total 67,221 65,053 64,335 63,902
Excluding DTDB:
Gross 62,938 62,699
Less:
Specific provisions 773 938
General provisions 745 742
Net total 61,420 61,019
Analysed by Industry
Manufacturing 6,983 6,262 6,434 6,752
Building & Construction 7,021 7,847 7,907 8,346
Housing Loans 23,414 23,089 22,603 22,345
General Commerce 6,910 6,547 6,634 6,680
Transportation, Storage & Communications 5,249 5,122 4,821 4,727
Financial Institutions, Investment & Holding Companies 5,739 5,038 5,020 4,634
Professionals & Private Individuals (except Housing Loans) 7,393 7,240 7,393 7,252
Others 5,985 5,443 5,602 5,421
Total (Gross) 68,694 66,588 66,414 66,157
Excluding DTDB:
Manufacturing 5,423 5,719
Building & Construction 7,679 8,110
Housing Loans 22,232 21,983
General Commerce 5,927 5,960
Transportation, Storage & Communications 4,658 4,591
Financial Institutions, Investment & Holding Companies 4,940 4,579
Professionals & Private Individuals (except Housing Loans) 7,054 6,927
Others 5,025 4,830
Total (Gross) 62,938 62,699
Analysed by Currency and Fixed / Variable Rates
Fixed rate 1/
Singapore dollar 9,987 9,424 8,867 8,499
Hong Kong dollar 412 245 262 288
US dollar 24 1 4 3
Thai Baht - - 945 935
Others 296 187 96 73
Sub-total 10,719 9,857 10,174 9,798
Variable rate 2/
Singapore dollar 22,802 21,577 21,026 21,481
Hong Kong dollar 21,433 21,434 20,089 20,584
US dollar 9,817 10,028 8,658 8,313
Thai Baht 22 21 2,393 2,362
Others 3,901 3,671 4,074 3,619
Sub-total 57,975 56,731 56,240 56,359
Total (Gross) 68,694 66,588 66,414 66,157
Notes:
1/ Fixed rate loans refer to long-term loans where the interest rates are fixed for the initial 1 to 3 years for certain mortgage loans, and over the entire loan period for other loans.
Table 9
Total Group Deposits
In $ millions
Sep 30 2004
Jun 30 2004
Dec 31 2003
Sep 30 2003
Deposits of non-bank customers 107,008 108,179 108,041 107,056
Deposits and balances of banks 10,453 10,286 7,497 8,802
Total 117,461 118,465 115,538 115,858
Excluding DTDB:
Deposits of non-bank customers 104,509 103,397
Deposits and balances of banks 7,458 8,742
[image:12.595.50.530.149.461.2]Total 111,967 112,139
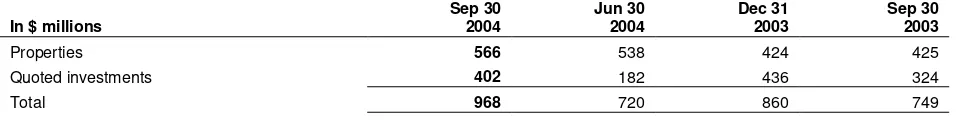
Table 10
Group Customer Deposits
In $ millions
Sep 30 2004
Jun 30 2004
Dec 31 2003
Sep 30 2003
Analysed by Currency
Singapore dollar 59,580 59,654 56,641 56,122
US dollar 21,247 22,490 23,309 21,563
Hong Kong dollar 17,215 16,828 17,241 18,628
Thai Baht 25 19 3,539 3,651
Others 8,941 9,188 7,311 7,092
Total 107,008 108,179 108,041 107,056
Analysed by Product
Savings accounts (include S$ autosave) 47,858 48,659 48,028 45,540
Current accounts 11,603 11,506 10,486 9,686
Fixed deposits 43,812 42,264 45,130 48,182
Other deposits 3,735 5,750 4,397 3,648
Capital Adequacy Ratio
Exhibit 5
Group Capital Adequacy Ratio
10.5 10.4 11.6 11.8
4.6 4.1 4.0 3.6
15.7 14.4 10.5 10.3 12.2 10.5 4.5 5.2 5.2 4.6 3.5 4.7 15.4 19.2 18.9 17.4
15.5 15.1 15.2 15.1 14.5 15.6
0 5 10 15 20 25 Dec 99 Dec 00 Dec 01 Dec 02 Dec 03 Sep 03 Dec 03 Mar 04 Jun 04 Sep 04 Tier I Tier II
At September 30, 2004, the total Capital Adequacy Ratio (CAR) for DBSH Group was 15.4% based on MAS capital framework (MAS Notice 637) issued on May 28, 2004. Tier 1 CAR was 11.8%.
[image:13.595.49.529.103.499.2]The US$750 million subordinated debt issued which qualifies as Tier II capital would be included in the balance sheet and in CAR from October 1, 2004.
Table 11 Group Capital
In $ millions
Sep 30
2004 2/
Jun 30
2004 2/
Dec 31 2003
Sep 30 2003 Tier I Capital
Paid ordinary/preference shares 1,559 1,557 1,556 1,556
Disclosed reserves/others 16,938 16,806 15,439 15,396
Goodwill (7,043) (7,152) (7,371) (7,489)
11,454 11,211 9,624 9,463
Tier II Capital
Cumulative general provisions 980 914 768 750
Subordinated debts 3,260 3,571 3,531 3,590
Others (700) (657) (38) (69)
3,540 3,828 4,261 4,271
Total Capital 14,994 15,039 13,885 13,734
Risk Weighted Assets 97,502 96,641 92,067 90,542
Notes:
1/ Compared to end December 2001, the reduction in the Tier I CAR ratio was primarily due to the deduction of additional goodwill with DBS' purchase of the DBS Diamond Holdings Limited minority interest.
2/ Ratios for 2004 were computed based on the revised MAS capital framework issued on May 28, 2004. Comparatives for 2003 were not restated to the new basis and were computed using Bank for International Settlements (“BIS”) guidelines.
Unrealised Valuation Surpluses
Table 12
Group Unrealised Valuation Surpluses
In $ millions
Sep 30 2004 Jun 30 2004 Dec 31 2003 Sep 30 2003
Properties 566 538 424 425
Quoted investments 402 182 436 324
Total 968 720 860 749
Unrealised valuation surpluses in properties and quoted investment securities not recognised in the accounts amounted to $1.0 billion at the end of September 2004.
(%)
1/
[image:13.595.51.529.613.677.2]Geographical Segment Analysis
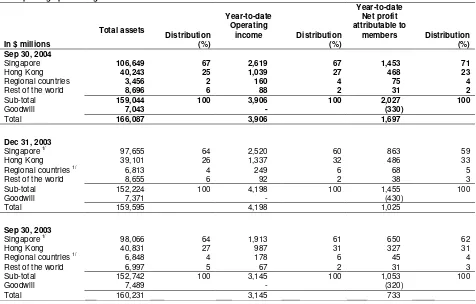
[image:14.595.52.528.164.468.2]The following table analyses total assets, operating income and net profit attributable to members by geographical segments. Unless otherwise stated, the analysis of geographical segments is generally based on the location of the office recording the transactions.
Table 13
Group Geographical Segments
In $ millions
Total assets
Distribution (%)
Year-to-date Operating
income Distribution
(%)
Year-to-date Net profit attributable to
members Distribution
(%) Sep 30, 2004
Singapore 106,649 67 2,619 67 1,453 71
Hong Kong 40,243 25 1,039 27 468 23
Regional countries 3,456 2 160 4 75 4
Rest of the world 8,696 6 88 2 31 2
Sub-total 159,044 100 3,906 100 2,027 100
Goodwill 7,043 - (330)
Total 166,087 3,906 1,697
Dec 31, 2003 Singapore 1/
97,655 64 2,520 60 863 59
Hong Kong 39,101 26 1,337 32 486 33
Regional countries 1/ 6,813 4 249 6 68 5
Rest of the world 8,655 6 92 2 38 3
Sub-total 152,224 100 4,198 100 1,455 100
Goodwill 7,371 - (430)
Total 159,595 4,198 1,025
Sep 30, 2003
Singapore 1/ 98,066 64 1,913 61 650 62
Hong Kong 40,831 27 987 31 327 31
Regional countries 1/
6,848 4 178 6 45 4
Rest of the world 6,997 5 67 2 31 3
Sub-total 152,742 100 3,145 100 1,053 100
Goodwill 7,489 - (320)
Total 160,231 3,145 733
Note:
1/ Special general provisions for exposures outside Singapore and additional provisions for DTDB's loans are booked in Singapore.
DBSH Group operates in four main geographical areas :
• “Singapore”,which includes the operations of the Asian Currency Unit.
• “Hong Kong”, which includes branch and subsidiary operations in Hong Kong.
• “Regional countries”, which includes branch and subsidiary operations in Malaysia, Indonesia, Thailand, South Korea and the Philippines.
• “Rest of the world”, which are mainly branch operations in China, India, Taiwan, United States and United Kingdom.
Business Segment Analysis
The business segment results represent the customer segments of the respective businesses and are determined by:
• Income and direct expenses attributable to each customer and other segment; and
• Management accounting policies relating to the allocation of indirect expenses and funds transfer pricing between the central treasury unit and the customer/other segments.
The various customer segments are described below, along with a description of the change in net profit after taxation for third quarter 2004 over third quarter 2003.
• Consumer Banking
Consumer Banking focuses on providing products and services to individual customers. The products and services offered to customers include credit facilities (mortgage, personal loans, etc.), credit cards, deposit collection, remittance services and asset management products.
The increase in net profit after taxation ($36 million, 43%) was largely due to higher interest income as a result of increased loan volumes and improved net interest margin.
• Enterprise Banking
Enterprise Banking focuses on providing products and services to small and medium enterprises. The products and services offered to customers include credit facilities (overdraft, factoring/accounts receivable purchase, trade financing, commercial/industrial property financing, hire purchase and government financing and assistance schemes), deposit, payment and collection services and treasury products.
The increase in net profit after taxation ($27 million, 48%) was mainly attributable to higher interest income resulting from increased loan volumes and fee income from trade and remittances related activities.
• Investment Banking
Investment Banking caters to the business needs of large corporate customers and financial institutions. The products and services offered to customers include direct lending, advisory banking services, bond issuance, equity financing, syndicated financing, mergers and acquisitions advisory services, debt restructuring advisory services, private equity, nominee and trustee services and cash management services.
The increase in net profit after taxation ($54 million, 70%) was due to significant loan recoveries from Singapore corporate loans.
• Treasury and Markets
Treasury and Markets is primarily involved in market making, structuring and trading of financial products including foreign exchange, securities and interest rate/ credit/ equity/ foreign exchange derivatives. Income from treasury products and services relating to customers of other segments is reflected in the respective customer segments.
The decrease in net profit after taxation ($12 million, 18%) was mainly due to lower gains from credit and interest rate derivatives trading.
The other segments of the analysis are:
• Funding Portfolio
• Central Operations
Central Operations encompasses a range of activities resulting from central corporate decisions and the related income and expenses not attributed to business segments. These include the central treasury unit, funding costs of DBSH Group’s associated and subsidiary companies and gains/losses on properties as well as certain subsidiaries including stock brokerage and asset management.
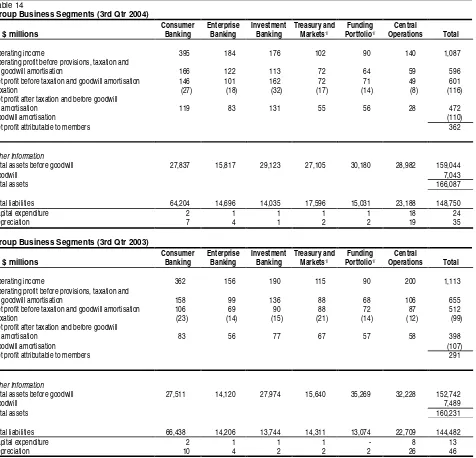
[image:16.595.55.531.166.624.2]The following table analyses the results, total assets and total liabilities by business segments:
Table 14
Group Business Segments (3rd Qtr 2004)
In $ millions
Consumer Banking
Enterprise Banking
Investment Banking
Treasury and Markets1/
Funding Portfolio1/
Central
Operations Total
Operating income 395 184 176 102 90 140 1,087
Operating profit before provisions, taxation and
goodwill amortisation 166 122 113 72 64 59 596
Net profit before taxation and goodwill amortisation 146 101 162 72 71 49 601
Taxation (27) (18) (32) (17) (14) (8) (116)
Net profit after taxation and before goodwill
amortisation 119 83 131 55 56 28 472
Goodwill amortisation (110)
Net profit attributable to members 362
Other Information
Total assets before goodwill 27,837 15,817 29,123 27,105 30,180 28,982 159,044
Goodwill 7,043
Total assets 166,087
Total liabilities 64,204 14,696 14,035 17,596 15,031 23,188 148,750
Capital expenditure 2 1 1 1 1 18 24
Depreciation 7 4 1 2 2 19 35
Group Business Segments (3rd Qtr 2003)
In $ millions
Consumer Banking
Enterprise Banking
Investment Banking
Treasury and Markets1/
Funding Portfolio1/
Central
Operations Total
Operating income 362 156 190 115 90 200 1,113
Operating profit before provisions, taxation and
goodwill amortisation 158 99 136 88 68 106 655
Net profit before taxation and goodwill amortisation 106 69 90 88 72 87 512
Taxation (23) (14) (15) (21) (14) (12) (99)
Net profit after taxation and before goodwill
amortisation 83 56 77 67 57 58 398
Goodwill amortisation (107)
Net profit attributable to members 291
Other Information
Total assets before goodwill 27,511 14,120 27,974 15,640 35,269 32,228 152,742
Goodwill 7,489
Total assets 160,231
Total liabilities 66,438 14,206 13,744 14,311 13,074 22,709 144,482
Capital expenditure 2 1 1 1 - 8 13
Depreciation 10 4 2 2 2 26 46
Note:
1/ Operating expenses have been determined by pro-rating between Treasury and Markets and the Funding Portfolio based on the share of operating income.
Comparatives
DBS GROUP HOLDINGS LTD AND ITS SUBSIDIARY COMPANIES
Unaudited Consolidated Profit and Loss Account
In $ millions
3rd Qtr 2004
3rd Qtr 2003
+/(-) %
2nd Qtr 2004
9 Mths 2004
9 Mths 2003
+/(-) %
Interest income 984 911 8 997 2,933 2,715 8
Less: Interest expense 339 323 5 346 1,003 968 4
Net interest income 645 588 10 651 1,930 1,747 10
Fee and commission income 247 259 (5) 240 764 633 21
Dividends 22 16 38 36 63 41 54
Rental income 9 9 - 8 25 25
-Other income 164 241 (32) 618 1,124 699 61
Operating income 1,087 1,113 (2) 1,553 3,906 3,145 24
Less: Staff costs 241 219 10 226 717 648 11
Depreciation 35 46 (24) 38 117 137 (15)
Other operating expenses 215 193 11 218 642 574 12
Goodwill amortisation 110 107 3 110 330 320 3
Operating expenses 601 565 6 592 1,806 1,679 8
Operating profit before provisions 486 548 (11) 961 2,100 1,466 43
Less: Provision for possible loan losses and
diminution in value of other assets 17 154 (89) 11 78 459 (83)
Operating profit 469 394 19 950 2,022 1,007 101
Add: Share of profits less losses of associated and
joint venture companies 22 11 100 22 62 33 88
Net profit before taxation 491 405 21 972 2,084 1,040 100
Less: Taxation 110 96 15 106 333 257 30
Share of taxation of associated and joint
venture companies 6 3 100 6 15 7 114
Net profit after taxation 375 306 23 860 1,736 776 124
Less: Minority interests 13 15 (13) 13 39 43 (9)
DBS GROUP HOLDINGS LTD AND ITS SUBSIDIARY COMPANIES
Unaudited Consolidated Balance Sheet as at
Sep 30 Jun 30 Dec 31 Sep 30 In $ millions 2004 2004 20031/ 2003
SHARE CAPITAL
Share capital 1,559 1,557 1,556 1,556
RESERVES
Share premium account 2,201 2,181 2,171 2,168 Other reserve 4,271 4,271 4,271 4,271 Capital redemption reserve 28 28 28 28 Capital reserve (15) (8) (30) (11) General reserve 2,230 2,230 2,230 2,044 Revenue reserve 5,926 5,788 4,670 4,564
14,641 14,490 13,340 13,064
SHAREHOLDERS' FUNDS 16,200 16,047 14,896 14,620
MINORITY INTERESTS 1,137 1,124 1,125 1,129
LIABILITIES
Deposits and balances of
banks 10,453 10,286 7,497 8,802 Deposits and other accounts
of non-bank customers 107,008 108,179 108,041 107,056
Bills payable 389 357 363 296
Current taxation 662 618 500 525 Deferred tax liabilities 71 72 104 116 Other liabilities 17,976 19,392 15,772 16,131 Other borrowings and debt
securities in issue 2/ 6,918 6,731 5,604 5,774
- due within one year 2,459 2,259 1,882 2,783 - due after one year 4,459 4,472 3,722 2,991 Subordinated term debts
(unsecured) 5,273 5,376 5,693 5,782 - due within one year - - 25 25 - due after one year 5,273 5,376 5,668 5,757
TOTAL LIABILITIES AND SHAREHOLDERS’
FUNDS 166,087 168,182 159,595 160,231
OFF BALANCE SHEET ITEMS
Contingent liabilities 7,960 7,468 6,984 7,022 Commitments 70,182 67,870 60,173 66,957 Financial derivatives 1,664,247 1,549,064 1,256,240 1,277,970
Notes:
1/ Audited.
2/ Includes secured amount of $1,550 million as at September 30, 2004 (June 30, 2004: $1,497 million; December 31, 2003: $1,106 million; September 30, 2003: $1,502 million). These are mainly secured by properties and securities.
Sep 30 Jun 30 Dec 31 Sep 30 In $ millions 2004 2004 20031/ 2003
ASSETS
Cash, and balances and placements with central
banks 5,699 7,088 5,007 3,645
Singapore Government
securities and treasury bills 13,431 13,627 11,438 11,628 Trading securities 10,980 11,431 6,409 6,144 Balances, placements with,
and loans and advances to
banks 23,176 24,829 27,472 31,067 Bills receivable from non-bank
customers 2,325 1,939 1,481 1,500 Loans and advances to
non-bank customers 64,896 63,114 62,854 62,402 Investment securities 23,985 23,738 22,852 20,405 Associated and joint venture
companies 546 548 547 506
Goodwill 7,043 7,152 7,371 7,489 Fixed assets 1,832 1,856 2,016 2,069 Deferred tax assets 128 118 129 129 Other assets 12,046 12,742 12,019 13,247
DBS GROUP HOLDINGS LTD AND ITS SUBSIDIARY COMPANIES
Unaudited Balance Sheet of DBS Group Holdings Ltd as at
Sep 30 Jun 30 Dec 31 Sep 30 In $ millions 2004 2004 20031/ 2003
SHARE CAPITAL
Share capital 1,559 1,557 1,556 1,556
RESERVES
Share premium account 2,201 2,181 2,171 2,168 Capital redemption reserve 28 28 28 28 Revenue reserve 3,000 3,000 3,001 3,001
5,229 5,209 5,200 5,197
SHAREHOLDERS' FUNDS 6,788 6,766 6,756 6,753
LIABILITIES
Current liabilities 8 9 9 9
Deferred tax liabilities # # # #
TOTAL LIABILITIES AND
SHAREHOLDERS’ FUNDS 6,796 6,775 6,765 6,762
Other Information
Net asset value per ordinary share ($)
(i) Based on existing ordinary
share capital 4.50 4.49 4.53 4.53
4.35 4.35 4.34 4.34 (ii) Assuming non-voting
convertible preference shares (“CPS”) and non-voting redeemable CPS are converted to ordinary shares
Notes:
1/ Audited.
2/ #: Insignificant
Sep 30 Jun 30 Dec 31 Sep 30 In $ millions 2004 2004 20031/ 2003
ASSETS
Balances, placements with, and loans and advances to
non-bank customers 3 3 3 3
Investment in subsidiary
companies 6,793 6,772 6,762 6,759
DBS GROUP HOLDINGS LTD AND ITS SUBSIDIARY COMPANIES
Unaudited Consolidated Statement of Changes in Shareholders' Equity
In $ millions
Share Capital
Share Premium
Other Reserve
Capital Redemption Reserve
Capital Reserve
General Reserve
Revenue Reserve
Total Reserves
Balance at January 1, 2004 1,556 2,171 4,271 28 (30) 2,230 4,670 13,340
Exercise of share options pursuant to the DBSH
Share Option Plan 3 30 30
Net exchange translation adjustments during the
period (3) (3)
Net profit attributable to members 1,697 1,697
Final dividends paid on ordinary and preference
shares for the previous year (199) (199)
Interim dividends paid on ordinary and preference
shares for the current year (224) (224)
Goodwill transferred on disposal of subsidiary
company 18 (18)
-Balance at September 30, 2004 1,5591/ 2,201 4,271 28 (15) 2,230 5,926 14,641
Balance at January 1, 2003 1,555 2,163 4,271 28 (19) 2,044 4,195 12,682
Exercise of share options pursuant to the DBSH
Share Option Plan 1 5 5
Net exchange translation adjustments during the
period 8 8
Net profit attributable to members 733 733
Final dividends paid on ordinary and preference
shares for the previous year (194) (194)
Interim dividends paid on ordinary and preference
shares for the current year (170) (170)
Balance at September 30, 2003 1,556 2,168 4,271 28 (11) 2,044 4,564 13,064
Note:
1/ During the financial period ended September 30, 2004, DBSH issued 19,475,169 ordinary shares upon the conversion of the non-voting convertible preference shares and
DBS GROUP HOLDINGS LTD AND ITS SUBSIDIARY COMPANIES
Unaudited Statement of Changes in Shareholders' Equity of DBS Group Holdings Ltd
In $ millions Share Capital
Share Premium
Capital Redemption Reserve
Revenue Reserve
Total Reserves
Balance at January 1, 2004 1,556 2,171 28 3,001 5,200
Exercise of share options pursuant to the DBSH Share Option Plan 3 30 30
Net profit after taxation 422 422
Final dividends paid on ordinary and preference shares for the
previous year (199) (199)
Interim dividends paid on ordinary and preference shares for the
current year - - - (224) (224)
Balance at September 30, 2004 1,5591/ 2,201 28 3,000 5,229
Balance at January 1, 2003 1,555 2,163 28 3,201 5,392
Exercise of share options pursuant to the DBSH Share Option Plan 1 5 5
Net profit after taxation 164 164
Final dividends paid on ordinary and preference shares for the
previous year (194) (194)
Interim dividends paid on ordinary and preference shares for the
current year - - - (170) (170)
Balance at September 30, 2003 1,556 2,168 28 3,001 5,197 Note:
1/ During the financial period ended September 30, 2004, DBSH issued 19,475,169 ordinary shares upon the conversion of the non-voting convertible preference shares and
DBS GROUP HOLDINGS LTD AND ITS SUBSIDIARY COMPANIES
Unaudited Consolidated Cash Flow Statement
In $ millions
9 Mths 2004
9 Mths 2003
Cash flows from operating activities
Net profit before taxation 2,084 1,040
Adjustments for non-cash items:
Provision for possible loan losses and diminution in value of other assets 78 459
Depreciation of fixed assets 117 137
Goodwill amortisation 330 320
Share of profits of associated and joint venture companies (62) (33)
Net gain on disposal of fixed assets (4) (1)
Net gain on disposal of investment securities (619) (155)
Operating profit before changes in operating assets & liabilities 1,924 1,767
Increase/(Decrease) in:
Deposits and other accounts of non-bank customers 2,401 5,741
Deposits and balances of banks 3,104 3,925
Other liabilities including bills payable 2,266 (87)
(Increase)/Decrease in:
Singapore Government securities and treasury bills (1,993) (2,611)
Trading securities (4,571) (2,472)
Accounts receivable and other assets 162 (3,389)
Balances, placements with, and loans and advances to other banks 4,177 7,681
Loans and advances to non-bank customers including bills receivable (6,209) (3,488)
Tax paid (171) (152)
Net cash generated from operating activities (1) 1,090 6,915
Cash flows from investing activities
Dividends from associated companies 21 32
Purchase of fixed assets (66) (44)
Net increase in investment securities (1,134) (5,735)
Cash of subsidiary company disposed (69)
-Proceeds from disposal of fixed assets 37 60
Acquisition of additional interest in subsidiary companies - (239)
Net cash used in investing activities (2) (1,211) (5,926)
Cash flows from financing activities
Increase/(Decrease) in:
Share capital and share premium 33 6
Debt securities and borrowings 1,232 861
Dividends paid to shareholders of DBSH (423) (364)
Dividends paid to minority shareholders of subsidiary companies (26) (42)
Net cash generated from financing activities (3) 816 461
Exchange translation adjustments (4) (3) 8
Net change in cash, and balances and placements with central banks (1)+(2)+(3)+(4) 692 1,458
Cash, and balances and placements with central banks as at January 1 5,007 2,187
DBS GROUP HOLDINGS LTD AND ITS SUBSIDIARY COMPANIES
Selected Notes to the Accounts
1. Issuance of Ordinary Shares
There were 1,469,965,595 issued and fully paid-up ordinary shares at December 31, 2003. During the 9 months ended September 30, 2004, 22,151,631 ordinary shares were issued upon the conversion of non-voting convertible preference shares and the exercise of executive share options, bringing the total outstanding number of ordinary shares to 1,492,117,226 at September 30, 2004. The weighted average number of ordinary shares was 1,490,996,099 for the third quarter 2004.
Details of issue of new ordinary shares of $1.00 each are as follows:
Particulars
Number of new ordinary shares issued between
July 1, 2004 and September 30, 2004
Number of new ordinary shares that would have been issued upon the conversion/exercise of all outstanding non-voting convertible preference
shares (“CPS”)/non-voting redeemable CPS/executive share options
Sep 30, 2004 Dec 31, 2003 Sep 30, 2003
Conversion of non-voting CPS - 120,436 19,595,605 19,605,059
Conversion of non-voting redeemable CPS - 66,475,374 66,475,374 66,475,374 Exercise of executive share options 1,681,582 48,215,063 46,155,436 47,000,116
2.
Loan and Investment Exposures to Malaysia, Indonesia, Thailand, Korea, The
Philippines (Regional Countries), Hong Kong and China
At September 30, 2004, DBSH Group has exposures to certain countries in the Asia Pacific Region. The exposures are determined based on the location of the credit risk of the customers and counter-parties regardless of where the transactions are booked.
The Group’s net exposure in the 5 Regional Countries was $9.6 billion at September 30, 2004, an increase of 7% compared to June 30, 2004. Exposure to the 5 Regional Countries amounted to 5.8% of the Group’s Total Assets.
The DBSH Group’s exposures (assets and non-performing loans) to the Regional Countries, Hong Kong and China at September 30, 2004 are as follows:
Loans and debt securities Net Exposure
In $ millions
Assets in Bank
Central Banks &
Govt. Securities
Non-Bank 1/
Investments
Less: Intercompany
Loans/ Investments in
Financial Subsidiaries/
Overseas
Branches Amount
As a % of Total
Assets NPLs2/
(a) (b) (c) (d) (e) (f)=(a+b (g)
+c+d-e)
Total Regional Countries 4,825 1,500 3,800 1,193 1,692 9,626 5.8% 205
Malaysia 1,518 295 1,711 89 1,124 2,489 1.5% 145
Indonesia 231 165 649 68 165 948 0.6% 26
Thailand 136 167 85 401 44 745 0.4% 34
Korea 2,875 629 1,267 10 358 4,423 2.7%
-The Philippines 65 244 88 625 1 1,021 0.6%
-Hong Kong 4,036 2,747 25,053 11,734 14,172 29,398 17.7% 516
DBS GROUP HOLDINGS LTD AND ITS SUBSIDIARY COMPANIES
2.
Loan and Investment Exposures to Malaysia, Indonesia, Thailand, Korea, The
Philippines (Regional Countries), Hong Kong and China (Continued)
The DBSH Group’s exposures (assets and non-performing loans) to the Regional Countries, Hong Kong and China at June 30, 2004 are as follows:
Loans and debt securities Net Exposure
In $ millions
Assets in Bank
Central Banks &
Govt. Securities
Non-Bank 1/
Investments
Less: Intercompany
Loans/ Investments in
Financial Subsidiaries/
Overseas
Branches Amount
As a % of Total
Assets NPLs2/
(a) (b) (c) (d) (e) (f)=(a+b (g)
+c+d-e)
Total Regional Countries 4,927 1,064 3,779 1,138 1,896 9,012 5.3% 370
Malaysia 1,404 50 1,662 88 1,140 2,064 1.2% 146
Indonesia 272 206 555 67 247 853 0.5% 32
Thailand 58 17 210 412 44 653 0.4% 188
Korea 3,126 573 1,266 6 463 4,508 2.7%
-The Philippines 67 218 86 565 2 934 0.5% 4
Hong Kong 4,676 3,091 24,735 11,989 14,954 29,537 17.5% 544
China 2,549 18 1,075 65 1,418 2,289 1.4% 120
TOTAL 12,152 4,173 29,589 13,192 18,268 40,838 24.2% 1,034
The DBSH Group’s exposures (assets and non-performing loans) to the Regional Countries, Hong Kong and China at December 31, 2003 are as follows:
Loans and debt securities Net Exposure
In $ millions
Assets in Bank
Central Banks &
Govt. Securities
Non-Bank 1/
Investments
Less: Intercompany
Loans/ Investments in
Financial Subsidiaries/
Overseas
Branches Amount
As a % of Total
Assets NPLs2/
(a) (b) (c) (d) (e) (f)=(a+b (g)
+c+d-e)
Total Regional Countries 5,016 1,104 6,395 955 1,954 11,516 7.3% 1,545
Malaysia 1,280 13 1,356 90 1,034 1,705 1.1% 233
Indonesia 126 56 365 73 128 492 0.3% 55
Thailand (excluding DTDB) 231 9 221 63 214 310 0.2% 188
Korea 3,326 531 885 1 577 4,166 2.6% 17
The Philippines 46 149 103 604 1 901 0.6% 8
DTDB 3/
7 346 3,465 124 - 3,942 2.5% 1,044
Hong Kong 2,457 2,013 23,235 11,935 13,238 26,402 16.5% 643
China 965 24 692 21 393 1,309 0.8% 130
TOTAL 8,438 3,141 30,322 12,911 15,585 39,227 24.6% 2,318
Notes:
1/ Non-bank loans include loans to government and quasi-government entities.
2/ Non-performing loans (“NPLs”) include classified bank loans, debt securities and contingent items.
DBS GROUP HOLDINGS LTD AND ITS SUBSIDIARY COMPANIES
2.
Loan and Investment Exposures to Malaysia, Indonesia, Thailand, Korea, The
Philippines (Regional Countries), Hong Kong and China (Continued)
The DBSH Group’s exposures (assets and non-performing loans) to the Regional Countries, Hong Kong and China at September 30, 2003 are as follows:
Loans and debt securities Net Exposure
In $ millions
Assets in Bank
Central Banks &
Govt. Securities
Non-Bank 1/ Investments
Less: Intercompany
Loans/ Investments in
Financial Subsidiaries/
Overseas
Branches Amount
As a % of Total
Assets NPLs 2/
(a) (b) (c) (d) (e) (f)=(a+b (g)
+c+d-e)
Total Regional Countries 4,597 1,137 6,424 921 1,683 11,396 7.1% 1,636
Malaysia 1,060 8 1,118 95 894 1,387 0.9% 268
Indonesia 115 36 354 75 124 456 0.3% 65
Thailand (excluding DTDB) 43 93 218 64 81 337 0.2% 194
Korea 3,330 545 1,142 2 579 4,440 2.8% 17
The Philippines 42 103 146 582 5 868 0.6% 36
DTDB 3/ 7 352 3,446 103 - 3,908 2.4% 1,056
Hong Kong 2,201 2,237 22,965 12,944 14,077 26,270 16.4% 750
China 995 22 643 - 380 1,280 0.8% 135
TOTAL 7,793 3,396 30,032 13,865 16,140 38,946 24.3% 2,521
Notes:
1/ Non-bank loans include loans to government and quasi-government entities.
2/ Non-performing loans (“NPLs”) include classified bank loans, debt securities and contingent items.
DBS GROUP HOLDINGS LTD AND ITS SUBSIDIARY COMPANIES
3. Non-Performing Loans and Provisions
At September 30, 2004, DBSH Group’s total non-performing loans (“NPLs”) amounted to $1.934 billion. Out of the total NPLs of $1.934 billion, $0.974 billion (50%) were secured by collateral.
Details of DBSH Group’s NPLs and provisions at September 30, 2004 are as follows:
In $ millions Singapore
Hong Kong
Regional Countries2/
Other
Countries Total
Non-Performing Loans 935 516 205 278 1,934
- Substandard 645 370 114 221 1,350
- Doubtful 99 47 1 38 185
- Loss 191 99 90 19 399
NPLs as a % of Group total assets 0.6% 0.3% 0.1% 0.2% 1.2%
Non-bank NPLs as a % of non-bank loans in the
respective countries 1/ 2.2% 2.2% 6.0% 5.8% 2.6%
Total Cumulative Provisions 764 420 340 228 1,752
- Specific provisions 368 178 95 74 715
- General provisions 396 242 245 154 1,037
Total Cumulative Provisions as a % of:
- Group total assets 0.5% 0.3% 0.2% 0.1% 1.1%
- NPLs in the respective countries 82% 81% 167% 82% 91%
- Unsecured NPLs in the respective countries 194% 217% 320% 86% 183%
Details of DBSH Group’s NPLs and provisions at June 30, 2004 are as follows:
In $ millions Singapore
Hong Kong
Regional Countries2/
Other
Countries Total
Non-Performing Loans 965 544 370 303 2,182
- Substandard 672 389 274 245 1,580
- Doubtful 97 46 6 38 187
- Loss 196 109 90 20 415
NPLs as a % of Group total assets 0.6% 0.3% 0.2% 0.2% 1.3%
Non-bank NPLs as a % of non-bank loans in the
respective countries 1/ 2.4% 2.3% 12.5% 6.9% 3.0%
Total Cumulative Provisions 773 425 391 230 1,819
- Specific provisions 382 182 148 82 794
- General provisions 391 243 243 148 1,025
Total Cumulative Provisions as a % of:
- Group total assets 0.5% 0.3% 0.2% 0.1% 1.1%
- NPLs in the respective countries 80% 78% 106% 76% 83%
- Unsecured NPLs in the respective countries 188% 214% 146% 81% 156%
Notes:
1/ Computed based on total non-bank customer NPLs (excluding non-performing debt securities and contingent items) divided by total gross non-bank customer loans.
DBS GROUP HOLDINGS LTD AND ITS SUBSIDIARY COMPANIES
3. Non-Performing Loans and Provisions (Continued)
Details of DBSH Group’s NPLs and provisions at December 31, 2003 are as follows:
Regional Countries2/
In $ millions Singapore
Hong
Kong DTDB 3/ Others
Other
Countries Total
Non-Performing Loans 1,255 643 1,044 501 337 3,780
- Substandard 842 475 839 352 269 2,777
- Doubtful 42 66 20 49 27 204
- Loss 371 102 185 100 41 799
NPLs as a % of Group total assets 0.8% 0.4% 0.7% 0.3% 0.2% 2.4%
Non-bank NPLs as a % of non-bank loans
in the respective countries 1/ 3.3% 2.9% 28.8% 19.0% 8.5% 5.2%
Total Cumulative Provisions 851 418 561 389 168 2,387
- Specific provisions 475 190 378 193 87 1,323
- General provisions 376 228 183 196 81 1,064
Total Cumulative Provisions as a % of:
- Group total assets 0.5% 0.3% 0.4% 0.2% 0.1% 1.5%
- NPLs in the respective countries 68% 65% 54% 78% 50% 63%
- Unsecured NPLs in the respective countries 173% 180% 105% 111% 53% 124%
Details of DBSH Group’s NPLs and provisions at September 30, 2003 are as follows:
Regional Countries2/
In $ millions Singapore
Hong
Kong DTDB 3/ Others
Other
Countries Total
Non-Performing Loans 1,472 750 1,056 580 285 4,143
- Substandard 932 529 893 396 186 2,936
- Doubtful 54 97 10 78 77 316
- Loss 486 124 153 106 22 891
NPLs as a % of Group total assets 0.9% 0.5% 0.7% 0.4% 0.2% 2.6%
Non-bank NPLs as a % of non-bank loans
in the respective countries 1/ 3.9% 3.3% 29.4% 20.7% 6.7% 5.7%
Total Cumulative Provisions 953 465 575 427 185 2,605
- Specific provisions 582 237 392 227 106 1,544
- General provisions 371 228 183 200 79 1,061
Total Cumulative Provisions as a % of:
- Group total assets 0.6% 0.3% 0.4% 0.3% 0.1% 1.6%
- NPLs in the respective countries 65% 62% 54% 74% 65% 63%
- Unsecured NPLs in the respective countries 152% 164% 100% 106% 73% 122%
Notes:
1/ Computed based on total non-bank customer NPLs (excluding non-performing debt securities and contingent items) divided by total gross non-bank customer loans.
2/ Regional countries (“RC”) include Malaysia, Indonesia, Thailand, Korea and the Philippines
DBS GROUP HOLDINGS LTD AND ITS SUBSIDIARY COMPANIES
3. Non-Performing Loans and Provisions (Continued)
Analysis of Non-Performing Loans by Industry
The following table shows the industry breakdown of the non-performing loans of DBSH Group:
September 30, 2004 June 30, 2004 December 31, 2003 September 30, 2003
In $ millions NPLs
Specific
Provisions NPLs
Specific
Provisions NPLs
Specific
Provisions NPLs
Specific Provisions
Customer loans
Manufacturing 409 180 583 234 894 360 884 373
Building and Construction 239 60 251 57 414 98 487 141
Housing Loans 266 73 253 74 333 90 339 89
General Commerce 187 79 187 93 573 287 702 347
Transportation, Storage and
Communications 31 9 45 4 98 25 124 34
Financial Institutions, Investment and
Holding Companies 122 46 128 45 199 65 247 80
Professionals and Private Individuals
(except Housing Loans) 227 103 219 100 276 133 274 150
Others 282 88 351 103 695 165 744 196
Sub-total 1,763 638 2,017 710 3,482 1,223 3,801 1,410
Debt securities 145 65 145 65 184 73 219 107
Contingent items 26 12 20 19 114 27 123 27
Total 1,934 715 2,182 794 3,780 1,323 4,143 1,544
Analysis of Non-Performing Loans by Period Overdue
In $ millions September 30, 2004 June 30, 2004 December 31, 2003 September 30, 2003
Non-default 646 682 1,695 1,633
Default loans 1,288 1,500 2,085 2,510
Less than 3 months 288 387 448 459
3 to 6 months 242 172 256 483
Over 6 months 758 941 1,381 1,568
DBS GROUP HOLDINGS LTD AND ITS SUBSIDIARY COMPANIES
4. Financial Derivatives
Financial derivatives are financial instruments whose characteristics are derived from the underlying assets, or from interest and exchange rates or indices. These include forwards, swaps, futures and options.
The following tables summarise the contractual or underlying principal amounts of derivative financial instruments held or issued for trading and non-trading purposes. The notional or contractual amounts of these instruments indicate the volume of transactions outstanding at the balance sheet date; they do not represent amounts at risk.
In the financial statements, trading derivative financial instruments are revalued on a gross position basis and the unrealised gains or losses are reflected in “Other assets” or “Other liabilities” respectively. Non-trading derivative financial instruments are accounted for on an accrual basis.
September 30, 2004
Trading Non-Trading
In $ millions
Underlying Notional
Positive Fair Value
Negative Fair Value
Underlying Notional
Positive Fair Value
Negative Fair Value
Interest Rate Derivatives 1,269,871 6,299 5,745 20,550 766 249
Foreign Exchange Derivatives 337,607 1,788 1,752 5,265 55 70
Equity Derivatives 12,923 119 495 - -
-Credit Derivatives 15,610 79 117 2,421 37
-Total 1,636,011 8,285 8,109 28,236 858 319
June 30, 2004
Trading Non-Trading
In $ millions
Underlying Notional
Positive Fair Value
Negative Fair Value
Underlying Notional <