Fina nc ia l Pe rform a nc e Sum m a ry For 9 M ont hs 2 0 0 1
9 Months 2000
9 Months 2001
Incr/ (Decr)
Incr/ (Decr) excluding Dao Heng
Profit and Loss Account S$’m S$’m % %
Net interest income 1,559 1,550 (0.6) (10.2)
Non-interest income 653 1,022 56.7 45.2
Fee and commission income 392 425 8.5 (4.5)
Dividends 30 27 (10.3) (14.4)
Rental income 25 28 14.1 13.3
Other income 206 542 163.3 152.4
Income before operating expenses 2,212 2,572 16.3 6.1
Operating expenses (934) (1,219) 30.5 19.1
Staff costs (460) (634) 37.8 25.6
Other operating expenses (474) (585) 23.4 12.8
Operating profit 1,278 1,353 5.9 (3.3)
Goodwill amortisation - (64) NM NM
Provisions (38) (292) 678.5 615.5
Associated companies 29 55 90.7 78.3
Net profit before tax 1,269 1,052 (17.0) (24.8)
Taxation (237) (183) (22.7) (28.9)
Minority interests 10 (39) NM NM
Net profit attributable to members 1,042 830 (20.3) (26.0)
As at Sep 30
2000
As at Sep 30
2001
Incr/ (Decr)
Incr/ (Decr) excluding Dao Heng
S$’m S$’m % %
Key Balance Sheet Data
Total assets 107,269 147,414 37.4 0.1
Customer loans 50,797 67,958 33.8 2.1
Customer deposits 78,235 105,835 35.3 7.4
Shareholders’ funds 10,456 11,184 7.0 7.0
Goodwill - 5,022 NM NM
Key Ratios
Return on Assets (%)@+ 1.30 0.94
Return on Equity (%)@+ 12.83 10.34
Cost-to-Income (%) 42.2 47.4
Loan-to-Deposit (%) 64.9 64.2
@ Annualised
+ Computed on cash basis
Fina nc ia l Pe rform a nc e Sum m a ry For 3
rdQua rt e r 2 0 0 1
Profit and Loss Account
S$’m S$’m % S$’m % S$’m % %
Net interest income 513 588 14.7 150 (14.5) 472 24.6 (7.1)
Non-interest income 210 456 116.7 74 81.1 248 83.9 53.7
Fee and commission income
131 174 32.7 51 (6.2) 133 30.8 (7.6)
Dividends 4 6 48.3 1 16.1 18 (67.8) (74.8)
Rental income 8 9 0.9 - (1.4) 10 (10.4) (12.4)
Other income 67 267 300.3 22 266.7 87 206.2 180.6
Income before operating expenses
723 1,044 44.4 224 13.3 720 45.0 13.8
Operating expenses (340) (470) 38.1 (106) 6.9 (366) 28.5 (0.6)
Staff costs (178) (244) 36.7 (56) 5.3 (177) 38.1 6.4
Other operating expenses
(162) (226) 39.7 (50) 8.6 (189) 19.4 (7.2)
Operating profit 383 574 49.9 118 19.0 354 62.0 28.6
Goodwill
amortisation - (64) NM - NM - NM NM
Provisions 26 (246) NM (24) NM (8) 2,678.9 2,411.3
Associated companies
7 22 218.6 4 165.5 19 12.8 (6.0)
Net profit before tax 416 286 (31.2) 98 (54.8) 365 (21.4) (48.4)
Taxation (76) (42) (44.8) (14) (64.0) (63) (32.8) (56.2)
Net profit after tax 340 244 28.2 84 (52.9) 302 (19.2) (47.0)
Minority interests (2) (43) NM - NA 6 NM NA
Consolidation of Dao Heng
At September 30, 2001, DBS Bank through DBS Diamond Holdings Ltd. had effective holding of 71.6% in Dao Heng Bank Group Limited (DHG). DHG’s contribution was included in DBSH Group’s Profit & Loss Statement from July 1, 2001.
Exhibit 1
Group Net Profit Attributable to Members
436
Profit and Loss
DBSH Group’s net profit attributable to members for 9 months 2001 decreased 20.3% to S$830 million. On a cash basis, DBSH Group’s net profit attributable to members for 9 months 2001 would decrease 14.2% to S$894 million.
Income before operating expenses showed an increase of 16.3%. Excluding DHG’s contribution, income before operating expenses increased by 6.1%, mainly due to higher treasury income and inclusion of profits from sales of shares in The Insurance Corporation of Singapore (ICS) (S$120 million) and Keppel Capital (S$61 million).
Exhibit 2
Group Net Interest Income and Net Interest Margin
1,002
Net Interest Income and Net Interest Margin
Net interest income declined marginally by 0.6% to S$1,550 million for 9 months 2001. Net interest margin decreased to 1.78% as compared to 2.06% for 9 months 2000. The lower net interest margin was due to higher volume of lower- yielding interbank lendings reflecting the weak demand for corporate loans. Intensified market competition also resulted in narrower interest margin for housing loans.
Third quarter 2001 (3Q01) net interest income of S$588 million was 24.6% and 14.7% higher than second quarter 2001 (2Q01) and third quarter 2000 (3Q00) respectively, largely due to the consolidation of DHG.
Table 1
Group Fee and Commission Income
(S$ million) 9M
2000 9M 2001
% Change
Deposit-related 42 72 70.6
Trade-related 55 71 30.3
Loan-related 37 56 52.5
Investment Banking 77 54 (29.7)
Credit Card 25 51 102.8
Fund Management 52 50 (3.9)
Stockbroking 65 31 (52.3)
Others 39 40 1.3
Total 392 425 8.5
Fee-to-Income Ratio (%) 17.7 16.5
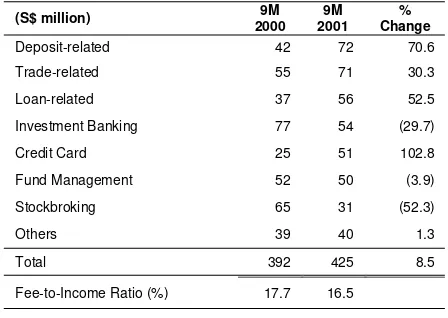
Fee and Commission Income
Fee and commission income increased 8.5% to S$425 million, due mainly to a S$30 million increase in deposit-related fees and a S$19 million increase in loan-related fees. The increase was partially offset by lower investment banking fees and stockbroking fees as a result of weak stock market and capital market condition.
DHG accounted for S$51 million of the increase, mainly from trade-related and credit card fees.
Table 2
Group Other Income
(S$ million) 20009M 20019M Change%
Net gains on treasury activities - foreign exchange
- trading securities and derivatives 86 39
141 158
64.1 306.1 Net gains on sale of government
securities and equities 25 58 130.5 Net gains on disposal of investment
securities 27 135 401.3 Net gains on disposal of fixed assets 4 24 533.5
Others 25 26 4.4
Total 206 542 163.3
Other Income
Other income increased substantially by 163.3% to S$542 million, due to higher gains from treasury activities (S$174 million) and profits from sales of shares in ICS (S$120 million) and Keppel Capital (S$61 million). These increases were partially offset by the loss from sale of K1 Ventures shares (S$18 million). Non-interest income to operating income ratio increased from 29.5% to 39.7% for 9 months 2001.
Non-interest Income to Operating
Table 3
Group Operating Expenses
(S$ million) 9 M 2000 9M 2001 Change%
DBSH Group (excluding DHG)
Staff costs 460 567 23.2
Occupancy expenses 110 120 9.2 Technology-related expenses 99 121 21.9 Professional and consultancy fees 54 44 (18.6)
Others 211 250 18.5
934 1,102 17.9 Restructuring costs - 11 NM Total (excluding DHG) 934 1,113 19.1
DHG - 106 NM
Total 934 1,219 30.5
Cost-to-Income Ratio (%) 42.2 47.4
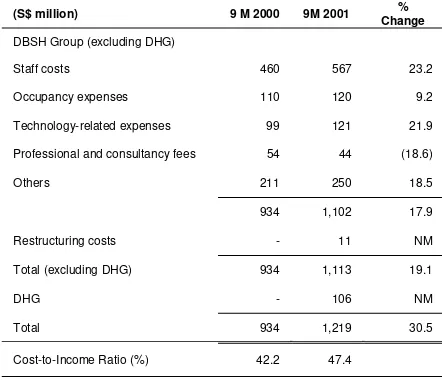
Operating Expenses
Operating expenses increased 30.5% to S$1,219 million, mainly due to higher staff costs of S$107 million and the consolidation of DHG (S$106 million). The increase in staff costs was mainly due to the recruitment of additional staff, salary increments and higher variable bonus provisions on an enlarged pool of staff. In addition, higher technology-related expenses (S$22 million) were incurred for various business initiatives. Restructuring costs of S$11 million were incurred as severance payment to staff due to a rightsizing exercise carried out at DBS Bank.
Excluding DHG’s operating expenses and the restructuring costs, operating expenses showed a smaller increase of 17.9%.
In 3Q01, operating expenses (excluding DHG) decreased by 0.6% compared to 2Q01, resulting from the implementation of various cost control initiatives. Compared to 3Q00, operating expenses (excluding DHG) increased by 6.9%.
Table 4
Group Provisions
(S$ million) 9M
2000 9M 2001
% Change
DBS Bank 25 263 947.9
- Loans
DBS Thai Danu Bank (DTDB) 19 12 (34.4)
DBS China Square 22 16 (26.7)
Others 16 21 27.0
Specific Provisions 82 349 325.8
General Provisions (44) (58) 28.3
Total 38 292 678.5
Provisions
Exhibit 3
Group Non-Performing Loans
0
NBk NPL/NBk Loans
Exhibit 4
Group Non-Performing Loans – by Loan Grading
0 2 0 0 0 4 0 0 0 6 0 0 0
At end-September 2001, bank non-performing loans (NPLs) as a percentage of total non-bank loans stood at 6.0%, an improvement compared to 6.2% at end-June 2001 and 7.6% at end-December 2000. Excluding DHG, non-bank NPLs as a percentage of total non-bank loans would have been 6.4%. This improvement reflects DBSH’s continuous effort in managing its NPLs in an increasingly difficult environment.
Of the total S$4,577 million in NPLs, 71% were in the substandard category and 59% were secured by collateral.
Approximately 9% of the NPLs that had been classified as substandard were “performing” NPLs. These loans were classified due to weak financials although debt servicing was still current.
Exhibit 5
Group Cumulative Specific and General Provisions
2000 3000 4000 5000S$ million
1,894
Cumulative Specific and General Provisions
Total cumulative specific and general provisions at end-September 2001 amounted to 144% of unsecured NPLs, and 59% of total NPLs(or 63% of total NPLs of S$4,268 million under US SEC guidelines).
Based on MAS guidelines, Group loan loss reserve coverage for DBS Thai Danu’s NPLs was
Table 5
Key Balance Sheet Items
(S$ million) Jun 302001 Sep 302000 Sep 302001
% Change
(yoy)
Total Assets 156,497 107,269 147,414 37.4 Customer Loans and
Advances 69,617 50,797 67,958 33.8 Customer Deposits 114,851 78,235 105,835 35.3
Loan-to-Deposit
Ratio (%) 60.6 64.9 64.2
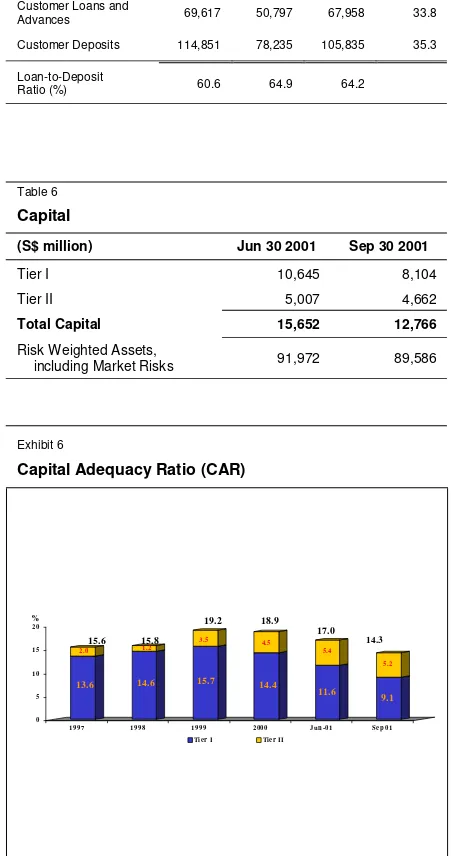
Balance Sheet
The consolidation of DHG contributed to the increase in DBSH Group assets. Total assets were up 37.4% to S$147 billion. Customer loans increased by 33.8% to S$68 billion. Excluding DHG, customer loans increased by S$1 billion despite a weak loan market. Customer deposits registered a 35.3% increase to S$106 billion. Excluding DHG, the increase was S$6 billion. The loan-to-deposit ratio was 64.2%, as compared to 64.9% for 9 months 2000.
Table 6
Capital
(S$ million) Jun 30 2001 Sep 30 2001
Tier I 10,645 8,104
Tier II 5,007 4,662
Total Capital 15,652 12,766
Risk Weighted Assets,
including Market Risks 91,972 89,586
Exhibit 6
Capital Adequacy Ratio (CAR)
13.6 2.0
14.6 1.2
15.7 3.5
14.4 4.5
11.6 5.4
9.1 5.2
0 5 10 15 20
1997 1998 1999 2000 Ju n-01 S e p 01 Ti er I Ti er II
%
15.6 15.8
19.2 18.9
17.0 14.3
Capital Adequacy Ratio (CAR)
Table 7
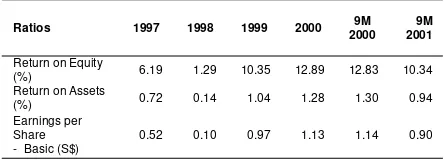
Group Key Financial Indicators
Ratios 1997 1998 1999 2000 9M
2000 9M 2001
Return on Equity
(%) 6.19 1.29 10.35 12.89 12.83 10.34 Return on Assets
(%) 0.72 0.14 1.04 1.28 1.30 0.94 Earnings per
Share - Basic (S$)
0.52 0.10 0.97 1.13 1.14 0.90
Financial Indicators