AUTOMATED MATCHING CROWDSOURCING ROAD NETWORKS USING
PROBABILISTIC RELAXATION
Yunfei Zhanga,b*, Bisheng Yanga,b, Xuechen Luana,b a.
State Key Laboratory of Information Engineering in Surveying, Mapping and Remote Sensing, Wuhan University, Wuhan, China, 430079
b.
Engineering Research Center for Spatio-temporal Data Smart Acquisition and Application, Wuhan University, Wuhan, China, 430079
Commission IV/II, IV/8, IV/1
KEY WORDS: road matching, probabilistic relaxation, data integration, crowdsourcing geospatial data, OpenStreetMap ABSTRACT:
Geospatial data matching is an important prerequisite for data integration, change detection, and data updating. Presently, crowdsourcing geospatial data is drawing great attention with its significant potential for geospatial data updating and Location Based Services, etc. To explore the availabilities of crowdsourcing geospatial data, the paper proposes a heuristic probabilistic relaxation road matching method, named PRRM. It starts with an initial probabilistic matrix according to geometric dissimilarities and then integrates the relative compatibility coefficient of neighbouring candidate pairs to update the previous matrix. Finally, the initial 1:1 matching pairs are selected based on probabilities calculated and refined based on the structure similarity of the selected matching pairs, then a matching growing process is implemented to find M: N matching pairs. Two experiments between OpenStreetMap and professional data show that our method achieves good performance in matching crowdsourcing and professional data with non-rigid deviations and inconsistent structures. Moreover, the proposed method is independent on matching direction and could handle 1: 0 (Null), 1: M and M: N matching.
*
1. INTRODUCTION
As the rapid development of sensor technology and the increasingly large amount of spatial and thematic data, data matching is playing more and more important role in data integration, change detection, and data updating. On the one hand, conflation technologies (Saalfeld 1988; Zhang 2009) were developed to integrate heterogeneous datasets into an enriched product by improving positional or semantic accuracy. On the other hand, corresponding objects identification is an essential precondition for change detection and incremental updating (Medioni and Nevatia 1984, Anders and Bobrich 2004). Currently, a new way of collaborative mapping, named Volunteered Geographic Information (VGI) (Goodchild 2007), crowdsourcing (Tapscott and Williams 2007), Neogeography (Turner 2006) or wikification of geographic information (Sui 2008) makes a timely and cost-effective means for geospatial data updating and GIS applications. For one thing, crowdsourcing data is freely available and information-rich, such as Open Street Map (OSM) data; for another, the user-generated content may lack of standard representation or lead to invalid topology. Moreover, the details of OSM data may vary from one area to another one.
A lot of advanced matching methods for road networks have been proposed based on geometric, structure and sematic criterions (Cobb et al. 1998, Xiong and Sperling 2004, Samal et al. 2004, Volz 2006, Mustière and Devogele 2007, Zhang 2009). On the other hand, many studies integrated information theory or approaches of graph matching to update the matching criterions iteratively for global optimization. Walter and Fritsch (1998) searched the best matching with maximum mutual information. Song et al. (2011) proposed a relaxation-based point feature matching approach for vector road data.
Those existing methods effective for professional data sources have difficulties in handling crowdsourcing road networks. Take OSM data for an example. The details of OSM data (Figure1-a) may vary from one area to another one and so does the positional deviation, from several meters to more than 100 meters (Figure 1-b and c). Moreover, the invalid topology and non-standard representation (Figure 1-d) may lead to error matching and missing matching. Hence, matching crowdsourcing data with other professional sources should incorporate multiple measures such as shapes, structures, and local similarities in order to overcome non-rigid deviation and non-standard representations. The probabilistic relaxation matching (Song et al. 2011) brings a promising solution for crowdsourcing road networks which integrated shape and relational measurements to find a consistent labelling for point matching. The method of Song et al. (2011) established 1:1 point correspondence. Nevertheless, 1: 0 (Null)matching and M: N links frequently occur between crowdsourcing road network and professional data.
>100m
<10m
(a)
(b) (c) (d)
OpenStreetMap Data Professional Data
Figure 1. Comparison between OSM data and professional data
This paper thus proposes a probabilistic relaxation road matching (PPRM) method for matching crowdsourcing road network, which extends the work of Zhang et al. (2011). The proposed method firstly starts with an initial probabilistic matrix according to mutual geometric dissimilarities between two road segments and then utilizes the binary relations as evidence to update the probabilistic matrix iteratively. Finally, the matching pairs are selected according to the probabilistic matrix and the structural similarity.
2. PROBABILISTIC RELAXATION ROAD MATCHING The proposed method includes three primary processes, namely, initialization, relaxation and selection:
Initialization: including candidate road detection and the initial probability calculation
Relaxation: including the compatibility coefficient modelling and the probabilistic matrix updating.
Selection: mainly including structural similarity calculation, robust matching pair selection and matching growing.
Let two road networks be T and R and their road segment sets be ST= {ti | i=1, 2…m} and SR= {rj | j=1, 2…n} respectively. In light of the principle of probabilistic relaxation, each candidate matching pair detected by a buffer operation is assigned to an initial probability according to the geometric dissimilarities. Then, an initial matching matrix P is determined (Section 2.1), of which the element pt,r indicates the assigned probability of road segments of (t, r), or represents 0 when road segments of t
and r are not a candidate matching pair. Suppose that t or r is -1. It indicates that road segment of t or r has no corresponding matching road segments. Then, the relative relations are used to calculate the compatibility coefficient which indicates the support degree of the neighbouring candidate matching pair. The proposed method integrates the compatibility coefficients of all neighbouring candidate matching pairs to update the probabilistic matrix P for a global consistency (Section 2.2). Finally, based on the convergent probabilistic matrix P and the road structures, the final matching roads are selected (Section 2.3).
2.1 Initialization
The deviation between two data sources covering the same area is non-rigid but the candidates of each road segment can approximately be detected by a buffer operator within a specified distance threshold (Zhang 2009). Once the candidates of one road segment are obtained, the geometric dissimilarities between the candidates and the road segment are then calculated. In our proposed method, the distance, direction, and length are selected to measure the dissimilarities between two roads segments. Beeri et al. (2004) defined a probability to measure the matching confidence according to the distance between two objects. Safra et al. (2010) improved it by introducing Null
matching. When matching R to T, a probability of each candidate matching pair is calculated by the method of Safra et al. (2010).
Where dA,B= the dissimilarity indicator of distance, direction, or length between two road segments of A and B. Then, two probabilistic matrices of different matching direction, namely, Ptm×(n+1) andPr(m+1)×n are determined.
DH(A,B)=the Hausdorff distance from A to B
Based on the two probabilistic matrices Ptm×(n+1) and Pr(m+1)×n, the total probability P(m+1)×(n+1) of the dissimilarity indicator of
distance, direction, or length is calculated by
For each dissimilarity indicator of distance, direction and length, a probabilistic matrix will be calculated. To further eliminate the ambiguity of matching results, the probabilistic matrix is formulated by weight average of the probabilistic matrices calculated by the indicator of distance, direction and length, respectively.
2.2 Relaxation
Once the probabilistic matrix is initialized, the values of the probabilistic matrix will be reiteratively updated according to the neighbouring compatibility coefficient. The compatibility coefficient measures the compatible degree of some neighbouring matching pair. The basic principle of probabilistic relaxation is to integrate the compatibilities of all neighbouring matching pairs into a total support value, which is responsible for improving the prior matching probabilistic matrix.
2.2.1 Compatibility coefficient calculation
To calculate the compatibility coefficient, Song et al. (2011) took the relative position difference between candidate matching points into count. As far as road networks are concerned, the proposed method calculates the compatibility coefficient by integrating relative positions and directions of candidate matching road segments.
Figure 2. Compatibility calculation between two neighbouring matching pairs
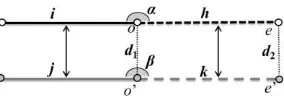
As illustrated in Figure 2, for a candidate matching pair (i, j), the compatibility coefficient of one neighbouring candidate matching pair (h, k) to (i, j) is calculated by the dissimilarity of distance (direction) between two datasets calculated by formula (2)
dis (dir) = the normalized position (direction) matching cases often occur to road networks, which are hardly identified by a threshold of distance or length difference. Hence, the node of e or e’ should be extended along h or k until a calculated at road i to ensure that this virtual vertex splits road i
from the starting point of i at the length of j. Then the compatibility coefficient is calculated by the formula (4). 2.2.2 Probabilistic matrix updating
Once the compatibility coefficients of the neighbouring candidate matching pairs are calculated, the effects of all neighbouring candidate matching pairs should be integrated into a total support value to update the previous probabilistic matrix. Matching T to R or conversely, the neighbouring road segments incident to the starting and ending nodes will be taken into count. As the incomplete matching can hardly be preidentified, the support value of complete matching and incomplete matching are calculated, respectively, of which the larger one will finally be selected.
Figure 3. Support value calculation at FNs and TNs
As illustrated in Figure 3, when matching j to i, the support
q1 = the support value of the candidate matching pairs between SFNs and QFNs∪j
q2 = the support value of the candidate matching pairs between QFNs and i.
Then, qi,FNs, the larger one of q1 and q2, will be the support value at the starting nodes, and vice versa. When calculating the support value at the ending nodes (TNs), the support value of and the maximum value with all roads in the whole dataset.
qA(r)(A, B) (qB(r)(A, B)) is calculated by formula (6) from different matching direction.
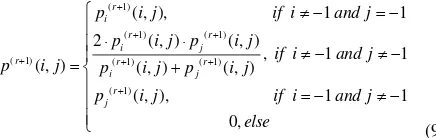
To obtain an optimistic matching result, a relaxation labelling process is then executed to update the probabilistic matrix based on the above support matrix. Similarly, two sub probabilities of different matching directions are calculated by formula (8), of which the convergent is proved in Parent and Zucker (1989).
( ) ( )
Then the final probability in the iteration of r+1 is calculated by
( 1) The iteration terminates when the difference between two successive iterations is less than a specified threshold (e.g., ε<0.0005).
2.3 Selection
1: 1 and 1: M matching pairs can be selected from the probabilistic matrix by row or column (Safra et al. 2010, Song
et al. 2011). However, a lot of road segments without corresponding pairs may be mismatched to the road segments with a maximum probability. To efficiently overcome error matching (False Positive) and missing matching (False Negative), the proposed method selects the final matching pairs based on the following five steps.
Structural similarity calculating
The structural similarity indicates the total matching degree of one candidate matching pair and its neighbouring ones. The proposed method defined it as the sum of their matching probabilities. Hence, the structural similarity of matching pair (i,
j) can be represented by
, ,
i j FNs TNs i j
ST ST ST p (10)
Where STFNs (STTNs) = the structural similarity at the starting (ending) nodes of a matching pair (i, j)
pi, j = the matching probability of matching pair (i, j). To calculate STFNs, the neighbouring road segments of the two road segments i and j incident to the starting nodes are stored as two sets, namely, SFNs and QFNs. Then, the maximum matching combination between SFNs and QFNs. is determined by the KM algorithm (Munkres 1957). STFNs is calculated by the sum of the probabilities of the above maximum matching combination. The calculation of STTNs is the same as that of STFNs.
Robust matching pair selecting
Suppose that the candidate matching road segments of i and j matching pairs are inserted into a queue of M.
Matching pair confliction filtering
As illustrated in Figure 4, for one matching pair Mn= (i, j) of M, one to remove the conflicted matching pair.
Figure 4. Conflicted matching pairs detection
1:1 matching pair detecting
To determine the 1:1 matching pairs, the following conditions are defined
Condition 1: The structural similarities of its starting and ending nodes, namely, STFNs, STTNs are larger than that of the other candidate matched pairs of the two road segments; Condition 2: The neighbouring road segments incident to the starting and ending nodes both have one robust matching pair at least, respectively.
Suppose that one matching pair (i, j) of M meets the above conditions. The matching pair (i, j) is one 1:1 matching, its starting and ending nodes are defined as matched nodes. All the elements of the queue of M will be checked to detect 1:1 matching. The detected 1:1 matching pair is removed from the queue of M.
1:N matching pair detecting
The remain elements of M might be 1: N matching pairs. Suppose that the matching pair of (i, j) is one 1: N matching pair and the starting nodes are not matched nodes. Let road segment of i be the minor length one. As illustrated in Figure 5, the starting node of road segment of i will be extended to find its neighbouring road segments. Then the structural similarities of the neighbouring road segments of G = {g0 , g1,…, gn} and road segment of j are calculated, respectively. The pair (gk, j) with maximum structural similarity is selected as one matching pair and inserted into the queue of M. The above operator is recursively invoked until the matched node of the starting node of road segment of j is found. Then, the ending node of road segment of i is extended to find the matched node of the ending node of road segment of j according to the identical operator.
i
j gk
g0
gn
Figure 5. Matching Growing from unmatched nodes After the above five steps, the elements of the queue of M are checked by the step of Matching pair confliction filtering. The remain elements of the queue of M and the detected 1: 1 matching pairs will be selected as the final matching pairs.
3. EXPERIMENTS
Two test areas, Wuhan in China and Zurich in Switzerland were selected to verify the validities of the proposed method. For each study area, one dataset was downloaded from OpenStreetMap (www.openstreetmap.org) and the other dataset was provided by professional manufacturers. The buffer widths were specified as 200m and 40m for the datasets of Wuhan and Zurich, respectively to find the potential matching pairs of road segments. Then, the probabilistic matrices of the three areas were initialized and the iterative procedure is executed until the changes of the values of all elements of the probabilistic matrix are less than 0.0005.
3.1 Matching Results
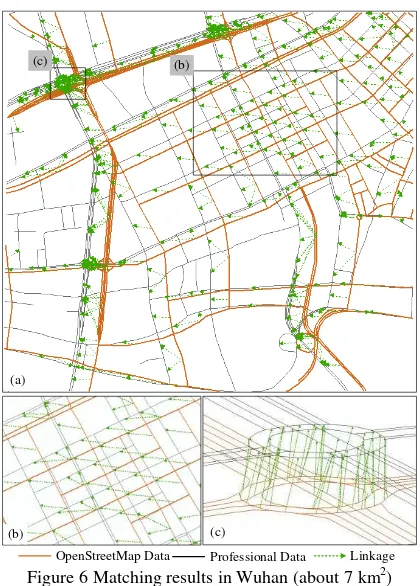
Figure 6-7 illustrate the matching results of Wuhan and Zurich, respectively, where the OSM data and professional data are dotted in brown colour and grey colour, respectively. The linkages from OSM data to professional data are represented in dashed green lines with arrows. The overall matching results of two study areas are shown in Figure 6-a and Figure 7-a respectively. The partial enlarged views are displayed in the other subfigures.
(a)
(c) (b)
(b) (c)
OpenStreetMap Data Professional Data Linkage
Figure 6 Matching results in Wuhan (about 7 km2) As illustrated in Figure 6, the deviation of Wuhan is more than 100m. Buffer operation can approximately detect the candidate roads while it is difficult to determine the real corresponding roads among the roads falling in the buffer region merely by distance, shape or direction measures. The proposed method correctly matches them to their corresponding roads that are not the nearest one. It can be seen from Figure 6-c that the proposed method achieves correct matching results at complicated structures.
Figure 7-b and c show the correct matching between incomplete and inconsistent structures. The results demonstrate that the proposed method matches road network at different levels and complicated structures (e.g., road junctions). It is clear that the
methods based on distances, shapes or directions have difficulties in dealing with these kinds of case as each road segment has almost the identical similarity. However, the proposed method calculates not the similarity but the structural similarities between road segments. Hence, the problems are successfully solved and good matching results were achieved.
(a)
(b) (c)
(b) (c)
OpenStreetMap Data Professional Data Linkage Figure 7 Matching results in Zurich (about 9 km2) 3.2 Matching evaluation
To evaluate the matching results quantitatively, we make a comparison analysis of the results by our method and that of manual matching, which is listed in Table 1 Two evaluation indicators, i.e. Precision and Recall are calculated by
_
100%
_ _
_
100%
_ _
True positive Precision
True positive False positive Ambiguity True positive
Recall
True positive False negative
(12)
Where True_positive = the number of road pairs correctly matched by the proposed method
False_postive = the number of road pairs wrongly matched by the proposed method
Ambiguity= the number of road pairs hardly judged by human inspection
False_negative = the number of road pairs missed by the proposed method.
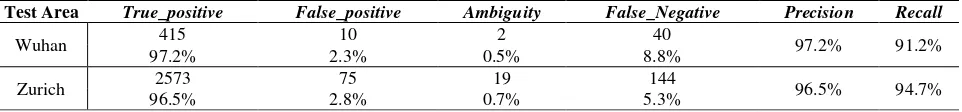
It can be seen from Table 1 that the Precision is more than 96% and the Recall is greater than 90%. Nevertheless, about 5.3%-8.8% of the relevant matches are not efficiently identified. The statistical results demonstrate that the proposed method achieves a good matching precision and most of the real corresponding roads are correctly matched.
Table 1. The statistical matching results according to the proposed method
Test Area True_positive False_positive Ambiguity False_Negative Precision Recall
Wuhan 415 10 2 40 97.2% 91.2%
97.2% 2.3% 0.5% 8.8%
Zurich 2573 75 19 144 96.5% 94.7%
96.5% 2.8% 0.7% 5.3%
4. CONCLUSION
Road network matching is of great importance and value in Navigation, Intelligent Transportation System (ITS), and Location Based Services (LBS), etc. The emerging crowd-sourcing geospatial data (VGI, neogeography and Wikification of GIS) raises considerable challenges for matching datasets of different qualities, resolutions and representations. This paper proposed a heuristic probabilistic relaxation matching method for matching road networks. The proposed method encompasses three key component, initial probability matrix calculation, probability matrix relaxation, and final matching pair selection. Two datasets were selected to demonstrate the validities and effectiveness of the proposed method, which proves that the proposed method achieves a good matching precision more than 95%. The proposed method is independent of matching relation. Matching dataset of A to B or B to A achieves the identical results. Moreover, the proposed method can effectively detect and identify 1: N matching and Null matching. It provides a promising solution for matching crowdsourcing data (e.g., OSM data) and professional data. Further study will focus on the thematic data matching and updating.
ACKNOWLEDGEMENTS
Work described in this paper was jointly supported by the 863 project (No. 2012AA12A211), the Provincial Combination (No. 2009B090300373) of special funding, the project from State Key Laboratory of Resources and Environmental Information Systems, CAS of China (No.2010KF0001SA), and the Fundamental Research Funds for the Central Universities (No. 201161902020015).
REFERENCES
Anders, K. H. and Bobrich J., 2004. MRDB Approach for Automatic Incremental Update. In: ICA Workshop on Generalisation and Multiple Representation, 2004, Leicester, England.
Beeri, C., Kanza, Y., Sara, E., Sagiv Y., 2004. Object Fusion in Geographic Information Systems. In: Proceedings of the 30th International Conference on Very Large Data Bases (VLDB), Toronto, Canada.
Cobb, M. A., Chung, M. J., Foley, H. I., Petry, F. E., and Shaw, K.B, 1998. A Rule-Based Approach for the Conflation of Attributed Vector Data, GeoInformatica, 2(1), 7-35.
Goodchild, M. F., 2007. Citizens as voluntary sensors: Spatial data infrastructure in the World of Web 2.0. International Journal of Spatial Data Infrastructures Research, 2, 24–32. Medioni, G., Nevatia, R., 1984. Matching Images Using Linear Features. IEEE Transactions on Pattern Analysis and Machine Intelligence, 6(6), 675-685.
Munkres, J. A., 1957. Algorithms for assignment and transportation problem.Society for Industrial and Applied Mathematics, 5(1), 32-38.
Mustière, S. and Devogele, T., 2007. Matching Networks with Different Levels of Detail. GeoInformatica, 12(4), 435-453. Parent, P. and Zucker, S.W., 1989. Radial projection: an efficient update rule for relaxation labeling. IEEE Transactions on Pattern Analysis and Machine Intelligence, 11(8), 886-889. Saalfeld, A. J., 1988. Conflation: Automated Map Compilation.
International Journal of Geographical Information Systems, 2(3), 217-228.
Safra, E., Kanza, Y., Sagiv Y., Beeri, C., Doytsher Y., 2010. Location-based algorithms for finding sets of corresponding objects over several geo-spatial data sets. International Journal of Geographical Information Science, 24(1), 69-106.
Samal, A., Seth, S. and Cueto, K., 2004. A feature-based approach to conflation of geospatial sources. International Journal of Geographical Information Science, 18(5), 459-489. Song, W., Keller, J. M., Haithcoat T. M., Davis, C. H., 2011. Relaxation-Based Point Feature Matching for vector map conflation. Transactions in GIS, 15(1), 43-60.
Tapscott D. and Williams A. D., 2007. Wikinomics: How Mass Collaboration Changes Everything, New York: Portofolio Hardcover.
Turner, A., 2006. Introduction to Neogeography. Sebastopol, CA: O’Reilly Media.
Volz, S., 2006. An iterative approach for matching multiple representations of street data. In: Hampe, M., Sester, M., Harrie, L. (Eds.). ISPRS Workshop–Multiple Representation and Interoperability of Spatial Data, Hannover, Germany, 101-110. Walter, V., Fritsch, D., 1999. Matching Spatial Data Sets: A Statistics Approach. International Journal of Geographical Information Science, 13(5), 445-473.
Xiong, D. and Sperling, J., 2004. Semiautomated matching for network database integration. ISPRS Journal of Photogrammetry & Remote Sensing, 59, 35-46.
Zhang, M., 2009. Methods and Implementations of Road-Network Matching. Thesis (PhD). Institute for Photogrammetry and Cartography, Technical University of Munich, Munich, Germany.
Zhang, Y., Yang, B. and Luan, X, 2011. Automated Matching Road Networks Based on Probabilistic Relaxation. In: Proceedings of ISPRS Workshop on Dynamic and Multi-dimensional GIS, Shanghai, China.