RESEARCH ARTICLE
Recommendations for the Assessment of Blend and Content
Uniformity: Modifications to Withdrawn FDA Draft Stratified
Sampling Guidance
Thomas Garcia&James Bergum&James Prescott&Ravindra Tejwani&
Thomas Parks&Jon Clark&William Brown&Fernando Muzzio&
Samir Patel&Charles Hoiberg
#Springer Science+Business Media New York 2014
Abstract
Introduction The following paper describes the International Society for Pharmaceutical Engineering (ISPE)-sponsored Blend Uniformity and Content Uniformity Group’s proposed modifications to the withdrawn FDA draft guidance document for industry“Powder Blends and Finished Dosage Units— Stratified In-Process Dosage Unit Sampling and Assessment.” The modifications targeted FDA’s primary concerns that led to the withdrawal of the draft guidance document, which were insufficient blend uniformity testing and that a one-time pass-ing of the criteria stated inUSP General Chapter <905> Uniformity of Dosage Unitstesting lacks confidence to ensure the content uniformity of a batch.
Method The Group’s approach discusses when triplicate blend samples should be analyzed and the importance of
performing variance component analysis on the data to iden-tify root causes of non-uniformity. The Group recommends the use of statistically based approaches, acceptance criteria, and sampling plans for assessing content uniformity for batch release that provide increased confidence that future samples drawn from the batch will comply with USP <905>. Alternative statistical approaches, sampling plans, and accep-tance criteria, including modern analytical method (e.g., pro-cess analytical technology (PAT)) sampling plans, may be substituted for those mentioned in this paper, with justification. This approach also links blend and content uniformity testing to the three stages of the life cycle process validation approach.
Conclusion A framework for the assessment of blend and content uniformity that provides greater assurance of passing USP <905> is presented.
The views presented in this article by the authors do not necessarily reflect those of their respective companies or organizations.
T. Garcia (*)
Pfizer Worldwide Research and Development, Groton, CT, USA e-mail: [email protected]
J. Bergum
BergumSTATS, Howell, NJ, USA e-mail: [email protected]
J. Prescott
Jenike and Johanson, Inc., Tyngsboro, MA, USA e-mail: [email protected]
R. Tejwani
Bristol-Myers Squibb Company Research and Development, New Brunswick, NJ, USA
e-mail: [email protected]
T. Parks
Eli Lilly and Company, Indianapolis, IN, USA e-mail: [email protected]
S. Patel
Teva Pharmaceuticals, North Wales, PA, USA e-mail: [email protected]
J. Clark
:
W. BrownUnited States Pharmacopeia-National Formulary, Rockville, MD, USA
J. Clark
e-mail: [email protected]
W. Brown
e-mail: [email protected]
C. Hoiberg
Pfizer Inc., Silver Springs, MD, USA e-mail: [email protected]
F. Muzzio
Rutgers University, New Brunswick, NJ, USA e-mail: [email protected]
Keywords Blend uniformity . Dosage unit uniformity . Adequacy of mix . USP <905> Uniformity of Dosage Units
Preface
The authors of this paper recommend that any approach used to demonstrate uniformity of blends and dosage units be science and risk based and that many approaches could be used with justification. A framework for the use of multiple approaches is provided in the following paper, which is intended to propose modifications to the withdrawn FDA draft guidance document for industry“Powder Blends and Finished Dosage Units—Stratified In-Process Dosage Unit Sampling and Assessment”[1]. This paper provides an approach to address the void created by the withdrawal of the draft guid-ance document. The paper focuses on statistical analyses assuming traditional sampling and analytical techniques. The authors do not advocate that the sampling plans, statistical approaches, and acceptance criteria given in this paper be the only way that blend and content uniformity should be assessed. To the contrary, the publication of other statistical approaches that can be used within the framework of this paper is welcomed and encouraged, and it is expected that regulators will consider all science- and risk-based approaches when setting guidance for industry. These other approaches may include alternative statistical analyses, as well as modern analytical methods (including process analytical technology (PAT)) to assess blend and dosage unit uniformity, with justi-fication. However, alternate statistical methods and PAT ap-proaches are not discussed in this paper as they are outside of its intended scope.
Introduction
The FDA announced the withdrawal of its draft guidance doc-ument for industry “Powder Blends and Finished Dosage Units—Stratified In-Process Dosage Unit Sampling and Assessment” on August 7, 2013 [2]. The withdrawal of the document, which was widely used in the pharmaceutical indus-try, resulted in uncertainty for manufacturers that were currently applying it to approved products, as well as to those in devel-opment. FDA stated that Section V (Exhibit/Validation Batch Powder Mix Homogeneity) and Section VII (Routine Manufacturing Batch Testing Methods) of this document were no longer consistent with their current thinking [3]. Although Section V recommended that three replicate samples be taken from at least 10 locations, there was no requirement to test all replicate samples. FDA prefers that all replicate samples be tested, which allows statistical analysis of the data. If the between-location variability is demonstrated to be high, then the blend is not considered to be homogenous. The acceptance
criteria for the Standard and Marginal Criteria Methods in Section VII were based on limits stated in USP General Chapter <905> Uniformity of Dosage Units [4]. However, USP <905> does not use a statistical sampling plan, and there-fore, the results provide limited statistical assurance that future samples from the batch would meet acceptance criteria. As such, FDA no longer supports the approach stated in the withdrawn guidance document nor the use of USP <905> for batch release. This decision resulted in a gap for manufacturers and products that rely on traditional blend and dosage unit uniformity ap-proaches for process validation and commercial batch release.
The International Society for Pharmaceutical Engineering (ISPE) sponsored the Blend Uniformity and Content Uniformity Group (referred to as Group), which was formed in August 2013 to discuss approaches to assess blend and content uniformity. The Group presented a series of talks during a session at the ISPE Annual Meeting (November 6, 2013) covering the current issues associated with blend and content uniformity analysis [5,6]. FDA concerns with current practices and the importance of using statistically sound sam-pling plans and acceptance criteria were discussed. Consideration of the impact that the therapeutic properties of the drug can have on content uniformity acceptance criteria was noted. Substrate from this session was considered when defining the approach presented in this paper.
Modifications to the withdrawn draft stratified sampling guidance document are proposed by the Group to assess “adequacy of mixing to assure uniformity and homogeneity” of the finished product in accordance with Current Good Manufacturing Practices (CGMP) requirement 21 CFR 211.110 [7]. The approaches described in this paper focus on traditional sampling and analytical techniques used in the pharmaceutical industry for the assessment of blend and dos-age unit uniformity. Blend sampling and testing plans are revised to be more explicit (for example, when replicate blend samples should be assayed), and statistical approaches are used for the analysis of dosage form uniformity to provide more confidence that future samples from the batch will comply with USP <905>. For routine manufacture, the pro-posal allows a flexible risk-based approach to define the number of dosage units to be tested. The number selected should balance process capability, consumer’s risk, and pro-ducer’s risk. The approach can be applied to all stages of process validation1 [8]. It can be used for various types of dosage forms for which USP <905> applies, including tablets, capsules (all types), sachets, powder-filled bottles, and in some instances semisolids, regardless of drug loading.
The Group believes that the framework described in this paper satisfies CGMP and application review requirements for in-process and release testing to demonstrate adequacy of the powder mix and uniform content of the dosage units. Multiple approaches, sampling plans, and acceptance criteria can be used within this framework to assess blend and/or dosage unit uniformity, with justification. This includes the following:
& Various statistical approaches that use confidence intervals and/or tolerance intervals that provide assurance of com-plying with USP <905> [9–11]
& The application of process analytical technology (PAT) sensors to determine uniformity of powder mix and blend-ing end points
& The application of PAT and largenacceptance criteria to demonstrate uniformity of dosage units
Modified Approach for the Assessment of Blend and Content Uniformity for Process Design and Process Qualification Batches
Relevant Information from Original Draft Guidance Document
Information contained in Section IV of the original draft stratified sampling guidance document is still applicable to the modified approach. This includes the following:
& The ability to use in-process dosage unit data as a surro-gate measure of blend uniformity during commercial pro-duction (continued process verification).
& The use of in-process dosage unit data obtained during the compression/filling process for the release testing of the finished product.
& The identification of blending parameters and assessment of blend homogeneity throughout the blender and/or in-termediate bulk containers using appropriate sampling plans.
& A recommendation to assess the effects of powder sam-pling size (e.g., 1–10× dosage unit range; sizes >3× can be used with adequate justification) when developing a blend sampling technique and procedure that is capable of mea-suring the true uniformity of the blend. Sampling errors should be identified, which may be negated by the use of in situ analytical techniques using real-time sampling and analysis.
& A recommendation to design blend and dosage unit sam-pling plans and evaluate the data using appropriate statis-tical analysis, such as variance component analysis (VCA) to measure variability present in the results. Sampling plans should include significant events (start-up, end of
run, bin change-over samples) though in relative propor-tion to the overall size of the batch. Drugs that have low dose and/or high potency may require more rigorous sampling plans.
& A recommendation to compare the powder mix uniformi-ty with the in-process dosage unit and finished product content uniformity. If in-process dosage unit uniformity data is used for product release, data analysis should demonstrate that it provides assurance of the content uni-formity of the finished product. Any discrepancies ob-served during process scale-up should be investigated. Corrective actions to improve the formulation or manufacturing process may be necessary.
Blend Sampling and Assessment During Process Design2and Process Qualification Batches
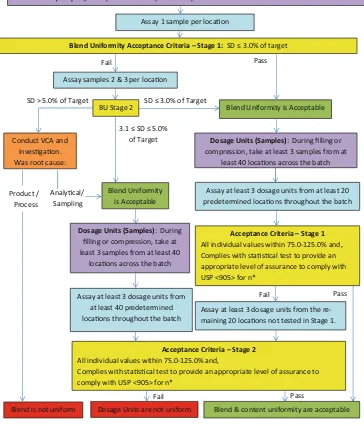
Figure1 contains a flow diagram for the assessment of the adequacy of powder mix and dosage unit uniformity during the manufacture of process design and process qualification batches, based on modifications to the withdrawn draft strat-ified sampling guidance document.
1. At least 3 blend samples should be taken from at least 10 locations in the blender according to the sampling protocol.3
2. Stage 1 blend testing: Assay one sample from each loca-tion. Calculate the standard deviation (SD) for the samples.
(a) If the SD≤3.0 % of target, proceed to stage 1 dosage
unit testing. VCA is generally not required.
(b) If the SD is >3.0 % of target, proceed to stage 2 blend testing.
3. Stage 2 blend testing: Assay the replicate blend samples from each location. Calculate the SD for the samples.
(a) If the SD≤3.0 % of target, proceed to stage 1 dosage unit testing (assay at least 3 dosage units from at least 20 locations).
(b) If the SD is >5.0 % of target, conduct an investiga-tion, including VCA, to determine if the variability was due to a product/process issue or sampling/assay error. Part of this investigation may include a
2Although the strategy described in this section can be applied to batches manufactured during stage 1 process design, the sampling plans, statisti-cal approach, and acceptance criteria may be modified to be phase appropriate.
3
comparison of the blend VCA components with those calculated for the subsequent dosage forms.
i. If the high SD is attributed to a sampling/assay error, proceed to stage 2 dosage unit testing (assay at least 3 dosage units from at least 40 locations).
ii. If the high SD is attributed to a product/process-related cause, the blend uniformity is unacceptable.
(c) If the SD is between 3.1 and 5.0 % of target (inclusive), blend uniformity is acceptable. However, dosage unit testing should be conducted at the stage 2 level to provide increased assurance that the blend produces acceptable dosage forms. It is also recommended that a VCA be
performed for the blend data to identify potential vari-ability reduction and blend improvement opportunities.4
4
Variance component analysis is recommended if the standard deviation for the blend and/or dosage units is >3 %. After performing the VCA, attribute the variability to either variation in the uniformity of the blend and/or other causes depending on if one or both of the variance compo-nents (between and within location) are significant. Significant within-location variance (above that of the analytical method) in the blend data can be an indication of one factor or a combination of factors such as variation of the blend mix, sampling error, or agglomeration. Sampling errors of the blend will not carry over to the dosage units, while variation of the mix at the within-location scale, and/or agglomeration, can carry over to the dosage units. Significant between-location variance (above that of analytical method) in the blend data can indicate that the blending operation is not optimized or that segregation has occurred.
Blend (Samples):Sample at least 3 replicate samples from at least 10 locaons in the blender or drum
Assay 1 sample per locaon
Blend Uniformity Acceptance Criteria – Stage 1: SD ≤ 3.0% of target
Conduct VCA and invesgaon. Was root cause:
Dosage Units (Samples): During filling or compression, take at least 3 samples from at
least 40 locaons across the batch
Assay at least 3 dosage units from at least 20 predetermined locaons throughout the batch
Blend Uniformity is Acceptable Pass
Fail
SD ≤ 3.0% of Target
Pass Fail
Pass Analycal/
Sampling
Dosage Units are not uniform Blend & content uniformity are acceptable
*n is the total number of assay results. Blend is not uniform
Assay at least 3 dosage units from at least 40 predetermined locaons throughout the batch
3.1 ≤ SD ≤ 5.0% of Target SD > 5.0% of Target
Blend Uniformity is Acceptable
Dosage Units (Samples): During filling or compression, take at least 3 samples from at least 40
locaons across the batch
Acceptance Criteria – Stage 2
All individual values within 75.0-125.0% and,
Complies with stascal test to provide an appropriate level of assurance to comply with USP <905> for n*
Assay samples 2 & 3 per locaon
BU Stage 2
Acceptance Criteria – Stage 1
All individual values within 75.0-125.0% and, Complies with stascal test to provide an appropriate level of assurance to comply with USP <905> for n*
Assay at least 3 dosage units from the re-maining 20 locaons not tested in Stage 1.
Fail Product /
Process
In-Process Dosage Unit Sampling for Process Design5 and Process Qualification Batches6
1. Sample at least 3 in-process dosage units from at least 40 approximately equally spaced predetermined loca-tions7 throughout the batch (including the beginning and end of the run8; values should not be weight corrected.
2. Stage 1 dosage unit testing: Assay at least 3 dosage units per location from at least 20 (of the 40) predetermined locations (including the beginning and end of the run; values should not be weight corrected).
(a) Determine if the data comply with the accep-tance criteria for the statistical approach, sample size, and levels of confidence and coverage selected.
(b) All individual values should be between 75.0 and 125.0 % (non-weight corrected).
(c) If either of the above acceptance criteria is not met, proceed to stage 2 testing,
3. Stage 2 dosage unit testing: Assay at least 3 dosage units per location from the remaining 20 locations that were not tested during stage 1.
(a) Determine if the data comply with the accep-tance criteria for the statistical approach, sample size, and levels of confidence and coverage selected.
(b) All individual values should be between 75.0 and 125.0 % (non-weight corrected).
(c) If the results comply with the acceptance criteria, dosage unit uniformity is demonstrated. If not, the dosage units are not uniform.
(d) Consider performing VCA on the combined stage 1 and stage 2 dosage unit data to identify potential sources of variability that can lead to process improvements.
Modified Approach for the Assessment of Blend and Content Uniformity for Continued Process Verification
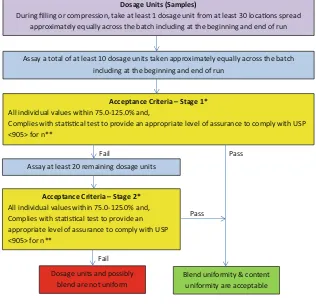
Figure2contains a flow diagram for the assessment of blend and dosage unit uniformity during continued process verifica-tion (stage 3b) of commercial batches. The manufacturer decides what statistical approach, sampling plan, acceptance criteria, and levels of confidence and coverage to use to provide assurance in passing USP <905>. This particular example, which is for demonstration purposes only, uses a sampling plan where one dosage unit is tested from 30 loca-tions throughout the compression or filling process. Other sample plans using different quantities of dosage units may be used, with justification.9 Because the in-process dosage unit data can also be used as a surrogate test for both batch release (non-weight-corrected data) and blend uniformity, a systematic sampling plan should be used to identify the posi-tion of sampling locaposi-tions and ensure samples are taken throughout the entire batch (including beginning and end of run locations).
Procedure for Assessing Blend and Content Uniformity During Continued Process Verification (Stage 3b)
1. Sample 1 in-process dosage unit from 30 locations throughout the compression or filling process including the beginning and end of the run.
2. Stage 1 testing: Assay 1 dosage unit from at least 10 of the 30 sampling locations. (The 10 locations need to be identified in the sampling plan and are from across the entire batch, including beginning and end (i.e., not just a random sample from the 30 locations).
(a) Determine if the data comply with the acceptance criteria for the statistical approach, sample size, and levels of confidence and coverage selected.
(b) All individual values should be between 75.0 and 125.0 % (non-weight corrected).
(c) If the results comply with the acceptance criteria, blend and dosage unit uniformity is demonstrated. If either of the above acceptance criteria is not met, proceed to stage 2 testing.
3. Stage 2 testing: Test the remaining 20 dosage units and determine if the results comply with
5
Although the strategy described in this section can be applied to batches manufactured during stage 1 process design, the sampling plans, statisti-cal approach and acceptance criteria may be modified to be phase appropriate.
6This example of a sampling plan was designed to provide appropriate data for estimating between-location and within-location variance com-ponents to meet FDA expectations [3].
7Fewer locations may be sampled for the assessment of smaller batches, with justification.
8
Initial locations to be tested are identified prior to batch manufacture, and must be representative of the entire batch.
(a) The acceptance criteria for the statistical approach, sample size, and levels of confidence and coverage selected.
(b) All individual values should be between 75.0 and 125.0 % (non-weight corrected).
(c) If the results comply with the acceptance criteria, blend and dosage unit uniformity is demonstrated. If not, the dosage units and possibly the blend are not uniform.
Continued Process Verification (Stage 3a)
If a product had blend standard deviations in the 3.1– 5.0 % of target range and/or it required stage 2 testing for the dosage units during process qualification, addi-tional samples may need to be analyzed during continued process verification (stage 3a). The number of dosage units that should be assayed depends on the magnitude of the risks associated with the process. If a product has standard deviations for the blend and/or dosage units in the 4.0–5.0 % of target range, a greater number of dosage
units may be required to demonstrate adequacy of powder mix and dosage unit uniformity (perhaps comparable to stage 2 dosage unit testing quantities) during continued process verification (stage 3a). For products with blend and/or dosage unit standard deviations in the 3.1–4.0 range, stage 1 dosage unit testing may suffice. The num-ber of samples tested could be reduced if process changes are implemented that demonstrate an improvement in blend and/or dosage unit uniformity. Testing may also be reduced after a due diligence effort to improve the process still results in high but consistent (and acceptable) standard deviations for the blend and/or dosage unit data, indicating this is the best uniformity that the process can achieve.
Process Life Cycle
One element of continued process verification is to mon-itor process performance across batches. Standard devia-tions, acceptance values (AV), or other metrics for dosage unit uniformity could be monitored across batches, to
b
Dosage Units (Samples)
During filling or compression, take at least 1 dosage unit from at least 30 locaons spread approximately equally across the batch including at the beginning and end of run
Acceptance Criteria – Stage 1*
All individual values within 75.0-125.0% and,
Complies with stascal test to provide an appropriate level of assurance to comply with USP <905> for n**
Assay at least 20 remaining dosage units
Dosage units and possibly blend are not uniform
Assay a total of at least 10 dosage units taken approximately equally across the batch including at the beginning and end of run
Blend uniformity & content uniformity are acceptable
* Acceptance criteria for Stage 3 Connued Process Verificaon may have reduced assurance to comply with USP <905> compared to that used for Stage 2 Process Qualificaon. **n is the total number of assay results.
Pass
Fail
Acceptance Criteria – Stage 2*
All individual values within 75.0-125.0% and, Complies with stascal test to provide an appropriate level of assurance to comply with USP <905> for n**
Fail
Pass
detect any trends or shifts in the manufacturing process over the product’s life cycle.
Comments Regarding Implementation of the Approach
Blend and Dosage Unit Uniformity Analysis
Blend uniformity analysis should be performed during the manufacture of process design and process qualification batches. Manufacturers should not skip blend uniformity test-ing and default directly to dosage unit uniformity analysis during the manufacture of process qualification batches. Although an assessment of blend uniformity can be performed for any mixing operation in the manufacturing process, the final blend (lubricated) is the best indicator of the uniformity of the blend prior to compression or filling operations.
Fewer sampling locations may be justified for smaller-scale batches (e.g., early process design batches; small process qualification and commercial batch sizes), and acceptance criteria may be adjusted to be phase appropriate. However, at least 3 blend samples and at least 3 dosage units should be taken from each location. Revised sampling plans for smaller batch sizes must be appropriate for assuring acceptable blend and dosage unit uniformity. The Group recognizes that situa-tions may exist where it is not possible to sample blends. For example, for potent drugs manufactured in high-containment equipment, blend sampling may not be possible and/or would expose the operators to significant safety risks.
The Group recommends a 2-stage approach for the assess-ment of blend uniformity. It is not necessary to assay replicates from each blender location if the standard deviation for the first set of samples is ≤3.0 % of target because the total
standard deviation and the between- and within-location var-iance components would be very small. However, if the standard deviation is >3.0 % of target, information obtained from VCA after testing the remaining samples could be of value in identifying potential product/process-related variabil-ity resulting in opportunities to improve the uniformvariabil-ity of the blend.
Weight correction is justified when using dosage unit con-tent uniformity as a surrogate test to demonstrate the adequacy of the powder mix during routine commercial manufacture. Performing a weight-corrected analysis can be helpful in identifying if a failure to meet routine CU release criteria is due to a blend or post-blend issue. Dosage unit samples must be taken over the entire compression or filling run, to ensure the data is representative of all areas in the blender. However, because weight variation is an error component impacting the dose that the consumer receives, it is necessary to use the non-weight-corrected results if the in-process dosage unit data is to be used for product release. If the in-process dosage unit is not
the final dosage form (e.g., tablet core versus film-coated tablet), an assessment should be conducted that demonstrates content uniformity is not significantly impacted during subse-quent unit operations (e.g., film coating).
Investigations
When the blend standard deviation is between 3.1 and 5.0 % of target, the blend uniformity is acceptable and one can proceed to in-process dosage unit sampling. However, the group recommends that VCA be performed on the blend data to assess between-location and within-location variance com-ponents which may be used to identify opportunities to im-prove blend uniformity for future batches.
If the standard deviation is >5.0 % of target, conduct an investigation (including VCA) to determine if the variability was due to a non-blending issue that resulted in an erroneous assessment of the true uniformity of the blend (such as sam-pling bias, analytical error, or other non-formulation/process causes). If the presence of such an error can be demonstrated and justified, then corrective measures should be implemented and the batch can proceed to stage 2 dosage unit testing. If, instead, the high standard deviation is attributed to a product/ process-related cause, then blend uniformity is unacceptable and further formulation and/or process development is re-quired for the product.
Whenever stage 2 dosage unit testing is required, VCA of the data is recommended to determine if location-to-location issues exist over the course of the compression or filling run. It is valuable to compare the results of VCA performed on dosage units to those obtained for the blend. The knowledge gained from these comparisons may provide insight into blend and content uniformity improvements.
Acceptance Criteria
statistical approaches may be too discriminating for non-optimized drug products in early development.
Two statistical approaches that may be used are the ASTM E2709/E2810 method and tolerance interval (TI) approach. The ASTM method provides a level of confidence (for exam-ple, 90 %) and coverage (for examexam-ple, 95 % of future samples) that additional samples take from the batch will meet USP <905> criteria. The TI test provides a level of confidence (for example, 95 %) that some percentage (for example 95 %) of the dosage units will fall within a range (for example, 85.0– 115.0 %). An alternative analysis of the TI data can also predict the probability that future batches will pass USP <905>, providing a comparison to the ASTM method. Both approaches provide increased confidence that future samples taken from the batch will pass USP <905> criteria.
For some products, the pharmacokinetic characteristics of the drug may need to be considered when defining acceptance criteria for dosage unit uniformity. For example, drugs with high potency and/or narrow therapeutic indices may require tighter acceptance criteria to reduce consumer risk (i.e., the risk of releasing an unacceptable batch to treat a condition). Conversely, drugs with wide therapeutic indices can tolerate broader acceptance criteria and minimize producer’s risk (i.e., the risk of failing an acceptable batch). An assessment of in vivo impact of the dosing unit precision can be obtained by conducting pharmacokinetic simulations employing a tar-get potency distribution as an input. The control parameters used in the proposed flow charts (Figs.1and2) represent the target potency distribution for the dosing units. Example methods of such simulations have been discussed elsewhere [6,12].
The framework defined in Figs.1and2has the flexibility to accommodate different statistical approaches, sampling plans, and acceptance criteria, simply by inserting them into the appropriate boxes in the flow diagrams [9–11]. Regardless of which approach is selected, it is up to the applicant to demonstrate why the sampling plan, statistical approach, and acceptance criteria selected are appropriate for ensuring the content uniformity of the product.
Summary
The Group has proposed modifications to the original draft stratified sampling guidance document [1], which could fill the void resulting from its withdrawal. The approach is scien-tifically justified, especially for products that use traditional analytical techniques to assess the adequacy of the powder
mix and dosage unit uniformity. This paper contains a frame-work into which statistical approaches, sampling plans, and acceptance criteria can be inserted to demonstrate blend and dosage unit uniformity. The authors acknowledged that alter-nate acceptable approaches exist and others are being devel-oped, which can also be used within the framework defined in this paper to assure compliance with USP <905>.
References
1. Guidance for industry,“Powder Blends and Finished Dosage Units— Stratified In-Process Dosage Unit Sampling and Assessment”. U.S. Department of Health and Human Services, Food and Drug Administration, Center for Drug Evaluation and Research (CDER), October 2003, Pharmaceutical CGMPs.
2. Federal Register / Vol. 78, No. 152, p. 48175-48176, August 7, 2013/Notices.
3. Questions and answers on current good manufacturing practices, good guidance practices, level 2 guidance—production and process controls. CDER/OC Office of Manufacturing and Product Quality: CGMP Subject Matter Contacts, 6 August 2013.http://www.fda.gov/ Drugs/GuidanceComplianceRegulatoryInformation/Guidances/ ucm124782.htm.
4. United States Pharmacopeia Convention, USP 37 NF 32, USP General Chapter <905> Uniformity of dosage units, general notices and requirements, Section 3.10, Applicability of standards. 5.“Stratified sampling”presented at 2013 ISPE Annual Meeting,
Washington Marriott Wardman Park, Washington, DC, 3-6 November 2013
6. Bergum J. Current events in blend and content uniformity. Pharm Eng. 2014;34(2):1–10.
7. CFR 211.110, Code of Federal Regulations, Title 21, Volume 4, Revised as of April 1, 2014.
8. Guidance for industry,“Process Validation: General Principles and Practices,”U.S. Department of Health and Human Services, Food and Drug Administration, Center for Drug Evaluation and Research (CDER), Center for Biologics Evaluation and Research (CBER), Center for Veterinary Medicine (CVM), January 2011, Current Good Manufacturing Practices, Revision 1
9. Bergum J, Parks T, et.al. Assessment of blend and content uniformi-ty: technical discussion of sampling plans and application of ASTM E2709/E2810, accepted for publication in J. Pharm. Innov., December, 2014
10. Bergum J., Tolerance interval alternative to ASTM E2709/E2810 methodology to provide assurance of passing the USP uniformity of dosage unit (UDU) test <905>, submitted to Pharmaceutical Engineering, October, 2014
11. De los Santos P, Liu J, Pfahler L, Harrington B, Vukovinsky K, “Performance characteristics and alternative approaches for the ASTM E2709/2810 (CUDAL) method for ensuring that a product meets USP <905> uniformity of dosage units”, Submitted to Pharmaceutical Engineering, October 2014