(IJSBAR)
I SSN 2 3 0 7 - 4 5 3 1 (Print & Online)
http://gssrr.org/index.php?journal=JournalOfBasicAndApplied
---
Effect of Working Capital Management on the
Profitability of Selected Manufacturing Companies in
Nigeria
Lawal, A. A.
a*, Abiola, B. I.
b, Oyewole, O. M.
ca,b,c
Department of Accountancy, Federal Polytechnic, Offa, Kwara State
a
Email: [email protected]
b
Email: [email protected]
c
Email: [email protected]
Abstract
There is no doubt that the ultimate objective of any firm is to maximize profit. However, the preservation of the
liquidity of a firm is an important objective too and it is the efficient management of the various components of
working capital that helps to preserve liquidity. This paper therefore examined the effect of working capital
management on profitability of selected manufacturing companies. Secondary data gathered from the annual
reports of six selected companies in Nigeria covering the period between 2006 and 2013 was used for the study.
Purposive sampling technique was adopted and data collected was analysed using panel data least square
method of regression. The study found a significant negative relationship between the components of working
capital (DCP, APP and ITID) and profitability (ROI). The study therefore concluded that working capital
management has significant impact on profitability of manufacturing companies and recommended that
companies should manage their cash, accounts receivables, inventories and accounts payable with a view to
reducing the cash conversion cycle so as to increase their profitability amongst other things.
Keywords: Working Capital; Management; Profitability; Manufacturing; Nigeria.
---
* Corresponding author.
1. Introduction
The management of working capital has remained an important component of corporate financial management
over the years. This is because of its effect on firm’s profitability and risk, and consequently its value [1].
Similarly, Solanki [2] posited that working capital is the life blood of any business and believes its management
is important because of its effects on firm’s profitability. Every business needs adequate liquid resources in the
short term to maintain day-to- day cash flow needed for operations. However, this does not mean working
capital is only important in the short run because adequate liquidity is also needed to ensure the survival of the
business in the long run. This made Ashraf [3] to opine that efficient working capital management involves
planning and controlling current assets and current liabilities in a manner that eliminates the risk of inability to
meet due short term obligations on the one hand and avoid excessive investment in these assets on the other
hand so as to increase profitability.
1.1. Statement of research problem
There is no doubt that the ultimate objective of any firm is to maximize profit. However, the preservation of the
liquidity of a firm is an important objective too and it is the efficient management of the various components of
working capital that helps to preserve liquidity. However, problem lies in the efficient management of these
various components that makes up the working capital by managers. This problem arise as a result of the fact
that most managers fight to increase inventory turnover in a bid to increase profitability without been mindful of
the need to speed up the debtor collection period and to delay creditor payment period as far as possible, so as to
provide the funds needed to keep the cycle flowing. This puts the firms in poor liquidity position and it
consequently affects the profitability of such firms. Therefore, given this position, it is expedient that an
investigation of the effect of working capital management on profitability be carried out.
1.2. Research objectives
The general objective of this study is to examine the impact of working capital management on the profitability
of selected manufacturing companies. However the specific objectives of the study are to:
i. evaluate the effect of debtor collection period as a component of working capital on the profitability of
manufacturing companies;
ii. examine the influence of creditors payment period as a component of working capital on the profitability of
manufacturing companies;
iii. determine the effect of inventory turnover as a component of working capital on the profitability of
manufacturing companies.
1.3. Research hypotheses
Ho1: Debtors collection period has no effect on the profitability of manufacturing companies.
Ho2: Creditors payment period has no influence on the profitability of manufacturing companies.
Ho3: Inventory turnover has no effect on the profitability of manufacturing companies.
1.4. Justification for the study
This study will help to provide clear understanding of the effect of working capital management on corporate
profitability to managers. It will aid their financial management decision making aimed at maintaining a balance
between profitability and liquidity. Similarly, the study will help provide information for shareholders,
prospective customers and creditors with regards to profitability in relation to efficient working capital
management. Furthermore, the study will help, through its findings, to provide a guideline for those who intend
conduct their study on similar topic. Finally, the study will assist the researcher in obtaining new knowledge
about the problem under study.
1.5. Scope of the study
The study covers six selected manufacturing companies on the Nigerian Stock Exchange (NSE) and their annual
reports for eight years covering 2006 to 2013 was used in the investigation of the effect of working capital on
profitability of manufacturing companies.
Though 135 manufacturing firms are listed on the Nigeria stock exchange, the availability of complete data
prompted this limitation. It is believed that a reasonable level of generalization can be made since this limitation
has no technical disadvantage on this study because of the homogeneity of the population. Their annual report
for a period of eight years was obtained to examine the effect of working capital management on the
profitability over this period.
2. Working capital and working capital management
The term working capital implies a company’s investment in short term assets like cash, short term securities,
accounts receivables and inventories [4]. Precisely, these assets are financed by short-term liabilities like
accounts payable and short term borrowings. Working capital may also be defined as a financial metric which
represents operating liquidity available to an organization or other entity, including governmental entity [1]
According to Solanki [2] the term working capital refers to the short term funds required for financing the
duration of the operating cycle in a business often known as “accounting year”. Similarly, Investopedia sees
working capital as a measure of both a company's efficiency and its short-term financial health.
Adamu [5] opined that working capital management is concerned with all the aspects of managing current assets
and current liabilities. Generally, working capital management consists of three different parts. These parts are
decision relating to working capital and short term financing, and this includes managing the relationship
between the company’s short term assets and its short term liabilities [4]. This enables the company to continue
operations and to have enough cash flow at its disposal to satisfy both maturing short-term debts and upcoming
operational expenses, which is the major objective of working capital management. Generally, working capital
management involves two basic questions: first, what is the appropriate amount of current assets, both in total
and for each specific account, and second, how should those current assets be financed?
The total working capital requirement of a firm is determined by a wide variety of factors and these factors
affect different organizations differently. Paramasivan and Subramanian [6] posit that the factors influencing
working capital decisions of a firm may be classified as internal factors and external factors. The internal factors
are factors that the companies will take in to account while determining the optimal level of working capital
needed for the business concern by looking inherent to factors related to the business. Internal factors include
the nature and size of the business, the firm’s production policy, the firm’s credit policy and the growth and
expansion of the firm.
Sometimes however, firm’s working capital requirement can be affected by external factors which will not be
controlled through the business internal administration and management process. Such external factors includes
business fluctuations, changes in the technology and the taxation policy in place.
2.1. The implication of excessive or inadequate working capital
The concern for managers should be the maintenance of a sound working capital position at all times.
Organisations should have adequate working capital to run their business operations smoothly and efficiently.
Both excessive as well as inadequate working capital positions are dangerous [5].
Excessive working capital means idle funds lying in the concern which earn no profits for the concern. It results
into unnecessary accumulation of inventories, hence, inventory mishandling, waste, theft and losses increase. It
is also an indication of defective credit policy and slack collection period. Consequently, higher incidence of
bad debts results, which adversely affects profits.
Paucity of working capital, on the hand, not only impairs firm’s profitability but also results in production
interruptions and inefficiencies. Similarly, the firm losses its reputation when it is not in a good position to
honour its short term obligations as a result of which the firm faces tight credit terms.
2.2. The working capital cycle
According to Mekonnen [7], in order to understand the importance of working capital, one has to understand the
working capital cycle which is described as the core for working capital management. Arnold [8] opined that
working capital cycle or Cash Conversion Cycle (CCC) includes all the major dimensions of business
operations. He further stated that the working capital cycle represents the time difference between the
The cash conversion cycle is measured using the following formula:
Cash Conversion Cycle = the number of days inventories + the number of days accounts receivables – the
number of days accounts payables.
The number of days of inventory or Inventory turnover in days represents the number of days it takes on the
average to sell the inventory on hand. The shorter this period; the better; because products tend to deteriorate as
they sit in store [9]. It is computed as;
Inventory Turnover in Days (ITID) = Inventory x 365 (1)
Cost of goods sold
The number of days account receivable also known as average collection period refers to the period in time
before receivables are collected after sales [9]. The lower the collection period, the more effective is the control
of credit and hence better liquidity. It is computed as;
Debtors’ Collection Period (DCP) = Accounts Receivable x 365 (2)
Credit Sales
The creditor’s payment period or number of days account payables refers to the number of days taken before
creditors are paid after purchases [9]. The lower the creditors’ payment period the better. This is because a
higher ratio will indicate a degree of insolvency and it sends a wrong signal to creditors. It is computed as;
Creditors Payment Period (CPP) = Accounts Payable x 365 (3)
Credit Purchases
The combination of the inventory turnover in days, average collection period and creditors payment period
makes up the working capital cycle. According to Arnold [8] the shorter this cycle, the fewer resources are
needed by the company. So the longer the cycle is the higher will be the investment in the working capital. But
also a longer cycle could increase sales, which could lead to higher profitability. But this longer cycle, will also
lead to higher investment and could rise faster than the benefits of the higher profitability. Many authors like
Shin and Soenen [10] have argued that it is important for firms to shorten the CCC, as managers can create
value for their shareholders by reducing the cycle to a reasonable minimum [11].
All the decisions of the financial manager are assumed to be geared towards the maximization of shareholders
wealth, and working capital decisions are no exception. Accordingly, risk return trade-off characterizes each of
the working capital decision. There are two types of risks inherent in working capital management (WMC),
namely: liquidity risk and risk of opportunity loss [5].
Liquidity risk is the non-availability of cash to pay a liability that fall due. It may happen only on certain days.
Even so, it can cause not only a loss of reputation but also make the work condition unfavourable for getting the
best terms on transaction with the trade creditors.
The other risk involved in WCM is the risk of opportunity loss, that is, the risk of having two little inventory to
maintain production and sales or the risk of not granting adequate credit for realising the achievable level of
sales. In other words, it is the risk of not being able to produce more or sell more or both and, therefore, not
being able to earn the potential profit, because there were not enough funds to support higher inventory and
book debts.
Thus, it would not be out of place to mention that it is only theoretical that the current assets could all take zero
values. Indeed, it is neither practicable nor advisable in practice; all current assets take positive value, because
firms seek to reduce working capital risk. However, the greater the funds locked up or deployed in current
assets, the higher is the cost of the funds employed and therefore the lesser the profit [5]. Hence, the need for
managers of working capital to effectively and efficiently balance the two sides’ i. e. risk and return.
2.4. Rational choice theory (RCT)
This theory makes the assumption that “if individuals behave rationally, the collective will benefit”. The basic
principle of RCT is that an actor makes rational choices among various alternatives after the costs and benefits
of each alternative have been weighted. These choices are based on a hierarchy of preferences (values and
utilities) leading to choosing the option that maximizes the net benefit to the actor, while having the highest
probability of occurrence. In other words, an actor chooses that option that is most in his self-interest.
Applied to working capital management, Managers will gather and evaluate all the information available before
making decisions. They would calculate the net benefits of all the different options and choose the option that
maximizes their desired outcome, based on their preferences on risk and profitability. Practically, this implies
that managers will attempt to keep the receivables conversion period and the inventory conversion period as low
as possible, whereas they will try to maximize payables conversion period.
2.5. Empirical studies on working capital management and profitability
Many researchers have studied working capital from different views and in different environments. However,
the following ones that proved to be very useful will be reviewed. In a study conducted by Azam and Haider
[12] to investigate the impact of working Capital Management on firms’ performance for non-financial
relationship between working capital management and firms’ performance, it was discovered that working
capital management has significant impact on firms’ performance and the study concluded that managers can
increase value of share holder and return on asset by reducing their inventory size, cash conversion cycle and net
trading cycle.
Dong [13] reported that the firms’ profitability and liquidity are affected by working capital management. In his
analysis, pooled data are selected for carrying out the research for the era of 2006-2008 for assessing the
companies listed on the stock market of Vietnam. He focused his study on variables such as profitability,
conversion cycle and its related elements and the relationship that exists between them. From his study, he
concluded that the relationships among these variables are strongly negative. This denote that decrease in the
profitability occur due to increase in cash conversion cycle.
Ganesan [14] selected telecommunication equipment industry to study the effectiveness of working capital
management on profitability. The sample used in his study was 349 telecommunication equipment companies
covering the period 2001 to 2007. Data was gathered from the annual financial statements of the companies. The
statistical tests used included correlation, regression analyses and Analysis of variance (ANOVA). The results
showed that days of the working capital negatively affects the profitability of these firms.
Shin and Soenen [10] studied the relationship between working capital management and value creation for
shareholders. In their study, they used net-trade cycle (NTC) as a measure of working capital management. NTC
is basically equal to the cash conversion cycle (CCC) where all three components are expressed as a percentage
of sales. They examined this relationship by using correlation and regression analysis. Using a COMPUSTAT
sample of 58,985 firm and years covering the period 1975-1994, they found a strong negative relationship
between the length of the firm's net-trade cycle and its profitability. Based on the findings, they suggest that one
possible way to create shareholder value is to reduce firm’s NTC.
To test the relationship between working capital management and corporate profitability, Deloof [1] used a
sample of 1,009 large Belgian non-financial firms for a period covering 1992-1996. By using correlation and
regression tests, he found significant negative relationship between gross operating income and the number of
days accounts receivable, inventories, and accounts payable of Belgian firms. Based on the study results, he
suggests that managers can increase corporate profitability by reducing the number of day’s accounts receivable
and inventories.
Lazaridis and Tryfonidis [15] conducted a cross sectional study by using a sample of 131 firms listed on the
Athens Stock Exchange for the period covering 2001 – 2004. The data collected was analysed using correlation
and regression tests. They found out that statistically significant relationship exist between profitability,
measured through gross operating profit, and the cash conversion cycle and its components (accounts
receivables, accounts payables, and inventory). Based on the results, they suggested that managers can create
profits for their companies by correctly handling the cash conversion cycle and by keeping each component of
Falope and Ajilore [16] used a sample of 50 Nigerian quoted non-financial firms for the period 1996 -2005.
Their study utilized panel data econometrics in a pooled regression, where time-series and cross-sectional
observations were combined and estimated. They found a significant negative relationship between net
operating profitability and the average collection period, inventory turnover in days, average payment period
and cash conversion cycle for a sample of fifty Nigerian firms listed on the Nigerian Stock Exchange.
Furthermore, they found no significant variations in the effects of working capital management between large
and small firms.
In summary, the literature review indicates that working capital management impacts on the profitability of the
firm. This study therefore intends to add to the existing body of knowledge by domesticating the study of the
relationship between working capital management and profitability in Nigeria and to use more recent data as it
was observed by the researchers that there exist only few studies in Nigeria in recent times that have used such
data.
3. Methodology
This study empirically investigated the effect of working capital management on profitability of selected listed
manufacturing companies covering a period of eight years. In view of this, the study therefore adopted an
analytical research design method. Secondary data gathered from the annual reports of six manufacturing
companies in Nigeria covering the period between 2006 and 2013 was used for the study.
The population of the study covers the entire listed manufacturing companies in Nigeria totalling 135. However,
a purposive sampling technique was adopted in selecting 6 companies into the sample based on their ranking as
part of the twenty most capitalised companies on the Nigeria stock exchange. The companies selected are
Dangote Sugar Refinery Plc, Flour Mill Company of Nigeria, Guiness Nigeria Plc, Lafarge Wapco Plc, Nestle
Plc and Unilever Plc.
The paper adopted econometric approach to test the effect of working capital management on profitability by
employing the multiple regression analysis of the Panel Least Square Method using E- Views 7.0 package. This
statistical technique was selected as a result of the nature of data and its ease of use. Panel normality test,
multicolinearity test and Hausman test were performed on the data to determine the normality of the variables,
multi correlation between independent variables of the model and to make a choice between the fixed effect
model (FEM) and random effect model (REM) approaches to panel regression respectively.
The Panel Normality Test is a test that is carried out to test whether the variables are normally distributed [17].
Thus, the normality test was performed to test the hypothesis that the variables are not normally distributed and
the probability value of the Jarque-Bera statistics was utilized for this purpose. The decision rule is to accept the
null hypothesis that states that the variables are not normally distributed when p-value of the Jarque-Bera
statistics is < 0.05. Furthermore, the correlation between the independent variables was used to test whether the
problem of multicolinearity exist between the independent variables. This is because multicolinearity problem is
The Hausman specification test tests the null hypothesis that the random effect model is the preferred model to
be used. The decision rule is to accept the null hypothesis where the p-value of the cross section random effect is
greater than the 0.05 absolute Mackinnon value. If the null hypothesis must be rejected, the fixed effects model
is the model to use [17].
3.1. Model specification
The general form of the model used for this study is as follows;
ROI = ƒ {ACP, CPP, ITID} (4)
The explicit form of equation (1) above is represented as follows;
ROI = α + β1DCP + β2CPP + β3ITID + µ (5)
Where
ROI = Return on Investment
ACP = Average Collection Period
CPP = Creditors Payment Period
ITID = Inventory Turnover
α = Intercept of the regression line
β (1 to 3) = Coefficient of independent variables
µ = the Error Term
Return on Investment (ROI) was used in this study to proxy profitability. This stands as the dependent variable
in the model. The formula used in arriving at the ROI value is;
ROI = Profit After Tax (6)
Total Asset
On the other hand, the independent variables of Average Collection Period (DCP), Inventory Turnover in Days
(ITID) and Creditors Payment Period (CPP) were used as a proxy of working capital management.
The apriori expectation of the model is β1 < 0, β2 < 0 and β3 < 0. This means that a negative relationship is
4. Presentation, analysis and interpretation of result
4.1. Panel normality test
The following are the result of the panel normality test carried out on the variables of the model.
Table 4.1: Result of panel normality test
Variable ROI DCP CPP ITID
Jarque-Bera 4.3883 418.9021 95.9380 6.9997
P-Value 0.8153 0.0000 0.0000 0.0302
Source: Author’s computation, 2014
Table 4.1 presents the result of the normality test conducted. The result indicated that the p-value of the
Jarque-Bera statistics for all the variables except ROI is less than 0.05. This shows that DCP, CPP and ITID are not
normally distributed. Thus, the hypothesis that DCP, CPP and ITID are not normally distributed is accepted.
Thus, DCP, CPP and ITID will be transformed into their logarithm form as follows:
LNDCP = logged value of debtor collection period
LNCPP = logged value of creditor payment period
LNITID = logged value of inventory turnover
4.2. Multicolinearity test
The result for the spearman rank correlation carried out is presented in Table 4.2
Table 4.2: Spearman rank correlation
LNDCP LNCPP LNITID
LNDCP 1
LNCPP 0.5432 1
LNITID -0.1917 0.1648 1
Source: Author’s computation, 2014
Table 4.2 shows the result of the correlation among the independent variables. The result revealed that the
correlation between debtors’ collection period and creditors’ payment period is positive (0.5432). Similarly, the
correlation between debtors’ collection period and inventory turnover is negative (-0.1917). Therefore, this
result revealed the absence of the problem of multicolinearity in the model because the correlations between the
independent variables are all less than 70% [18].
4.3. Hausman specification test
The results of Hausman test conducted for the Model is presented in table 4.3
Table 4.3: Hausman test result
Correlated Random Effects
Test cross-section random effects
Test Summary Chi-Sq. Stat P-Value
Cross-section random 4.8854 0.0180
Source: Author’s computation, 2014.
The null hypothesis for the Hausman test is that the random effect model is the preferred model to be used. The
p-value of the test for the model which is 0.0180 is statistically significant, therefore the hypothesis is rejected.
Therefore, for the purpose of the model, the REM is not appropriate and FEM is preferred.
4.4. Data analysis
This presents an analysis of the regression carried out for the study
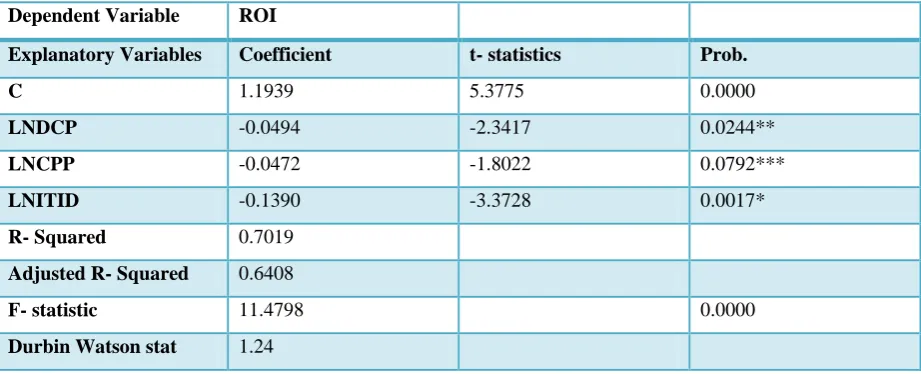
Table 4.4: Regression analysis result
Dependent Variable ROI
Explanatory Variables Coefficient t- statistics Prob.
C 1.1939 5.3775 0.0000
LNDCP -0.0494 -2.3417 0.0244**
LNCPP -0.0472 -1.8022 0.0792***
LNITID -0.1390 -3.3728 0.0017*
R- Squared 0.7019
Adjusted R- Squared 0.6408
F- statistic 11.4798 0.0000
Durbin Watson stat 1.24
*Significant at 1% level **Significant at 5% level ***Significant at 10% level.
Table 4.4 revealed that the result of the panel regression for the model has a R2 value of 0.70 which suggested a
70% explanatory ability of the independent variables (LNDCP, LNCPP and LNITID) of the model for the
systematic variations in the dependent variable (ROI) with an adjusted R2 of 0.64. The p-value of the f-stat
(0.0000) indicated that the hypothesis of a significant linear relationship between the dependent and independent
variables could not be rejected at 1% level. The result confirms the apriori expectation of the model since the
coefficients of debtors’ collection period, creditors’ payment period and inventory turnover days are all less than
zero. The independent variables are all significant at acceptable level of significance thus establishing the
relevance of the independent variables to the determination of profitability in manufacturing companies. The
coefficient of debtors’ collection period of -0.05 indicates that a unit increase in the average cp0ollection period
of manufacturing companies will lead to N0.05 decrease in their profitability and vice versa. Similarly, the
coefficient of creditors’ payment period of -0.05 indicates that a unit increase in the creditors’ payment period of
manufacturing companies will lead to N0.05 reduction in their profitability and vice versa. Also, the coefficient
of inventory turnover days of -0.14 indicates that a unit increase in the inventory turnover days of manufacturing
companies will lead to N0.14 reduction in their profitability. The coefficient of intercept of the model of 1.19
shows that fluctuations in profitability of manufacturing companies to the tune of N1.19 is attributable to other
variables outside the ones being studied.
4.5. Summary of Findings
The result showed that there is a negative relationship between the profitability of manufacturing companies and
average collection period. The practical implication of this is that as the firms’ makes effort to reduce the
number of days their accounts receivables remain uncollected, it boost their profitability. This is because sales
are converted into cash that can be reinvested to generate more profit. Thus the null hypothesis that states that
debtors’ collection period has no effect on the profitability of manufacturing companies is hereby rejected.
Furthermore, the result indicated that there is a negative relationship between the profitability of manufacturing
companies and the inventory turnover days. This implies that, the lower the inventory turnover days, the higher
the profitability of the manufacturing companies. Put differently, this means that, the faster the firm is able to
convert its inventory at hand to cash, the greater are its chances to boost its profitability. Hence, the null
hypothesis that states that inventory turnover has no effect on the profitability of manufacturing companies is
hereby rejected.
Similarly, the result depicted a negative relationship between profitability of manufacturing companies and their
creditors’ payment period. By this, the more prompt the firms’ are in making payment to their suppliers, the
more credit worthiness and opportunity for higher supplies from their suppliers. This in no doubt will help to
boost their profitability. The firms should only stretch payment to creditors as much as possible within the credit
period so as to make funds available for other investment opportunities. Finally, the null hypothesis that states
that creditors’ payment period has no influence on the profitability of manufacturing companies is hereby
Therefore, it is evident that there exist an inverse relationship between working capital management and the
profitability of manufacturing companies. This result is in conformity with outcome of prior studies conducted
by [15] and [11].
5. Conclusions
This paper examined the effect of working capital management on profitability of selected listed manufacturing
companies. From the findings of the study, it became apparent that there exist an inverse relationship between
the components of working capital and profitability. It can therefore be concluded that working capital
management has significant impact on profitability of manufacturing companies. This means that, managers of
manufacturing companies can create more profits for their companies and share holders by keeping each
different component of working capital to a possible optimum level.
5.1. Recommendations
Based on these findings, the study puts forward the following recommendations: (i) Companies should put in
place proper inventory management policies to ensure that an optimal level of inventory is kept. (ii) managers
should ensure that optimum cash balance is held at any point in time. (iii)Managers should ensure that sound
credit collection policies are instituted within the organisation.(iv) Efforts should also be made to ensure that
payments to creditors are not stretched beyond the credit period.(v) Finally, companies should make concerted
effort to manage their cash, accounts receivables, inventories and accounts payable with a view to reducing the
cash conversion cycle so as to increase their profitability
References
[1] M. Deloof. “Does Working Capital Management Affect Profitability of Belgian firms?” Journal of Business
Finance and Accounting, vol. 30(5), pp. 573-588, 2003.
[2] A. H. Solanki. ”Working Capital Management in Selected Small Scale Industries of Gujarat State”. Phd.
thesis, Saurashtra University, India, 2009.
[3] C. H. Ashraf. “The Relationship between Working Capital Efficiency and Profitability”. Journal of
Accounting and Management, vol. 2(3), pp. 76-85, 2012.
[4] J. F. Weston and E. F. Brigham. Essentials of Managerial Finance. Illinois: The Dryden Press, 1977.
[5] L. Adamu. BMH 745, Class lecture, Topic: “Working Capital Management.” Lr 01, National Open
University of Nigeria, Lagos, Sep. 17, 2010.
[6] C. Paramasivan and T. Subramanian. Financial Management. New Delhi: New Age International Ltd,
2009.
[7] M. Mekonnen. “The Impact of Working Capital Management on Firms’ Profitability” Masters thesis. Addis
Ababa University. Ethopia, 2011.
[8] G. Arnold. Corporate Financial Management. 4th ed. Essex: Prentice Hall, 2008.
[10]H. H. Shin and L. Soenen. “Efficiency of Working Capital Management and Corporate Profitability”.
Financial Practice and Education, vol. 8(2), pp. 37-45, 1998.
[11]A. K. Sharma and S. Kumar. “Effect of Working Capital Management on Firm Profitability: Empirical
Evidence from India”. Global Business Review, vol. 12(1), pp. 159 – 173, 2011.
[12]M. Azam and S. I. Haider. “Impact of Working Capital Management on Firms’ Performance: Evidence
from Non – Financial Institutions of KSE – 30 Index”. Interdisciplinary Journal of Contemporary Research
in Business, vol. 3(5), pp. 481-492, 2011.
[13]H. P. Dong. (2010), “The Relationship between Working Capital Management and Profitability.”
International Research Journal of Finance and Economic, vol. 49(5), pp. 473-483, 2010.
[14]A. Ganesan. “An Analysis of Working Capital Management Efficiency in Telecommunication Equipment
Industry”. Rivier Academic Journal, vol. 3(2), pp. 1-10, 2007.
[15]I. Lazaridis and D. Tryfonidis. “Relationship Between Working Capital Management and Profitability of
Listed Companies in the Athens Stock Exchange”. Journal of Financial Management and Analysis, vol.
19(1), pp. 26-25, 2006.
[16]O. I. Falope and O. T. Ajilore, O. T. “Working Capital Management and Corporate Profitability: Evidence
from Panel Data Analysis of Selected Quoted Companies in Nigeria”. Research Journal of Business
Management, vol. 3(1), pp. 73-84, 2009.
[17]D. N. Gujarati and D. C. Porter. Basic Econometrics. New York: McGraw-Hill, 2009.
Appendices
Appendix I: Result of Normality Test
ROI DCP CPP ITID
Mean 0.235225 37.80959 93.82128 81.97369
Median 0.229754 34.27998 84.50024 77.78665
Maximum 0.611737 242.1832 394.3373 169.2893
Minimum -0.061905 1.399521 19.29211 19.38062
Std. Dev. 0.131704 39.85523 69.25071 30.11818
Skewness 0.628671 3.143300 1.917250 0.872645
Kurtosis 3.783090 16.03571 8.767636 3.673670
Jarque-Bera 4.388277 418.9021 95.93801 6.999736
Probability 0.111455 0.000000 0.000000 0.030201
Sum 11.29079 1814.860 4503.421 3934.737
Sum Sq. Dev. 0.815261 74656.65 225396.1 42633.93
Observations 48 48 48 48
Appendix II: Result of Hausman Specification Test
Correlated Random Effects - Hausman Test
Equation: Untitled
Test cross-section random effects
Test Summary
Chi-Sq.
Statistic Chi-Sq. d.f. Prob.
Cross-section random 4.885362 3 0.01804
Appendix III: Spearman Rank Correlation Result
ROI LNDCP LNCPP LNITID
ROI 1.000000 0.180743 0.207447 -0.134173
LNDCP 0.180743 1.000000 0.543205 -0.191706
LNCPP 0.207447 0.543205 1.000000 0.164785
LNITID -0.134173 -0.191706 0.164785 1.000000
Appendix IV: Regression Analysis Result
Method: Panel Least Squares
Variable Coefficient Std. Error t-Statistic Prob.
C 1.193943 0.222027 5.377476 0.0000
LNDCP -0.049384 0.021089 -2.341722 0.0244
LNCPP -0.047157 0.026166 -1.802213 0.0792
LNITID -0.138961 0.041200 -3.372832 0.0017
Effects Specification
Cross-section fixed (dummy variables)
R-squared 0.701924 Mean dependent var 0.235225
Adjusted R-squared 0.640780 S.D. dependent var 0.131704
S.E. of regression 0.078937 Akaike info criterion -2.072978
Sum squared resid 0.243010 Schwarz criterion -1.722128
Log likelihood 58.75147 Hannan-Quinn criter. -1.940391
F-statistic 11.47989 Durbin-Watson stat 1.240004
Prob(F-statistic) 0.000000
Appendix IV: Data Used for the Study