National livestock export industry
sheep, cattle and goat transport
performance report 2015
final re
port
p
Project code: W.LIV.0291
Prepared by: Department of Agriculture and Food, Western Australia GJ Norman
Date published: August 2016
ISBN: 9781740363198
PUBLISHED BY
Meat & Livestock Australia Limited Locked Bag 991
NORTH SYDNEY NSW 2059
Meat & Livestock Australia acknowledges the matching funds provided by the Australian
Government to support the research and development detailed in this publication.
Executive summary
The objective of this project was to summarise the performance of the livestock export industry in terms of mortality levels of sheep, cattle and goats exported by sea and air from Australia during 2015.
Industry stakeholders, government, animal welfare groups and the general public have a keen interest in monitoring performance in different sectors of the livestock export trade. This summary report provides the only comprehensive breakdown by species, time of year, ships, load ports and major destinations over the calendar year, along with summary analyses of trends over time.
The overall mortality rate for sheep during sea transport to all destinations during 2015 was 0.62% (12,560 mortalities in 2.01 million sheep exported). This was well below the 0.71% mortality rate for 2014 and represents a new record low. The main port of loading was Fremantle, which exported 1.80 million sheep with a mortality rate of 0.63% (11,256 mortalities), followed by Adelaide exporting 0.18 million sheep with a mortality rate of 0.60% (1,048 mortalities) and Portland which exported 0.04 million sheep with a mortality rate of 0.61% (256 mortalities).
The overall mortality rate for the record 1.31 million cattle exported from Australia in 2015 was 0.10% (1,355 mortalities). This was well below the mortality rate of 0.12% observed in 2014. The overall mortality rates on voyages to the Middle East/North Africa and North-East Asia were 0.25% (252 mortalities in 0.10 million cattle exported) and 0.08% (81 mortalities in 0.1 million cattle exported) respectively. The overall mortality rate on voyages to South-East Asia was 0.08% (804 mortalities in 1.07 million cattle exported), equalling that which was observed in 2014. The highest overall mortality rate on a regional basis was 0.53%, again for exports to South-East Europe (215 mortalities in 0.04 million cattle exported), while the lowest overall mortality rate was 0.07% for the three voyages representing Miscellaneous Destinations (3 mortalities in 4,500 cattle exported).
There were no mortalities among the 1,000 goats exported by sea from Australia in 2015. All goats exported by sea during 2015 went to South-East Asia.
Percentages of sheep, cattle and goats successfully delivered by sea since 1995 are shown below.
96.0 96.5 97.0 97.5 98.0 98.5 99.0 99.5 100.0
95 96 97 98 99 00 01 02 03 04 05 06 07 08 09 10 11 12 13 14 15
P
er
cen
t
Year
Livestock Delivery Rates (%) 1995 - 2015
Cattle
Sheep
Goats
Level below which sheep/goat shipments must be reported Level below which cattle shipments must be reported
Contents
1 BACKGROUND 4
2 PROJECT OBJECTIVES 4
3 METHODOLOGY 4
4 RESULTS AND DISCUSSION 6
4.1 Sheep 6
4.1.1 Performance trend 6
4.1.2 Overview 7
4.1.3 Middle East/North Africa 8
4.2 Cattle 22
4.2.1 Performance trend 22
4.2.2 Overview 23
4.2.3 Middle East/North Africa 24
4.2.4 South-East Asia 27
4.2.5 North-East Asia 31
4.2.6 South-East Europe 34
4.3 Goats 37
4.3.1 Performance trend 37
4.3.2 Overview 38
4.3.3 South-East Asia 38
4.4 Air Transport 39
4.4.1 Air transport of live sheep 39
4.4.2 Air transport of live cattle 40
4.4.3 Air transport of live goats 41
5 CONCLUSION AND RECOMMENDATIONS 42
5.1 Sheep, cattle and goats 42
6 APPENDICES 43
6.1 Appendix 1 – Research update 43
6.1.1 Investigating morbidity and mortality in cattle exported to the Middle East 43
6.1.2 Monitoring and evaluation of the HotStuff model 43
6.1.3 Heat load in sheep exported to Middle Eastern feedlots 44
6.1.4 Pinkeye on long haul cattle voyages 45
6.1.5 Further improving the environment on board livestock vessels 45
6.1.6 Stockman’s manual for exporting livestock by air. 45
6.2 Appendix 2 – Federal Department of Agriculture high-mortality investigations 46
6.3 Appendix 3 - Published studies 50
1 Background
The live export of sheep, cattle and goats makes a significant contribution to the Australian economy, valued at around $1,500 million in 2015, and provides employment in the many services that support this industry. The livestock export trade provides important support for the sheep, cattle and goat industries of Australia and is the only market outlet for producers in some areas of the country.
This report summarises information about mortalities in sheep, cattle and goats during sea and air transport from Australia. It allows industry, government and other interested parties to monitor mortality trends in these sectors. The report also lists relevant published studies and current research related to the industry.
The Australian Government Department of Agriculture (DA) also presents mortality data, though in a different format, under “Reports to Parliament” at their website:
http://www.agriculture.gov.au/export/controlled-goods/live-animals/live-animal-export-statistics/reports-to-parliament.
It should be noted that the DA mortality figures refer only to voyages for which data was received during the calendar year, in contrast to this current report which refers to data for all voyages which departed during the calendar year.
2 Project objectives
The project objectives were to:
a) Produce a report which summarises the mortality of sheep, cattle and goats exported from Australia for the 2015 calendar year and provide an informed analysis of mortality trends in the livestock export industry, and;
b) Maintain data and expertise to provide analysis and informed comment.
3 Methodology
The information in this report was obtained from ship Master’s Reports (which record livestock
mortalities and other information about each voyage), other tailored shipboard records and from “Yellow Books”, which record more-detailed information about numbers of livestock mortalities (ports of loading and discharge, and daily mortality by type-age-sex categories over the loading, voyage and discharge phases) than is available from the Master’s Report.
The shipboard part of the export process is divided into three distinct phases based on dates and times: load, voyage and discharge. The date and time for the end of loading marks the beginning of the voyage phase. The date and time for the beginning of discharge at the first port of discharge marks the end of the voyage phase and the beginning of the discharge phase. If a ship delivers livestock to more than one discharge port, and these are in close succession, all the mortalities after the beginning of discharge at the first of these ports are included in the discharge phase.
Occasionally, inordinate periods of time occur between discharge ports or discharge regions. In such cases, where possible, the voyage is split into separate “voyages” to better reflect the actual conditions that occurred for the stock consigned to those destinations.
Each year a number of ships’ journeys involve loading at multiple Australian ports (split-load voyages). Where analysis involves split-load voyages, the consignments of livestock from each load port have been considered as separate “voyages”.
It can be seen that a complex voyage involving one or more load ports and an extended discharge phase over a number of regions will generate multiple “voyages”. As an example, a ship might load at three ports and discharge over two regions, effectively generating six “voyages” if livestock were sent to each discharge region from each port. In most cases the current high quality of the information
supplied allows this close description of the actual conditions experienced.
This is almost a “privileged problem”, in that the information is usually so comprehensive that it allows tracking of consignments from individual load ports to individual discharge ports. So, the current definition of “voyage” has almost completely shifted from consignment from load port to discharge region, to consignment from load port to discharge port.
This current report is for all voyages which departed Australia during the calendar year 2015.
Information for livestock exported by air was provided by the Federal Department of Agriculture.
In this report information regarding export destinations for sheep has been sourced directly from Industry figures (shipboard and Exporter records) for the first time. This was because an irregularity in the usual information source was detected.
A formatting update has been introduced in this current report. Where mortality rate range data is presented in tables, the numbers shown have been extended to the second decimal place. This will illustrate differences that may be real but not apparent with numbers shown to one decimal place
From 2012 onward, graphs and tables presenting long-term overviews are restricted to a rolling ten-year basis. It is considered that the older data does not reflect the current state of the trade in terms of standards required of industry, ships participating and markets serviced.
In recent years the significant rise in livestock exports to Turkey and the Black Sea caused an
imbalance in the “Miscellaneous Destinations” category. A new destination region, South-East Europe, was introduced in 2012 to allow a more meaningful examination of exports to this region. South-East Europe includes ports in Turkey and the Black Sea.
Beginning in the 2013 report, references are made to Federal Department of Agriculture investigations into exceptional voyages and flights mentioned in the report text. It should be noted that these
Department of Agriculture reports have been available to the public for a number of years and that parties with an interest in the live export industry have been aware of this availability.
All high-mortality voyages have been included in relevant summary figures in this series of publications. It should be noted that in some instances inclusion of such voyages,usually resulting from exceptional circumstances (such as mechanical failure or trade dispute, and therefore not representing usual trade conditions), would distort consideration of long-term trends. Where exceptional voyages have been excluded from analysis of trends, explanatory text or footnotes indicate the exclusion.
Further information regarding exceptional voyages can be found at 6.2 Appendix 2.
Any Internet links provided are current up to the date of publication of this report.
In order to maintain confidentiality, individual ships are identified by codes in this report.
Summary information was produced using Statistix 10.0 (Analytical software 2000 Tallahassee, Florida USA).
Readers should be aware that additional information for a particular year may be received after
4 Results and discussion
4.1 Sheep
4.1.1 Performance trend
Figures 1 and 2 show the number of sheep exported and the percentage of mortalities during sea transport from all ports in Australia to all destinations over the last decade, as well as the trend line (linear regression) across those years. The 2.01 million sheep exported in 2015 was the second-lowest number exported since recording began in 1985. The number of sheep exported annually since 2006 has varied between 4.19 and 1.94 million, and the annual mortality has varied between 0.97 and 0.62%. The trend for numbers of sheep exported and annual mortality has been downward.
Figure 1 Number of sheep exported by sea from Australia to all destinations since 2006
1.0 1.5 2.0 2.5 3.0 3.5 4.0 4.5 5.0
06 07 08 09 10 11 12 13 14 15
L
o
ad
No
. (
x
1,000,000)
X
Year
Figure 2 Annual mortality of sheep exported by sea from Australia to all destinations since 2006
0.0 0.2 0.4 0.6 0.8 1.0 1.2 1.4
06 07 08 09 10 11 12 13 14 15
M
or
ta
lity
(%
)
X
Year
Discharge
Voyage
4.1.2 Overview
All sheep exported live by sea from Australia in 2015 were loaded either at Fremantle (89.2%), Adelaide (8.7%), or Portland (2.1%). The overall average voyage and discharge lengths were 16.79 and 5.36 days respectively (Table 1, below).
The shipboard part of the export process is divided into three phases: loading (load); voyage to the first port of discharge (voyage); and discharge. The discharge phase includes all mortalities after arrival at the first port. Consequently, if a ship called at more than one discharge port, all the mortalities after arrival at the first port were included in the discharge phase. See the Methodology section of this report for a more detailed explanation of the voyage phases and instances of loading and
split-discharging.
There were 7 voyages to the Middle East/North Africa in 2015 for which sheep were loaded at more than one port in Australia (split-load voyages). Mortalities for split-load voyages were attributed to the port of loading for all voyages in 2015. Where analysis involves split-load voyages, the consignments of sheep from each load port have been considered as separate “voyages”.
Using the above definition of voyage, there were 38 "voyages" of sheep to the Middle East/North Africa during 2015. This involved 31 ship journeys, 7 of which were split-loaded.
2,005,913 sheep were exported to the Middle East/North Africa (99.6% of all sheep exported) and the average voyage length (voyage to first discharge port) for exports to this region was 16.96 days, with 5.73 days for discharge (most voyages had multiple discharge ports). The overall mortality for these sheep was 0.62%.
Malaysia was the destination country for the 8,458 sheep (0.4% of all sheep exported) that were exported to South-East Asia on 3 voyages. The overall mortality rate for these sheep was 0.84% with an average voyage length of 14.68 days and an additional 0.70 days for discharge. These sheep will not be examined further in this report.
Table 1 Mortality rates, number of voyages, voyage and discharge days, and number of sheep exported for voyages to major destination regions during 2015
Parameter ME/N Africa SE Asia Total
Voyages (No.) 38 3 41
Destination Country
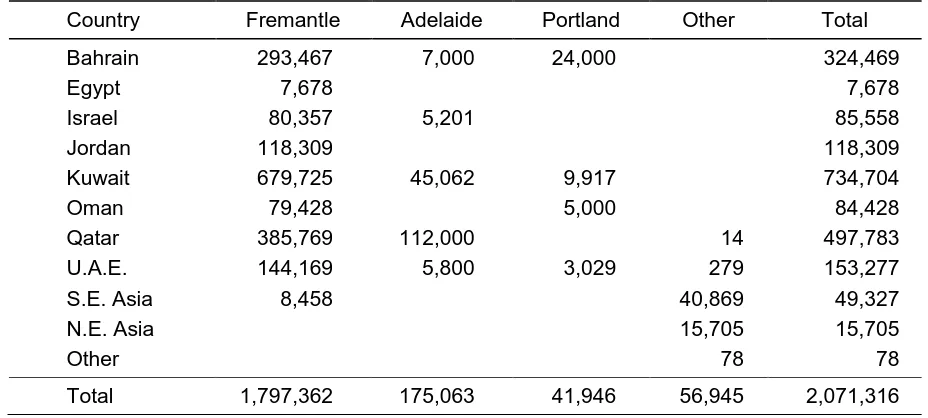
Countries that imported Australian sheep in 2015 are shown in Table 2. The main importing countries were Kuwait (36% of all Australian sheep exports), followed by Qatar (24%) and Bahrain (16%).
Overall export numbers fell by 9.9% compared to 2014. Markets changed variously, but the biggest changes contributing to the overall fall in exports were for Jordan, Kuwait, Egypt and Qatar, which experienced falls of 59%, 16%, 90% and 11% respectively.
Table 2 Destination country for sheep exported from Australia during 2015
Country Fremantle Adelaide Portland Other Total
Bahrain 293,467 7,000 24,000 324,469
Egypt 7,678 7,678
Israel 80,357 5,201 85,558
Jordan 118,309 118,309
Kuwait 679,725 45,062 9,917 734,704
Oman 79,428 5,000 84,428
Qatar 385,769 112,000 14 497,783
U.A.E. 144,169 5,800 3,029 279 153,277
S.E. Asia 8,458 40,869 49,327
N.E. Asia 15,705 15,705
Other 78 78
Total 1,797,362 175,063 41,946 56,945 2,071,316
Note: figures include exports by air.
4.1.3 Middle East/North Africa
4.1.3.1 Port of loading
Most sheep exported by sea from Australia to the Middle East/North Africa during 2015 were loaded at Fremantle (89.2%, Figure 3) with smaller numbers loaded at Adelaide (8.7%), and Portland (2.1%).
Figure 3 Number of sheep exported by sea to the Middle East/North Africa from Fremantle (Western Australia), Portland (Victoria) and Adelaide (South Australia) since 2006
0.0 0.5 1.0 1.5 2.0 2.5 3.0 3.5
06 07 08 09 10 11 12 13 14 15
Loa
de
d
(mi
ll
ion)
X
Year Fremantle
The number and class of sheep exported by sea to the Middle East/North Africa from Fremantle, Adelaide and Portland during 2015 are shown in Table 3 (below). Overall numbers exported to the region in 2015 fell by 10.0% compared to 2014, with exports from Fremantle, Adelaide and Portland falling by 5.8%, 35.3% and 27.4 % respectively.
The main changes in 2015 compared to 2014 were decreases in exports of adult wethers (-12%) and ram lambs (-51%). The fall in adult wethers comprised decreases of -7%, -35% and -1% for Fremantle, Adelaide and Portland respectively, while the fall in ram lambs comprised a 41% decrease from
Fremantle and almost a 100% decrease from Portland.
Other than small increases in wether and ewe hoggets, and a 63% increase in ewe lambs, all other class numbers fell during 2015.
Table 3 The numbers and classes of sheep exported by sea to the Middle East/North Africa from Fremantle, Adelaide and Portland during 2015
Class of Sheep Fremantle Adelaide Portland Total
Wethers adults 955,941 161,606 41,917 1,159,464
hoggets 185,953 185,953
lambs 469,824 8,649 478,473
Rams adults 34,424 404 34,828
hoggets 10,281 2,700 12,981
lambs 35,471 996 29 36,496
Ewes adults 65,782 65,782
hoggets 3,986 3,986
lambs 27,242 708 27,950
4.1.3.2 Mortality rates
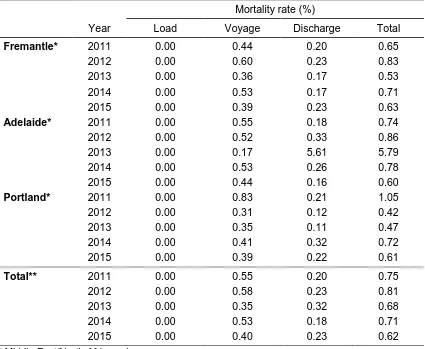
The total mortality rate for all sheep exported to all destination regions during 2015 was 0.62% (Table 4, below), a decrease from the 0.71% observed in 2014 and a new record low, surpassing the 0.68% observed in 2013.
Fremantle voyage and overall mortality rates fell by 25% and 11 % respectively compared to 2014 levels, while the discharge mortality rate rose by 24% (Table 4 and Figure 4).
Adelaide voyage, discharge and overall mortality rates fell by 17%, 39% and 33% respectively.
Similarly, Portland voyage, discharge and overall mortality rates fell by 5%, 31% and 15% respectively.
One high-mortality voyage each for 2013 and 2014 will not be included in some analyses, as the high mortalities occurred under exceptional circumstances, and would distort the study of long term trends. Where this exclusion applies, text, tables and figures are appropriately annotated. Federal Department of Agriculture investigation summaries regarding these voyages are referred to in 6.2 Appendix 2.
There were no high mortality investigations conducted for sheep exported by sea during 2015.
Table 4 Annual shipboard mortality rates for all sheep exported from Fremantle, Adelaide and Portland to the Middle East/North Africa, and the Total mortality rate for all sheep exported to all destinations
Mortality rate (%)
Year Load Voyage Discharge Total
Fremantle* 2011 0.00 0.44 0.20 0.65
2012 0.00 0.60 0.23 0.83
2013 0.00 0.36 0.17 0.53
2014 0.00 0.53 0.17 0.71
2015 0.00 0.39 0.23 0.63
Adelaide* 2011 0.00 0.55 0.18 0.74
2012 0.00 0.52 0.33 0.86
2013 0.00 0.17 5.61 5.79
2014 0.00 0.53 0.26 0.78
2015 0.00 0.44 0.16 0.60
Portland* 2011 0.00 0.83 0.21 1.05
2012 0.00 0.31 0.12 0.42
2013 0.00 0.35 0.11 0.47
2014 0.00 0.41 0.32 0.72
2015 0.00 0.39 0.22 0.61
Total** 2011 0.00 0.55 0.20 0.75
2012 0.00 0.58 0.23 0.81
2013 0.00 0.35 0.32 0.68
2014 0.00 0.53 0.18 0.71
2015 0.00 0.40 0.23 0.62
* Middle East/North Africa only
Figure 4 Annual mortality for sheep exported from Fremantle, Adelaide and Portland to
the Middle East/North Africa from 2006 to 2015
0.0 0.2 0.4 0.6 0.8 1.0 1.2 1.4 1.6 1.8 2.0
06 07 08 09 10 11 12 13 14 15
M or ta li ty (% ) X Fremantle Discharge Voyage Loading 0.0 0.2 0.4 0.6 0.8 1.0 1.2 1.4 1.6 1.8 2.0
06 07 08 09 10 11 12 13 14 15
M or ta li ty (% ) X Adelaide Discharge Voyage Loading
Note – one exceptional voyage excluded for 2013
0.0 0.2 0.4 0.6 0.8 1.0 1.2 1.4 1.6 1.8 2.0
06 07 08 09 10 11 12 13 14 15
4.1.3.3 Class of sheep
The mortality rates of various classes of sheep exported from Australia to the Middle East/North Africa are shown in Table 5 and Figure 5 (below). The highest total mortality rate for 2015 was in wether lambs (0.77%), followed by all the classes of rams, with ram adults, hoggets and lambs incurring 0.67%, 0.70% and 0.64% respectively (refer to Table 3 for numbers loaded).
Along with adult ewes, the ram classes have consistently been high over the last decade, their contribution to overall mortality being limited by their numbers exported. See further discussion at Section 4.1.3.7 Implications of long-term seasonal mortality patterns.
Table 5 Overall mortality (%) for classes of sheep exported from Fremantle, Adelaide and Portland to the Middle East/North Africa in 2015
Class of Sheep Fremantle Adelaide Portland Total
Wethers adults 0.57 0.63 0.60 0.58
hoggets 0.54 n/a n/a 0.54
lambs 0.78 0.20 n/a 0.77
Rams adults 0.68 0.00 n/a 0.67
hoggets 0.84 0.19 n/a 0.70
lambs 0.64 0.60 10.34* 0.64
Ewes adults 0.50 n/a n/a 0.50
hoggets 0.08 n/a n/a 0.08
lambs 0.61 0.28 n/a 0.60
n/a - not applicable (no sheep of this class were loaded) * - a few deaths in a very small number loaded
Figure 5 Overall mortality (%) for classes of sheep exported from Fremantle, Adelaide and Portland to the Middle East/North Africa in 2015
WA = wether adults WH = wether hoggets WL = wether lambs RA = ram adults RH = ram hoggets RL = ram lambs EA = ewe adults EH = ewe hoggets EL = ewe lambs
0.0 0.2 0.4 0.6 0.8 1.0 1.2 1.4 1.6 1.8 2.0
WA WH WL RA RH RL EA EH EL
M
or
ta
li
ty
(%
)
Fremantle Adelaide Portland
10.34%
4.1.3.4 Time of year
Though first half mortalities for Adelaide were higher (0.63% and 0.57% respectively), the difference was not significant. Portland exported sheep only in the first half of the year.
Figure 6 Mortality (%) for sheep exported by sea from Fremantle, Adelaide and Portland to the Middle East/North Africa for the first and second half of each year from 2006 to 2015
0.0 0.5 1.0 1.5 2.0 2.5
06 07 08 09 10 11 12 13 14 15
M
or
ta
li
ty
(%
)
Fremantle Discharge Voyage Loading
15
06 07 08 09 10 11 12 13 14 15
06 07 08 09 10 11 12 13 14
0.0 0.5 1.0 1.5 2.0 2.5
06 07 08 09 10 11 12 13 14 15
M
or
ta
li
ty
(%
)
Adelaide Discharge Voyage Loading
15
06 07 08 09 10 11 12 13 14
Note – one exceptional voyage excluded in 2013
0.0 0.5 1.0 1.5 2.0 2.5
05 06 07 08 09 10 11 12 13 14
M
or
ta
li
ty
(%
)
Portland Discharge
Voyage Loading
15
06 07 08 09 10 11 12 13 14 15
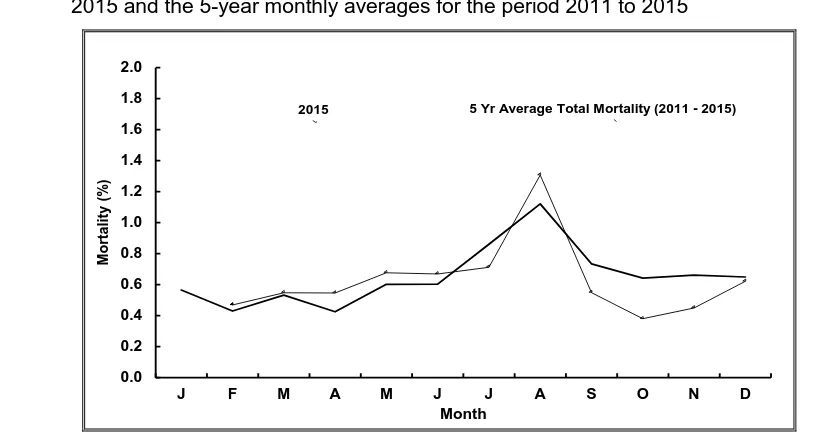
In 2015, monthly mortality rates (total mortality as a proportion of total loaded for each month) in sheep exported from Fremantle approximated the 5-year average profile, apart from being unusually lower from September to November (Figure 7, below). There were no exports from Fremantle in January 2015.
Figure 7 Monthly mortality rates for shipments from Fremantle to the Middle East/North Africa in 2015 and the 5-year monthly averages for the period 2011 to 2015
0.0 0.2 0.4 0.6 0.8 1.0 1.2 1.4 1.6 1.8 2.0
J F M A M J J A S O N D
M
or
ta
li
ty
(%
)
X
Month
5 Yr Average Total Mortality (2011 - 2015) 2015
4.1.3.5 Time of year and age of sheep
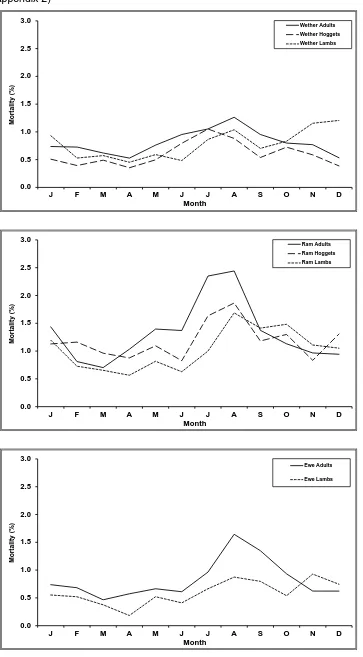
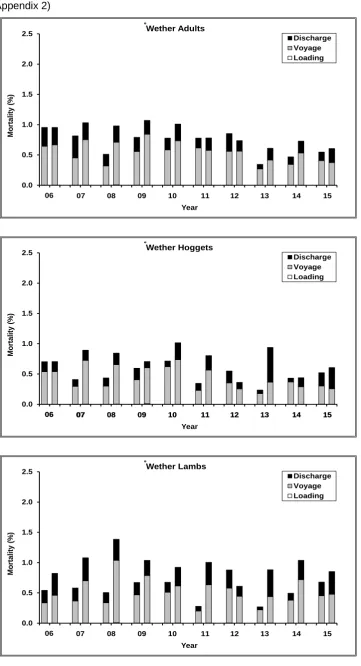
Figure 8, below, shows the monthly mortality rates (total mortality as a proportion of total loaded for each month) in wether and ram adults, hoggets and lambs, and ewe adults and lambs, exported from Australia to the Middle East/North Africa from 2006 to 2015. Results for ewe hoggets are not presented because of the paucity of data.
Figure 9, below, shows the mortality rates in the first and second half of the year for the wether classes from 2006 to 2015. There were significantly more deaths (P < 0.05) in the second half of the year than in the first half for each year and each age category of wethers, with the following exceptions: adult and hogget wethers in 2006, and adult wethers in 2011, and all three wether classes in 2012.
The return to the expected pattern for all wether classes in 2013 was also evident in all three ram classes and in adult ewes (results not presented). In 2013 ewe lambs showed higher mortalities in the first half of the year, but the difference was not significant.
The reversal in the expected half-year mortality pattern that occurred in 2012 was quite remarkable, occurring in seven classes (all wethers, all rams and ewe lambs) out of the nine classes of sheep routinely examined in this report series. The return to the expected pattern in 2013 and continuing so, has been quite definite.
Figure 8 Monthly mortality (%) for wether and ram adults, hoggets and lambs, and ewe
adults and lambs, exported by sea from Australia to the Middle East/North Africa from 2006 to 2015 (note - one exceptional voyage each for 2013 and for 2014 excluded; see 6.2 Appendix 2)
0.0 0.5 1.0 1.5 2.0 2.5 3.0
J F M A M J J A S O N D
M
or
ta
li
ty
(%
)
Month
Wether Adults Wether Hoggets Wether Lambs
0.0 0.5 1.0 1.5 2.0 2.5 3.0
J F M A M J J A S O N D
M
or
ta
li
ty
(%
)
Month
Ram Adults Ram Hoggets Ram Lambs
0.0 0.5 1.0 1.5 2.0 2.5 3.0
J F M A M J J A S O N D
M
or
ta
li
ty
(%
)
Month
Figure 9 Mortality (%) for wether adults, hoggets and lambs exported by sea from
Australia to the Middle East/North Africa for the first and second half of each year from 2006 to 2015 (note – one exceptional voyage each for 2013 and for 2014 excluded; see 6.2 Appendix 2)
0.0 0.5 1.0 1.5 2.0 2.5
06 07 08 09 10 11 12 13 14 15
M
or
ta
li
ty
(%
)
Year
Wether Adults
Discharge Voyage Loading
15
06 07 08 09 10 11 12 13 14
0.0 0.5 1.0 1.5 2.0 2.5
06 07 08 09 10 11 12 13 14 15
M
or
ta
li
ty
(%
)
Year
Wether Hoggets
Discharge Voyage Loading
15
06 07 08 09 10 11 12 13 14 15
06 07 08 09 10 11 12 13 14
0.0 0.5 1.0 1.5 2.0 2.5
06 07 08 09 10 11 12 13 14 15
M
or
ta
li
ty
(%
)
Year
Wether Lambs
Discharge Voyage Loading
15
4.1.3.6 Class numbers and mortality rates over time
Adult wethers are the mainstay of the live sheep export trade, and, by sheer weight of numbers, the largest component of mortalities. This can be easily demonstrated by comparing class numbers exported over time and their corresponding mortality rates.
It can be seen that Wether Adults (WA) stand out as the main class exported, followed by Wether Lambs (WL), with Wether Hoggets (WH) and Ram Lambs (RL) sharing third position (Figure 10, below).
Figure 10 Numbers by class of sheep exported from Australia, 1997 to 2015
0 1 2 3 4 5 6 7
97 98 99 00 01 02 03 04 05 06 07 08 09 10 11 12 13 14 15
S
he
e
p
e
x
por
te
d
(m
il
li
on)
Year
EL
EA
RL
RH
RA
WL
WH
WA
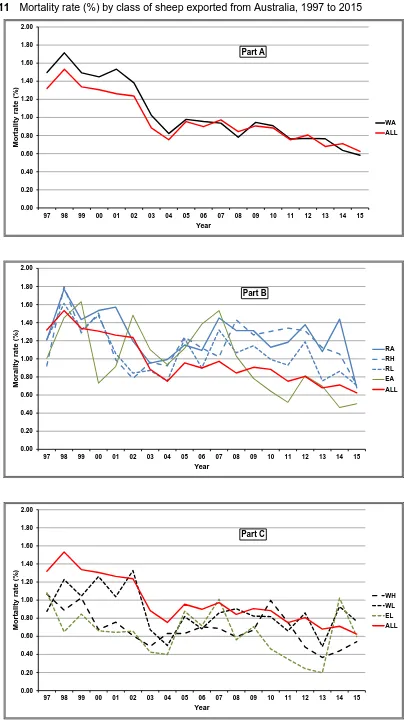
Figure 11 (below) shows that the overall mortality rate is closely linked to the Adult Wether mortality (part A). It can also be seen that ram classes have had consistently high mortality rates over time, with Ram Adults (RA) nearly always highest (Part B).
The Adult Ewes (EA) mortality rate has swung wildly over the time, but the three ram classes have remained alone the highest from 2008 onward.
Figure 11 Mortality rate (%) by class of sheep exported from Australia, 1997 to 2015 0.00 0.20 0.40 0.60 0.80 1.00 1.20 1.40 1.60 1.80 2.00
97 98 99 00 01 02 03 04 05 06 07 08 09 10 11 12 13 14 15
M or ta li ty r a te (% ) Year Part A WA ALL 0.00 0.20 0.40 0.60 0.80 1.00 1.20 1.40 1.60 1.80 2.00
97 98 99 00 01 02 03 04 05 06 07 08 09 10 11 12 13 14 15
M o ralit y r at e ( % ) Year Part B RA RH RL EA ALL 0.00 0.20 0.40 0.60 0.80 1.00 1.20 1.40 1.60 1.80 2.00
97 98 99 00 01 02 03 04 05 06 07 08 09 10 11 12 13 14 15
4.1.3.7 Implications of long-term seasonal mortality patterns
Seasonal differences in mortality can be demonstrated for all classes of sheep studied in this series of reports, except for ewe hoggets, which are not exported in sufficient numbers to bring reliable
conclusions.
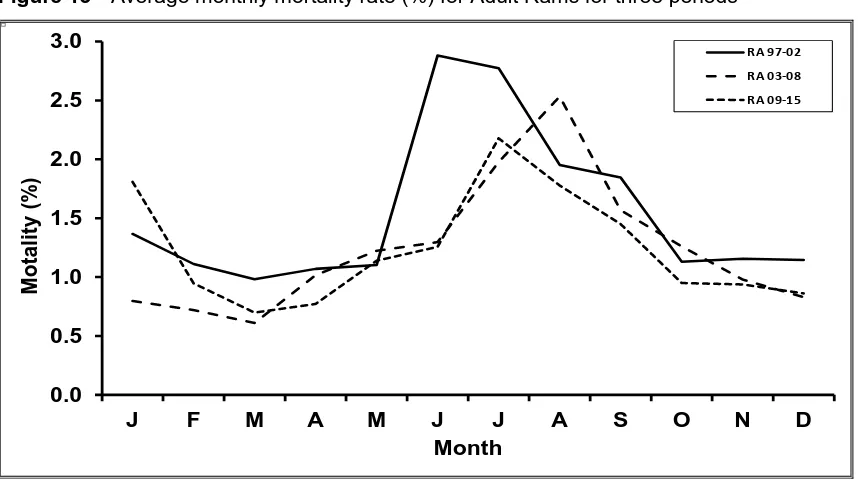
It is useful to compare the long-term mortality profiles of Adult Wethers, the main component of overall mortality rate, and Adult Rams, the class with the highest mortality rate.
Figures 12 and 13 (below) show monthly mortality rates (total mortality as a proportion of total loaded for each month) over three periods, 1997-2002, 2003-2008 and 2009-2015, for Adult Wethers and Adult Rams respectively. While the overall pattern for Adult Wethers has reduced more noticeably over time, these periods demonstrate the enduring stability of the seasonal difference.
Figure 12 Average monthly mortality rate (%) for Adult Wethers for three periods
0.0 0.5 1.0 1.5 2.0 2.5 3.0
J F M A M J J A S O N D
M
ota
li
ty
(%
)
Month
WA 97-02
WA 03-08
WA 09-15
Figure 13 Average monthly mortality rate (%) for Adult Rams for three periods
0.0 0.5 1.0 1.5 2.0 2.5 3.0
J F M A M J J A S O N D
M
ota
li
ty
(%
)
Month
RA 97-02
RA 03-08
It can be seen that there is a consistent seasonal difference, with the lowest mortality rates occurring in sheep loaded from February to May, and the highest occurring in those loaded from June through to September.
While the mortality rates of the Ram classes particularly, and of Adult Ewes sporadically, have been highest, their impact on the overall mortality rate has been limited by the small numbers exported.
Nevertheless, overall mortality rate could be expected to increase if more sheep, and particularly more of the higher mortality classes, are exported between June and September.
With a constant annual cycle of exports, mortality rates and numbers would be expected to remain steady, however events such as the festivals of importing countries are not fixed in the calendar. As the Islamic calendar tracks forward by approximately 11 days each year, the requirement for suitable numbers and classes of sheep also advances each year.
It could be reasonably predicted that as exports for the festival of Eid Al Adha (mid-September in 2016) come forward into the highest mortality months of June - September, overall mortalities will rise
significantly with the increased contribution of mortalities, particularly from Ram classes. This might be expressed in a general rise over the at-risk period, or as an increase in the number of high mortality voyages breaching the reportable limits of DA / AMSA.
Higgs et al (1991) first documented in detail the seasonal mortality difference in relation to the Live Sheep Export Trade, and brought to light the enduring monthly mortality reverse ‘tilde’ pattern for Adult Wethers exported to the Middle East (Figure 14, below).
Figure 14 Average monthly voyage mortality rate (%) for Adult Wethers exported to the Middle East
over the period from 1985 to 1990
Since a similar established reverse ‘tilde’ pattern can be seen in other classes, the possibility of generating a rudimentary predictor of annual mortalities can be seen.
Forward-estimates of numbers and classes to be shipped and at what time of the year, may be matched against the long-term mortality pattern to predict overall mortalities.
The reduced overall (reverse ‘tilde’) mortality pattern in the live sheep export trade is undoubtedly associated with the tendency towards exporting younger wethers to meet the changing market requirements, as well as improved ship design and management.
4.1.3.8 Ship
The voyages of each ship were classified into low (mortality rate up to 1.0%), medium (mortality rate from 1.0 to 2.0%) and high (mortality rate greater than 2.0%) mortality categories for sheep exported to the Middle East/North Africa from Fremantle (Table 6a, below), and Adelaide (Table 6b, below). There was only one voyage from Portland during 2015.
There were no voyages in the “high” category in 2015. Approximately 90% of voyages from Fremantle, and 100% of voyages from Adelaide and Portland were in the “low” category.
Table 6a Number of voyages in low, medium and high mortality categories for ships loaded at Fremantle in 2015
Mortality rate
Ship (code)
Low <1.0%
Medium 1.0–2.0%
High >2.0%
Total
32 8 1 0 9
33 2 1 0 3
34 6 0 0 6
35 7 0 0 7
43 1 0 0 1
44 2 0 0 2
46 2 1 0 3
Total 28 3 0 31
Table 6b Number of voyages in low, medium and high mortality categories for ships loaded at Adelaide in 2015
Mortality rate
Ship (code)
Low <1.0%
Medium 1.0–2.0%
High >2.0%
Total
32 1 0 0 1
33 2 0 0 2
35 1 0 0 1
43 1 0 0 1
46 1 0 0 1
4.2 Cattle
4.2.1 Performance trend
The number of cattle shipped from all ports in Australia to all destinations since 2006, as well as the trend line (linear regression) across those years, is shown in Figure 15 (below). Figure 16 (below) shows the number of cattle mortalities during sea transport since 2006. The number of cattle exported annually has varied from approximately 620,000 to 1,310,000, and the annual mortality has varied between 0.10 and 0.18%. The overall trend for numbers of cattle exported is upwards, whereas the trend for annual mortality is slightly downward.
Figure 15 Number of cattle exported by sea from Australia to all destinations since 2006
0.5 0.6 0.7 0.8 0.9 1.0 1.1 1.2 1.3 1.4
06 07 08 09 10 11 12 13 14 15
L
o
ad
No
. (
x
1,000,000)
X
Year
Figure 16 Annual mortality of cattle exported by sea from Australia to all destinations since 2006
0.00 0.02 0.04 0.06 0.08 0.10 0.12 0.14 0.16 0.18 0.20
06 07 08 09 10 11 12 13 14 15
M
or
ta
li
ty
(%
)
X
Year
Discharge
Voyage
4.2.2 Overview
The live cattle trade from Australia in 2015 was characterised by the large number of loading ports in Australia and regions to which the animals were shipped. This differs from the live sheep trade with only three ports of loading, and nearly all sheep shipped to the Middle East/North Africa.
There were 15 ship journeys in 2015 for which cattle were loaded at more than one port in Australia. One of these, a three-port loading, had a single destination, while the remaining 14 were again split for discharge into 39 separate “voyages”, variously for prolonged length of time between discharge ports or for covering both short and long-haul voyage periods, as discussed in Part 3 – Methodology.
Mortalities for split-load voyages were able to be attributed to loading ports for all voyages in 2015.
There were 380 cattle "voyages" during 2015. This involved 343 ship journeys, which was 5% more than in 2014. Where analysis involving split-load/discharge voyages has been performed, cattle
consignments from each load port to each discharge port have been considered as separate “voyages’.
Ten single-port loaded voyages were split into two for destination, where the separated “voyage” times fell below and above the ten-day AMSA definition for short and long-haul voyages.
The overall number of cattle exported from Australia in 2015 rose by 2% compared to 2014, to a record of 1.31 million (Table 7, below). The overall mortality rate in 2015 was 0.10%, well below the figure of 0.12% observed in 2014. 32% of all cattle voyages returned a nil mortality rate during 2015.
The highest overall mortality rate on a regional basis was for exports to South-East Europe (0.53%), while the lowest overall mortality rate was for exports to Miscellaneous Destinations (0.07%).
Exports to Miscellaneous Destinations comprised three voyages carrying a total of 4,401 cattle with 3 mortalities (0.07%). Voyage and discharge days were an average of 13.69 and 0.55 days respectively. These voyages will not be examined further in this report.
The number of cattle exported to the Middle East/North Africa in 2015 fell by 6% compared to 2014, while the number of voyages rose by 24%. The mortality rate to the region fell from 0.36% in 2014 to 0.25% in 2015.
Exports to South-East Asia rose by 7% in 2015 compared to 2014 to a record high of 1.07 million, while the number of voyages rose by 17% (310 and 266 respectively). Trade to South-East Asia accounted for 81% of all cattle exported in 2015 (up from 78% in 2014), while trade to all other regions fell.
Exports to South-East Asia involve a mix of smaller ships performing short single-load/single-discharge voyages, and larger ships which load and/or discharge at more than one port. In 2015 these larger vessels accounted for 43% of the cattle exported and 26% of the voyages made to South-East Asia.
Exports to North-East Asia in 2015 fell by 21% compared to 2014, while the mortality rate fell from 0.14% to 0.08%.
Exports to South-East Europe fell by 25%, however the mortality rate rose from 0.47% to 0.53%.
Table 7 Mortality rates, number of voyages, voyage and discharge days, and number of cattle exported for voyages to major destination regions during 2015
Parameter ME/N Africa SE Asia NE Asia Misc SE Europe Total
Voyages (No.) 31 310 32 3 4 380
Cattle (No.) 99,558 1,066,664 98,213 4,401 40,666 1,309,502
Mortality rate o/all (%) 0.25 0.08 0.08 0.07 0.53 0.10
Mortality rate range (%) 0.00 – 0.78 0.00 – 3.68 0.00 – 0.56 0.00 – 0.23 0.23 – 0.79 0.00 – 3.68
Voyage days (Ave.) 19.10 8.34 17.35 13.69 30.52 10.254
Discharge days (Ave.) 3.21 1.52 0.66 0.55 3.59 1.60
Voyages with nil mortalities (No.)
4.2.3 Middle East/North Africa
The number of live cattle exported to the Middle East/North Africa during 2015 fell by 6% compared to 2014 (Table 8, below), despite the number of voyages increasing by 24%. Overall mortality rates have remained at or below 0.5% over the last decade. In 2015 the mortality rate was 0.25%, which is below the 0.28% average across the decade.
Table 8 Mortality rates, number of voyages, average voyage and discharge length, and number of cattle exported to the Middle East/North Africa from 2006 to 2015
Year Voyages (No.)
Cattle (No.)
Mortality rate overall (%)
Mortality rate range (%)
Voyage days
Discharge days
Nil mortality voyages (No.)
2006 43 119,297 0.52 0.00 – 4.27 16.05 4.42 13
2007 41 74,256 0.19 0.00 – 0.54 16.43 4.23 16
2008 46 120,122 0.29 0.00 – 0.79 17.09 5.02 19
2009 41 98,183 0.33 0.00 – 1.78 15.37 4.62 13
2010 37 163,869 0.40 0.00 – 1.62 17.57 3.75 14
2011 28 80,180 0.17 0.00 – 0.67 17.91 3.14 10
2012 31 98,236 0.16 0.00 – 0.86 18.53 2.74 11
2013 33 121,780 0.17 0.00 – 0.44 19.28 3.99 12
2014 25 106,065 0.36 0.00 – 2.75 19.21 4.72 11
2015 31 99,558 0.25 0.00 – 0.78 19.10 3.21 12
4.2.3.1 Port of loading
There were 4 ports of loading for voyages to the Middle East/North Africa in 2015, with the majority of cattle exported from Fremantle (Table 9, below). Mortality rates in 2015 were highest from Adelaide, followed by Broome and Portland.
The voyages from each port were classified into various mortality categories as shown in Table 10 (below). There were three voyages in the medium or high categories, one loading in Fremantle and two in Adelaide.
All voyages for Portland and Broome were in the nil or low categories, as were 96% and 33% of voyages for Fremantle and Adelaide respectively.
Table 9 Mortality rates, number of voyages, average voyage and discharge length, and number of cattle exported from various ports to the Middle East/North Africa for 2015
Port Voyages (No.)
Cattle (No.)
Mortality rate overall (%)
Mortality rate range (%)
Voyage days
Discharge days
Fremantle 23 74,992 0.21 0.00 – 0.70 17.40 3.95
Broome 1 9,796 0.25 n/a 25.86 2.92
Table 10 Number of voyages in nil, low, medium and high mortality categories for shipments from various ports to the Middle East/North Africa for 2015
Mortality rate
Port Nil 0.0%
Low >0.0–0.5%
Medium >0.5–1.0%
High >1.0%
Total
Fremantle 10 12 1 0 23
Portland 1 3 0 0 4
Adelaide 1 0 2 0 3
Broome 0 1 0 0 1
Total 12 16 3 0 31
4.2.3.2 Time of year
In 2015, monthly mortality rates (total mortality as a proportion of total loaded for each month) in cattle exported from all ports to the Middle East/North Africa remained well below 0.5% throughout the year, except for the month of April (Figure 17, below). The monthly mortality rate profile for 2015
approximated the 5-year average, except for the months of March and April.
Note that one 2014 exceptional voyage has been excluded from the data. If this voyage was included, the January percentage for the 5-year average profile would have been 0.33%. A Federal Department of Agriculture investigation summary regarding this voyage is referred to in 6.2 Appendix 2.
Figure 17 Monthly mortality rates of cattle on voyages from all ports to the Middle East/North Africa
for 2015 and the 5-year average monthly rates for the period 2011 to 2015
0.0 0.1 0.2 0.3 0.4 0.5 0.6 0.7 0.8 0.9 1.0
J F M A M J J A S O N D
M
or
ta
li
ty
(%
)
Month
4.2.3.3 Ship
The voyages of each ship carrying cattle from Australia to the Middle East/North Africa were classified into four mortality categories: nil (no mortalities); low (mortality rate up to 0.5%); medium (from 0.5 to 1.0%); and high (greater than 1.0%). Note that for this comparison, “voyage” equates to consignment from a port. If a ship loaded at two ports, then two “voyages” are shown, one for each port.
Table 11 (below) shows the number of voyages in the various mortality categories for each ship. There were three voyages in the medium or high categories, involving ships 43 and 46. 90% of voyages were in the nil or low categories.
Table 11 Number of voyages in nil, low, medium and high mortality categories for shipments to the Middle East/North Africa for 2015
Mortality rate
Ship (code)
Nil 0.0%
Low >0.0–0.5%
Medium >0.5–1.0%
High >1.0%
Total
32 3 0 0 0 3
33 0 2 0 0 2
34 2 0 0 0 2
35 5 2 0 0 7
43 0 1 1 0 2
44 0 2 0 0 2
46 1 2 2 0 5
47 0 1 0 0 1
103 1 1 0 0 2
120 0 2 0 0 2
128 0 3 0 0 3
Total 12 16 3 0 31
4.2.3.4 Class of cattle
In 2015, the highest overall class mortality rate occurred in adult bulls (0.90%) (Table 12, below)). Bull classes made up 72% of all cattle shipped to Middle East/North Africa in 2015.
Table 12 Mortality rates, number of voyages and number of cattle in various classes exported to the Middle East/North Africa in 2015
Class Voyages (No.)
Cattle (No.)
Mortality rate overall (%)
Mortality rate range (%)
Bull adult* 20 49,498 0.33 0.00 – 0.90 Bull weaner 8 21,714 0.18 0.00 – 0.31 Steer adult* 15 14,512 0.20 0.00 – 0.45 Heifer beef 10 7,819 0.10 0.00 – 0.18 Heifer dairy 7 5,004 0.20 0.00 – 0.43 Steer weaner 4 1,011 0.59 0.00 – 0.72
4.2.4 South-East Asia
A record-breaking 1.07 million cattle were exported to South-East Asia in 2015 (Table 13, below), representing an increase of 7% compared to 2014. The mortality rate for voyages to the region remained at 0.08%, while the number of voyages rose by 17%. A nil mortality rate was reported on 33% of the voyages to the region. The mortality rate has remained at or below 0.1% over the last decade, the average being 0.07%.
Table 13 Mortality rates, number of voyages, average voyage and discharge length, and number of cattle exported to South-East Asia from 2006 to 2015
Year Voyages (No.)
Cattle (No.)
Mortality rate overall (%)
Mortality rate range (%)
Voyage days
Discharge days
Nil mortality voyages (No.)
2006 166 452,516 0.09 0.00 – 1.04 6.24 1.38 66
2007 205 573,729 0.09 0.00 – 4.01 6.47 1.10 92
2008 219 682,264 0.10 0.00 – 1.93 6.33 1.14 93
2009 288 795,465 0.08 0.00 – 0.83 6.27 0.99 130
2010 202 551,761 0.04 0.00 – 0.44 6.47 0.86 105
2011 113 446,708 0.04 0.00 – 0.79 6.95 1.72 55
2012 127 361,383 0.04 0.00 – 0.80 6.71 1.32 63
2013 177 594,457 0.08 0.00 – 0.73 7.27 1.92 71
2014 266 995,138 0.08 0.00 – 3.52 7.66 1.55 96
2015 310 1,066,664 0.08 0.00 – 3.68 8.34 1.52 102
4.2.4.1 Port of loading
Most cattle exported to South-East Asia in 2015 were loaded at Darwin (43%) followed by Townsville (27%) and Broome (10%) (Table 14, below). The mortality rate was highest for cattle exported from Portland (0.43%) followed by Fremantle (0.14%) and Townsville (0.09%).
The voyages from each port were classified into various mortality categories as shown in Table 15 (below). 99% of voyages were in the nil or low categories in 2015. There were three voyages in the medium category and one in the high category, involving the ports of Darwin, Fremantle and Portland.
Table 14 Mortality rates, number of voyages, average voyage and discharge length, and number of cattle exported from various ports to South-East Asia in 2015
Port Voyages
(No.)
Cattle (No.)
Mortality rate overall (%)
Mortality rate range (%)
Voyage days
Discharge days
Darwin 164 514,972 0.06 0.00 – 3.68* 6.85 1.35
Townsville 61 305,417 0.09 0.00 – 0.48 10.33 1.84
Broome 27 103,007 0.07 0.00 – 0.49 7.15 1.64
Fremantle 24 55,959 0.14 0.00 – 0.94 13.78 1.80
Wyndham 12 39,418 0.03 0.00 – 0.24 7.08 1.11
Geraldton 8 19,602 0.03 0.00 – 0.12 7.55 1.36
Karumba 11 17,123 0.04 0.00 – 0.30 9.72 1.42
Portland 2 7,002 0.43 0.24 – 0.51 21.25 1.48
Adelaide 1 4,164 0.02 n/a 13.09 7.18
Table 15 Number of voyages in nil, low, medium and high mortality categories for
shipments from various ports to South-East Asia for 2015
Mortality rate
Port Nil 0.0%
Low >0.0–0.5%
Medium >0.5–1.0%
High >1.0%
Total
Darwin 64 98 1 1 164
Townsville 7 54 0 0 61
Broome 5 22 0 0 27
Fremantle 6 17 1 0 24
Wyndham 7 5 0 0 12
Karumba 7 4 0 0 11
Geraldton 6 2 0 0 8
Portland 0 1 1 0 2
Adelaide 0 1 0 0 1
Total 102 204 3 1 310
4.2.4.2 Time of year
Monthly mortality rates (total mortality as a proportion of total loaded for each month) for voyages to South-East Asia in 2015 were at or below 0.10% for the year, except for the months of February, July and September (Figure 18, below).
While some voyages were higher than average in September, all were well below the reportable levels of 0.5% for voyages under 10 days duration and 1.0% for voyages of 10 days duration and over.
The monthly mortality rate profile for 2015 approximated that of the 5-year average, except for the months mentioned above.
Figure 18 Monthly mortality rates of cattle on voyages from all ports to South-East Asia for 2015 and
the 5-year average monthly rates for the period 2011 to 2015
0.00 0.02 0.04 0.06 0.08 0.10 0.12 0.14 0.16 0.18 0.20 0.22
J F M A M J J A S O N D
M
or
ta
li
ty
(%
)
Month
4.2.4.3 Ship
The voyages of each ship from Australia to South-East Asia were classified into various mortality categories, as shown in Table 16 (below). All voyages, except four, were in the nil or low mortality categories. There were three voyages in the medium category and one in the high category, involving ships 48, 103 and 125.
The number of voyages to the region rose from 266 in 2014 to 310 in 2015, an increase of 17%.
Ships with a carrying capacity of 6,000 or more head accounted for 26% of voyages to South-East Asia in 2015. They also accounted for 43% of cattle exported, 52% of mortality, 31% of voyage days and 45% of discharge days.
Table 16 Number of voyages in nil, low, medium and high mortality categories for shipments to South East Asia for 2015
Mortality rate
Ship (code)
Nil 0.0%
Low >0.0–0.5%
Medium >0.5–1.0%
High >1.0%
Total
43 1 12 0 0 13
44 1 8 0 0 9
45 1 11 0 0 12
47 1 7 0 0 8
48 2 8 2 0 12
49 1 11 0 0 12
50 4 10 0 0 14
59 4 13 0 0 17
77 7 5 0 0 12
95 10 9 0 0 19
103 4 4 0 1 9
114 11 6 0 0 17
117 9 9 0 0 18
120 1 11 0 0 12
122 6 14 0 0 20
123 6 8 0 0 14
124 7 9 0 0 16
125 3 6 1 0 10
126 7 11 0 0 18
127 4 7 0 0 11
128 3 9 0 0 12
129 1 7 0 0 8
130 8 8 0 0 16
131 0 1 0 0 1
4.2.4.4 Class of cattle
In 2015, 98.68% of cattle exported to South-East Asia were able to be identified by class. The 14,125 cattle that could not be identified by class were exported on 2 voyages, incurring a total mortality of 0.06%. These cattle will not be examined further in this section.
Adult steers and beef heifers comprised 57% and 25% respectively of all classes exported to the region in 2015 (Table 17, below).
The highest mortality rates occurred in beef cows (0.24%) followed by adult bulls (0.13%).
[image:30.595.124.491.259.412.2]Note that high values for mortality rate ranges not included in voyage investigations mentioned at 6.2 Appendix 2, involved only a few deaths in small numbers loaded.
Table 17 Mortality rates, number of voyages and number of cattle in various classes exported to South-East Asia in 2015
Class Voyages (No.)
Cattle (No.)
Mortality rate overall (%)
Mortality rate range (%)
Steer adult* 288 607,921 0.08 0.00 – 0.98 Heifer beef 231 265,178 0.04 0.00 – 1.25 Bull adult* 157 86,394 0.13 0.00 – 13.03† Steer weaner 16 47,704 0.04 0.00 – 0.25 Cow beef 52 28,136 0.24 0.00 – 2.94 Bull weaner 15 10,799 0.07 0.00 – 0.91 Heifer dairy 6 6,139 0.08 0.00 – 0.24
Cow dairy 1 268 0.00 n/a
* may include young as well as mature animals (i.e. animals not separately classified as "weaner") †
4.2.5 North-East Asia
The number of cattle exported to North-East Asia in 2015 fell by 21% compared to 2014, while the number of voyages fell by 18% (Table 18, below). The mortality rate has remained under 0.2% over the last decade, at an average of 0.11%.
[image:31.595.76.547.208.390.2]The North-East Asia cattle trade is characterised by steers exported to Japan and heifers exported to China. Occasional shipments are made to Korea and North-Eastern Russia, however none of these shipments occurred in 2015.
Table 18 Mortality rates, number of voyages, average voyage and discharge length, and number of cattle exported to North-East Asia from 2006 to 2015
Year Voyages (No.)
Cattle (No.)
Mortality rate overall (%)
Mortality rate range (%)
Voyage days
Discharge days
Nil mortality voyages (No.)
2006 26 37,963 0.12 0.00 – 1.29 17.09 1.28 11
2007 21 34,837 0.06 0.00 – 0.20 16.60 1.71 10
2008 19 29,873 0.06 0.00 – 0.36 17.51 1.04 10
2009 23 48,116 0.07 0.00 – 0.22 16.91 0.70 5
2010 34 69,638 0.08 0.00 – 0.33 18.25 0.62 10
2011 31 68,773 0.15 0.00 – 0.46 18.08 0.87 5
2012 30 74,941 0.17 0.00 – 0.70 17.55 0.76 7
2013 31 81,521 0.15 0.00 – 1.18 17.63 0.68 5
2014 39 123,583 0.14 0.00 – 2.04 17.47 0.76 10
2015 32 98,213 0.08 0.00 – 0.56 17.35 0.66 7
4.2.5.1 Port of loading
The majority of cattle exported to North-East Asia in 2015 departed from Portland (70%), followed by Geelong (12%) and Brisbane (10%), with the unusual addition of single voyages from Adelaide and Townsville (Table 19, below). All cattle loaded at Brisbane were exported to Japan, with the remainder being exported to China.
The voyages from each port were classified into various mortality categories as shown in Table 20 (below). During 2015, there no voyages in the high mortality category, while 96% of all voyages were in the nil or low categories.
Table 19 Mortality rates, number of voyages, average voyage and discharge length, and number of cattle exported from various ports to North-East Asia for 2015
Port Voyages
(No.)
Cattle (No.)
Mortality rate overall (%)
Mortality rate range (%)
Voyage days
Discharge days
Portland 18 69,153 0.06 0.00 – 0.25 17.48 0.84
Geelong 2 11,416 0.12 0.10 – 0.15 17.55 0.93
Brisbane 10 10,199 0.15 0.00 – 0.56 16.64 0.22
Townsville 1 4,245 0.19 n/a 24.76* 0.81
Adelaide 1 3,200 0.13 n/a 14.13 1.13
[image:31.595.78.545.567.674.2]Table 20 Number of voyages in nil, low, medium and high mortality categories for
shipments from various ports to North-East Asia for 2015
Mortality rate
Port Nil 0.0%
Low >0.0–0.5%
Medium >0.5–1.0%
High >1.0%
Total
Portland 3 15 0 0 18
Brisbane 4 5 1 0 10
Geelong 0 2 0 0 2
Adelaide 0 1 0 0 1
Townsville 0 1 0 0 1
Total 7 24 1 0 32
4.2.5.2 Time of year
Monthly mortality rates (total mortality as a proportion of total loaded for each month) for voyages to North-East Asia in 2015 were below 0.25% throughout the year. They varied from the 5-year average for the months of March, May, September and October (Figure 19).
Figure 19 Monthly mortality rates of cattle on voyages from all ports to North-East Asia for 2015 and
the 5-year average monthly rates for the period 2011 to 2015
0.00 0.05 0.10 0.15 0.20 0.25 0.30 0.35 0.40
J F M A M J J A S O N D
M
or
ta
li
ty
(%
)
Month
[image:32.595.109.516.91.241.2]4.2.5.3 Ship
The voyages of each ship taking cattle from Australia to North-East Asia were classified into various mortality categories, as shown in Table 21 (below).
[image:33.595.128.491.186.472.2]During 2015 there were no voyages in the high mortality category. There were 96% of voyages in the nil or low categories.
Table 21 Number of voyages in nil, low, medium and high mortality categories for shipments to North-East Asia for 2015
Mortality rate
Ship (code)
Nil 0.0%
Low >0.0–0.5%
Medium >0.5–1.0%
High >1.0%
Total
44 0 1 0 0 1
45 0 1 0 0 1
47 0 3 0 0 3
48 1 0 0 0 1
49 0 1 0 0 1
95 0 2 0 0 2
103 1 1 0 0 2
115 4 5 1 0 10
120 1 1 0 0 2
126 0 1 0 0 1
127 0 3 0 0 3
128 0 3 0 0 3
129 0 1 0 0 1
130 0 1 0 0 1
Total 7 24 1 0 32
4.2.5.4 Class of cattle
Mortality rates for cattle classes exported to North-East Asia during 2015 are shown in Table 22, below.
The North-East Asian cattle trade comprised mainly steers exported to Japan (10%) and heifer classes exported to China (83%).
The highest mortality rates occurred in adult steers (0.15%), followed by dairy cows (0.10%). Note that the high value in the dairy heifer mortality rate range was for a small part of a consignment of cattle that experienced an overall mortality rate of 0.19%, and therefore did not attract a Federal Department of Agriculture investigation.
Table 22 Mortality rate, number of voyages and number of cattle in the classes exported to North-East Asia in 2015
Class Voyages (No.)
Cattle (No.)
Mortality rate overall (%)
Mortality rate range (%)
Heifer dairy 18 69,687 0.08 0.00 – 2.19 Heifer beef 9 12,064 0.07 0.00 – 0.13 Steer adult* 10 10,127 0.15 0.00 – 0.56 Cow dairy 2 6,325 0.10 0.00 – 0.25
Bull adult* 1 10 0.00 n/a
[image:33.595.128.498.661.771.2]4.2.6 South-East Europe
In recent years the significant rise in livestock exports to Turkey and the Black Sea had the effect of excessively boosting the Miscellaneous Destination category. In 2012 a new destination region, South-East Europe, was introduced to allow a more meaningful examination of exports to this area.
The number of cattle exported to South-East Europe has increased significantly since 2009, while mortality rates have remained near 0.5% or less over the ten years surveyed (Table 23, below).
[image:34.595.76.546.235.414.2]The mortality rate in cattle exported to South-East Europe was 0.53% in 2015. Numbers exported fell by 25% compared to 2014.
Table 23 Mortality rates, number of voyages, average voyage and discharge length, and number of cattle exported to South-East Europe from 2006 to 2015
Year Voyages (No.)
Cattle (No.)
Mortality rate overall (%)
Mortality rate range (%)
Voyage days
Discharge days
Nil mortality voyages (No.)
2006 1 3,382 0.09 n/a 19.18 1.98 0
2007 6 7,062 0.18 0.00 – 0.24 26.99 1.18 1
2008 8 14,341 0.11 0.00 – 0.23 25.42 1.17 1
2009 1 3,493 0.37 n/a 41.60 0.96 0
2010 11 78,673 0.44 0.00 – 0.83 25.08 5.03 1
2011 15 83,033 0.51 0.19 – 1.43 26.78 5.00 0
2012 14 75,170 0.28 0.00 – 0.87 28.78 3.58 1
2013 5 44,560 0.18 0.00 – 0.61 24.58 3.87 0
2014 5 54,006 0.47 0.34 – 0.60 25.62 3.88 0
2015 4 40,666 0.53 0.23 – 0.79 30.52 3.59 0
4.2.6.1 Port of loading
All cattle exported to South-East Europe in 2015 were from the southern ports of Adelaide, Portland and Fremantle (Table 24, below). Most cattle were loaded at Adelaide (48%), followed by Portland (42%). The mortality rate was highest for cattle exported from Adelaide (0.76%).
The voyages from each port were classified into various mortality categories, as shown in Table 25 (below). There were no voyages in the high category in 2015.
Table 24 Mortality rates, number of voyages, average voyage and discharge length, and number of cattle exported from various ports to South-East Europe in 2015
Port Voyages
(No.)
Cattle (No.)
Mortality rate overall (%)
Mortality rate range (%)
Voyage days
Discharge days
Adelaide 2 19,541 0.76 0.64 – 0.79 32.89 3.48
Portland 1 17,152 0.34 n/a 28.13 5.19
[image:34.595.77.546.567.646.2]Table 25 Number of voyages in nil, low, medium and high mortality categories for
shipments from various ports to South-East Europe for 2015
Mortality rate
Port Nil 0.0%
Low >0.0–0.5%
Medium >0.5–1.0%
High >1.0%
Total
Portland 0 0 2 0 2
Adelaide 0 1 0 0 1
Fremantle 0 1 0 0 1
Total 0 2 2 0 4
4.2.6.2 Time of year
Monthly mortality rates (total mortality as a proportion of total loaded for each month) for voyages to South-East Europe in 2015 were 0.79%, 0.44% and 0.34% for January, April and November
respectively (Figure 20, below).
For the three months on which voyages occurred during 2015, the monthly mortality profile was quite close to the 5-year average.
Note that one exceptional voyage in 2011 has been excluded from the 5-year average data. If this voyage were included, the June percentage would have been 1.18% for the 5-year average profile. A Federal Department of Agriculture investigation regarding this voyage is referred to in 6.2 Appendix 2.
Figure 20 Monthly mortality rates of cattle on voyages from all ports to South-East Europe for 2015
and the 5-year average monthly rates for the period 2011 to 2015
0.0 0.1 0.2 0.3 0.4 0.5 0.6 0.7 0.8 0.9 1.0
J F M A M J J A S O N D
M
or
ta
li
ty
(%
)
Month
[image:35.595.98.525.410.655.2]4.2.6.3 Ship
[image:36.595.130.494.151.253.2]The voyages of each ship taking cattle from Australia to South-East Europe were classified into various mortality categories as shown in Table 26. There were no voyages in the high category in 2015.
Table 26 Number of voyages in nil, low, medium and high mortality categories for shipments to South-East Europe for 2015
Mortality rate
Ship (code)
Nil 0.0%
Low >0.0–0.5%
Medium >0.5–1.0%
High >1.0%
Total
46 0 1 2 0 3
50 0 1 0 0 1
Total 0 2 2 0 4
4.2.6.4 Class of cattle
Mortality rates for each class of cattle exported to South-East Europe during 2015 are presented in Table 27 (below). Steer classes exported to Russia accounted for all cattle exported to South-East Europe during 2015.
[image:36.595.134.494.397.460.2]In 2015 the highest mortality rates occurred in weaner steers (0.75%).
Table 27 Mortality rate, number of voyages and number of cattle in the classes exported to South-East Europe in 2015
Class Voyages (No.)
Cattle (No.)
Mortality rate overall (%)
Mortality rate range (%)
Steer adult* 4 37,584 0.51 0.23 – 0.80
Steer weaners 1 3,082 0.75 n/a
4.3 Goats
[image:37.595.95.524.188.436.2]4.3.1 Performance trend
Figures 21 and 22 (below) show the number of goats exported and the mortality rates during sea transport from all ports in Australia to all destinations over the last decade, as well as the trend line (linear regression) across those years. The number of goats exported annually has varied between approximately 200 and 26,000, and the annual mortality has varied between 0.00 and 0.79%. The trend for exports and annual mortality has continued downward.
Figure 21 Number of goats exported by sea from Australia to all destinations since 2006
0.0 0.2 0.4 0.6 0.8 1.0 1.2 1.4 1.6 1.8 2.0 2.2 2.4