45
Energy Audit of an Industry: A Case Study of Fabrication Company
Olatunde Ajani Oyelaran
1*, Yau Yusuf Twada
2, Olawale Monsur Sanusi
1 1Department of Mechanical Engineering, Federal University, Oye – Ekiti, Nigeria; 2Heavy Machinery andEquipment Development Institute, Bauchi, Nigeria. Corresponding author: [email protected]
Received : 25 December 2015 Accepted : 20 July 2016 Online : 16 August 2016
Abstract - Energy is one of the major inputs for the economic development of any country. In the case of the developing countries, the energy sector assumes a critical importance in view of the ever-increasing energy needs requiring huge investments to meet them. Energy audit will determine energy wastage and losses, and provide techniques and ways to minimize the losses. The payback period of the energy audit programmed for the industry was found to be 14 months. The energy consumption techniques suggested by the energy audit will not only minimize the losses but also reduce monthly electricity bill. The objective of Energy Management is to achieve and maintain optimum energy procurement and utilization, throughout the organization as to minimize energy costs and wastage without affecting production and quality. Energy Audit is the key to a systematic approach for decision-making in the area of energy management. It attempts to balance the total energy inputs with its use, and serves to identify all the energy streams in a facility.
Keywords: Energy management; Economic; Cost; Wastage; Payback period
Introduction
The advent of high crude oil prices resulted in a global energy crisis leading to huge cost in generating power, running of boilers and internal combustion engines, necessitating a need for energy management by industrial sector for efficient energy use, maximization of profit and enhanced competitive position (Saidur et al., 2007). The efficient use of energy is of prime importance in all sector of the economy. Energy cost is a significant factor in economic activity on par with factors of production like capital, land and labor (Morvay and Gvozdenac, 2008). Energy, in its different forms, is required as continuous input to all industrial processes. The total energy consumption of the industrial sectors of developed countries contributes to around 30–40 % of total energy demand (Morvay and Gvozdenac, 2008). All over the world, energy is the key input and basic need in industrial facilities for development, economic growth, automation and modernization in the industrial sector (Saidur et al., 2007, Hasnuzzaman et al., 2011). However, global energy demands are increasing rapidly and this concern is addressed by international researchers on how to fulfil the future energy demand. The energy consumption was projected to increase by 33% from 2010 to 2030 in the world (Abdelaziz et al., 2011). In the industrial sector, energy is consumed for a wide range of activities, such as processing and assembly, space conditioning, and lighting. In aggregate, the industrial sector uses more energy than any other end-use sector, consuming about one-half of the world’s total delivered energy (IEO, 2011).
Electricity accounts for about a third of primary energy used by industries, with natural gas, petroleum, and coal accounting for about 28, 26 and 7%, respectively (EIA, 1995). Energy is one of the largest controllable costs in most organizations (especially manufacturing and processing industries) and there is considerable scope for reducing energy consumption and hence cost (Jekayinfa, 2006). The benefits are also reflected directly in an organization’s profitability while also making a contribution to global environmental improvement in terms of energy conservation. The concept of energy auditing was born shortly after the oil energy crisis in the early 1970s. Since there were many inefficient uses of energy, an auditor had a relatively easy job identifying opportunities for saving energy. Over the years, facility management become more energy conscious and as a result, energy efficiency of industrial processes increased dramatically (Mitrovic and Muller, 2002).
Aceh International Journal of Science and Technology
ISSN: 2088-9860
46
Energy audit concept is a measure of the efficiency of energy utilization in a manufacturing process, thus leading to interest in energy performance of machines and plants directly associated with production process (Aiyedun and Ologunye, 2001). Shrivastava et al. (2013), defined energy audit as the verification, monitoring and analysis of energy use including submission of technical report containing this also recommendations for improving energy efficiency with cost analysis and an action plan to reduce consumption. While, Ojo (1995), sees energy audit as an attempts to balance the total energy inputs with its use and serves to identify all the energy streams in the systems and quantifies energy usages according to its discrete function. In general energy audit is the translation of conservation ideas into realities by lending technically feasible solutions with economics and other organizational considerations within a specified time frame (Umesh, 1998). Energy audit is the fundamental and most significant step for implementation of any effective energy management program. It tries to answer how, where and how much energy is used in a system. It also provides an opportunity to look into energy use pattern and recommends way and mean of eliminating losses and improving the efficiency of the system. The immediate advantages obtained through energy audit are improved maintainability, reliability features coupled with reduction losses. Long term energy saving can be through the use of energy efficient equipment.
There are two types of Audits preliminary audit and detailed energy audit. The preliminary audit alternatively called a simple audit, screening audit or walk-through audit, is the simplest and quickest type of audit. It involves minimal interviews with site operating personnel, a brief review of facility utility bills and other operating data, and a walk-through of the facility to become familiar with the building operation and identify glaring areas of energy waste or inefficiency. Typically, only major problem areas will be uncovered during this type of audit. Corrective measures are briefly described, and quick estimates of implementation cost, potential operating cost savings, and simple payback periods are provided. This level of detail, while not sufficient for reaching a final decision on implementing a proposed measure, is adequate to prioritize energy efficiency projects and determine the need for a more detailed audit. Detailed energy audit on the other hand is a comprehensive audit which provides a detailed energy project implementation since it evaluates all major energy using systems. It is an accurate method for Energy saving and Audit. In this audit three phases are involved, Pre Audit Phase, Audit Phase and Post Audit Phase. The objective of Energy Audit is to promote the idea of Energy Conservation in the company.
The purpose of the energy audit is to identify, quantify, describe and prioritize cost saving measures relating to energy use in the office, workshops and premises of the company. The work eligible for Energy Audit Study should be directed towards the following. Identifying the areas of energy wastage and estimation of energy saving potential in the company facilities. And suggesting cost-effective measures that will improve the efficiency of energy use, estimating the costs and payback period. Others includes documenting results and information generated through these activities and Identifying the possible usages of co-generation, renewable sources of energy (say Solar Energy, Biogas plant) and recommendations for implementation, wherever possible, with cost benefit analysis. The increasing role of energy efficiency as a catalyst for sustainable industrial development is realism in the industrialized countries of the world (Davidson, 2006). In Nigeria the story is different at the moment as the huge benefits derivable from adoption of energy efficiency and conservation measures by industries remain largely untapped due largely to lack of awareness of the economic and social benefits of energy efficiency measures. This, in addition to high incidence of power outages resulting to large scale use of own power generation and lack of investment capital have given rise to high specific energy content of goods produced by industries in Nigeria. The cumulative effect is loss of competitive edge in the global market by these industries and low after- tax returns. This constitutes a major disincentive to investment and sustainable industrial growth. As a matter of utmost importance, industries in Nigeria should take advantage of opportunities in low level, low risk but high worth energy efficient measures that reduces the bottom line of any business enterprise. In so doing, a lead time will be created to pursue high-tech driven production processes that will find support at maturity in an already established energy efficient culture. The whole purpose of energy efficiency is to minimize the amount of energy used to get a desired effect.
47
selected industries and (iii) to develop appropriate strategies for effective energy savings in the industries surveyed.
Materials and Methods
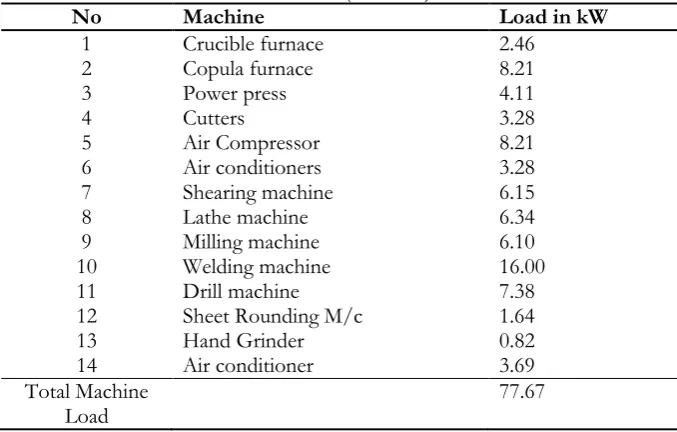
The energy audit was conducted at Hommec Technology Company, Suleja, Niger state of Nigeria. The company is a metal fabrication and casting company. The total area of industry is 150 square meter and total staff strength 27. It has many types of equipment and heavy machinery like Copula furnace, crucible furnace, Shearing, lathe, milling machines, Power press, Welding sets, Cutters, Air compressor, Air Conditioners, Drill machines, Sheet rounding machine, Hand Grinder as shown in Table 1.
The Company’s primary source of power supply is the Abuja Electricity Company and 2 giant generating sets as back-up. Portable test equipment like the flow meter, infrared thermocouple, digital tachometer, power analyzer, measuring tape, lux meter manometer and multimeter were used in determining flow rates, temperature and electrical readings. The following data were collected electricity consumed per month for a year, Floor area of the factory and Power rating of all machines and equipment powered by electricity. All data were presented in tabular and graphical forms as seen in Tables 1-5 and Figure 1. The energy audit was conducted within a period of two months.
Data collection
In preliminary data collection phase, exhaustive data collection was made using different methods such as observation, interviewing key persons, and measurements. The following steps were taken for data collection: A visit to each of the workshops, laboratories, offices and other entities of the institution. Information about the general electrical appliances was collected by observation and interviewing. The Site drawing of available building lay-out and Electricity distribution were collected. Electricity bill was collected from the personnel in-charge. The power consumption of appliances was measured using power analyzer in some cases (such as fans) while in other cases, rated power was used (CFL for example). Information was also collected on redundant / non-operational energy systems. The details of usage of the appliances were collected by interviewing key persons e.g. Electrician, caretaker (in case of departments) etc. and approximations and generalizations were done at places with lack of information.
Data analysis
Detailed analysis of data collected was done. Energy consumption per month in kWh is calculated. The analysis of data is done in following way: Power Flow diagram, evaluation of collected data and analysis, reasons for the Variance between connected load and actual consumption was evaluated. Furthermore, the database prepared was further studied and the results presented graphically, this helped to identify the areas with maximum energy saving potential.
Recommendation
On the basis of results of data analysis and observations, some steps for reducing power consumption were taken. The recommended measures will not affect the present working conditions and at the same time substantial energy savings will arise. The following were the steps involved in this process. The capital cost involved in replacing an appliance and/or process was estimated, the energy saving by the move was calculated in terms of price of energy per year. These two costs were compared to calculate the capital cost recovery time which is defined as the total time by which the saving in energy bill balances the capital cost involved. Finally if capital cost recovery time is less than the product life, the move can be supported.
Result and Discussion
Energy consumption and electricity bills
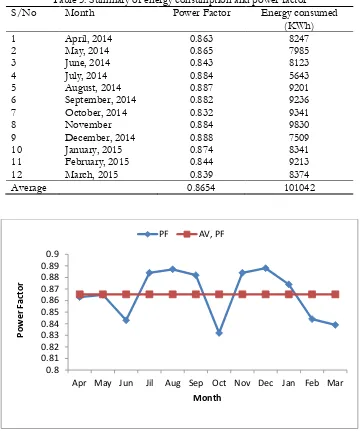
The company power supply is coming to the plant with the help of 11 kV feeders. The monthly electricity bill for last one year showing kWh consumption and Power factor (P.F) are tabulated in Table 5. From the table it is observed that the energy consumed varies from a maximum value of 9,830 kwh in the month of November, 2014 to a minimum value of 5,643 kwh in the month of July, 2014 (ABEDCO, 2014
48
Table 1. Machinery and equipment in the industry
No Name of machine/
Table 2. Lighting load calculation of workshops and offices
49
Factory energy consumption of factory
The total load of factory = Lighting load+ Machine load = 4.475 + 77.67
= 82.145 KW
Observations made for pre-audit phase 1
All ceiling fan are connected without fan regulator, T.L are switched on when not needed. All tube lights connected with traditional chocks and CRT monitor are used. A.C ventilation should be chocked due to painting of transformer tanks. Furthermore, M.S sheets and scraps are not properly discarded so there may be a danger of accident and it was observed that there is lot of smoke inside welding and foundry shops. Finally It has been observed that the operators fail to turn of the equipment when not in use.
Suggestion and ECOS for pre-audit phase-I
The following suggestions were made all ceiling fans should be controlled by electronic fan regulators, Installation of automatic night light circuit along with a common off at dark circuit. Furthermore all tube lights chocks should be replaced with ballast chocks. The replacement CRT monitor with LCD can be saved power, the power consumed by LCD monitors is approximately half when compared to CRT (Babu et al., 2013). It was also suggested that A.C ventilation should be regularly cleaned, the scrap of M.S sheets should be collected time to time and store in a proper place they may be use for make another material like Washers etc. Also the scrap of M.S sheets sold to earn money. The welding and foundry shops needs exhaust fans to remove smoke. It was also suggested to create awareness among the workers about the important of Energy Conservation
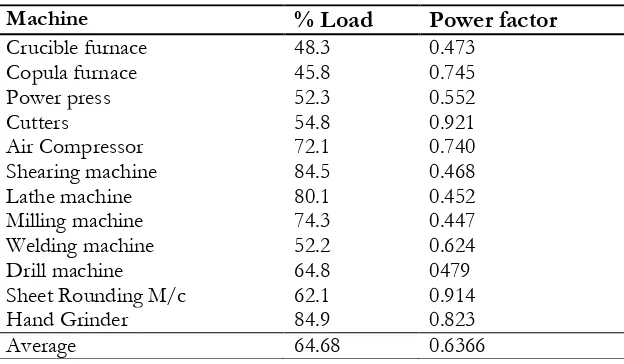
Table 4 shows the Performance of different machines and appliances from the table it can be seen that all the machines were being operated at low load (average 62.18%). It implies that the motors used in these machines are higher rating or oversized (Yaacob and Mohd, 1993). It also shows that all machines operated at average power factor of 0.674 lag. Traditional welding sets draw high current and operate at 0.624 lagging power factor this causes low power factor. This is one of the reasons for the low power factor of the whole industry. The power factor of an AC electrical power system is defined as the ratio of the real power flowing to the load, to the apparent power in the circuit. Real power is the capacity of the circuit for performing work in a particular time. Apparent power is the product of the voltage and current of the circuit. In an electric power system, a load with a low power factor draws more current than a load with a high power factor for the same amount of useful power transferred.
Table 4. Performance of electrical appliances and machines
Machine
% Load
Power factor
Crucible furnace 48.3 0.473
Copula furnace 45.8 0.745
Power press 52.3 0.552
Cutters 54.8 0.921
Air Compressor 72.1 0.740
Shearing machine Lathe machine Milling machine
84.5 80.1 74.3
0.468 0.452 0.447
Welding machine 52.2 0.624
Drill machine 64.8 0479
Sheet Rounding M/c 62.1 0.914
Hand Grinder 84.9 0.823
50
Table 5. Summary of energy consumption and power factor
S/No Month Power Factor Energy consumed
A closer look on Table 5 shows that to achieved and maintained a high power factor all over sized motors must be replaced by energy efficient motors. Furthermore oo improve power factor additional capacitor bank should be connected across the load
Audit Phase-III
The management was advice to replace old oversized motors or traditional welding sets in five phases, also t additional capacitor bank should be install in the factory. On lighting, the advantage of sunlight should be made by leaving lights off during the day. Use compact fluorescent light bulbs in place of conventional incandescent light bulbs. CFL uses approximately one- fourth the wattage of an incandescent bulb producing a similar level of illumination, and they last 8,000 to 10,000 hours (Ajay et al., 2014). On refrigerators, the refrigerators should be kept away from the wall by about half feet. Refrigerators throw out heat and this heat needs to escape. If we do not let the heat go away, its efficiency reduces (Ajay et al., 2014). Automatic night light appliances should be installed. Energy Conservation by using power factor controller,
0.8
Apr May Jun Jil Aug Sep Oct Nov Dec Jan Feb Mar
51
Low power factor will lead to increased current and hence increase losses and will affect the voltage. We can use Power Factor Controller or Automatic Power.
In energy Conservation in lighting system, good lighting is required to improve the quality of work,
to reduce human’s / worker’s fatigue, to reduce accidents, to protect his eyes and nervous system.
Deshmuskh and Patil (2001) wrote that in industry it improves production, and quality of products / work. Optimum use of natural light, whenever the orientation of a building permits, day lighting has to be used in combination with electric lighting. The maxim use of sunlight can be get by means of transparent roof sheets, north light roof, etc. Replacing incandescent lamps by Compact Fluorescent Lamps (CFL's): CFL's are highly suitable for places such as Living rooms, Hotel lounges, Bars, Restaurants, Pathways, Building entrances, Corridors, etc. Replacing conventional fluorescent lamp by energy efficient fluorescent lamp, Energy efficient lamps are based on the highly sophisticated technology. They offer excellent color rendering properties in addition to the very high luminous efficacy (Ramya and Femina, 2014). Replacement of conventional ballast by Electronic ballast: Installation of high frequency (28 - 32 Mhz) electronic ballast in place of conventional ballasts helps to reduce power consumption up to 35%. While the installation of separate transformer for lighting is advised, this is because, the net lighting load varies between 2 to 10%, if power load and lighting load are fed by same transformer, switching operation and load variation causes voltage fluctuations. This also affects the performance of neighboring power load apparatus; lighting load
equipment’s and also reduces lamps. Hence, the lighting equipment has to be isolated from the power
feeders. This will reduce the voltage related problems, which in turn provides a better voltage regulation for the lighting this also increases the efficiency of the lighting system. Installation of servo stabilizer for lighting feeder is used wherever, installation of separate transformer for lighting is not economically attractive an installation of servo stabilizer is recommended.
Calculation of payback period for implementation of ECO
The annual energy savings due to replacement of ballast
=[ T × W × hr × × N/ wh ] = N29, 893.5
And the annual energy savings due to Automatic night light and off at dark light circuit =[8 TL × 40 W × 8 hr1000 ×365 × 13N/Kwh] = N12, 147.2
Where,TL = tube lights, W = wattage of each traditional chocks, hr = numbers of hours in a day d = total numbers of days in a year, N/kwh = rate of each unit
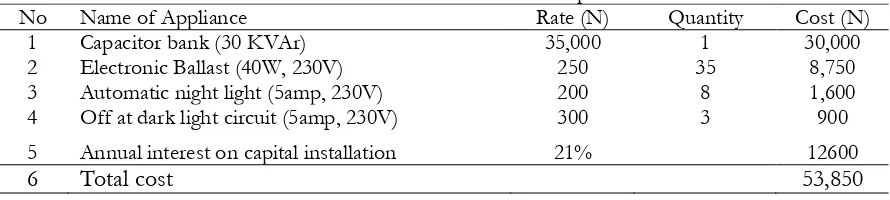
While, the proceed from selling of old traditional chocks 35@100 = 3500 Total investment = Total cost – Proceed from selling of old chocks = N (53,850 – 3,500)
= N50. 350 Net savings = i + ii
= N (29, 893.50 + 12, 147.20) = 42, 040.70
Payback period = � � � �� ��� �
= , , . = 1.198 years Payback period in months = 1.198 × 12 = 14.376 months
= 14.4 months
Table 6. The total investment on hardware purchased
No Name of Appliance Rate (N) Quantity Cost (N)
1 Capacitor bank (30 KVAr) 35,000 1 30,000
2 Electronic Ballast (40W, 230V) 250 35 8,750
3 Automatic night light (5amp, 230V) 200 8 1,600
4 Off at dark light circuit (5amp, 230V) 300 3 900
5 Annual interest on capital installation 21% 12600
52
Conclusions
This work examined the energy consumption of metal fabrication industries in Suleja,
Nigeria. The sources of electrical energy wastage were identified and assessed the effectiveness of
the strategies for electrical energy savings in the industries.
Thework shows that replacing the
conventional tube lights with energy saving CFLs reduces the energy consumption drastically. In addition to this the CO2 emission is also reduced when the tube lights are replaced. Based on the energy audit carried out the following conclusions were arrived at, installation of electric meters in each workshop and administrative units to monitor and curtail power wastages in each unit thereby reducing energy consumption and procurement of test equipment for energy monitoring in the factory. Furthermore, good maintenance and control must be put in place in order to improve the energy efficiency. Significant capital investment should be made in replacement of inefficient energy consuming equipment to reduce the energy
consumption for example
motivation for energy conservation among workers and provision ofSensors to detect natural lighting and switch on artificial light. The implementation of energy saving measures suggested in this work shows that the payback period of the energy audit programmed for the industry will be 14 months. Energy audit in all the sectors with few changes in the existing system can conserve energy. The implementation of energy saving measures suggested in this paper is solely dependent upon the decision of the management of the factory. Several ECO’s that are cost effective are not often implemented due to lack of internal funding.
Acknowledgement
Our acknowledgement goes to the Management and Staff of Hommec Technology, Suleja - Nigeria for the opportunity given to us to conduct the energy survey research work of their Industry.
References
Abdelaziz, E..A., Saidur, R. and Mekhilef, S. 2011. A review on energy saving strategies in industrial sector. Renewable and Sustainable Energy Reviews, 15(1): 150-68.
Aiyedun, P. O. and Ologunye, O. B. 2001. Energy efficiency a private sector with Cadbury Nigeria Plc., Ikeja, Lagosas a case study. Nigeria Society of Engineers Technical Transaction, 36(2): 59-63.
Ajay, K., Sudhakar, G., Sasank, K. and Guru-Krishna, T. 2014. A case study on energy conservation and audit for household applications. International Journal of Advanced Research in Electrical, Electronics and Instrumentation Engineering, 3(4): 8410 – 8416.
Babu, M., Balachandra, T. C., Dsouza, O. and Naik, B. 2013. Energy audit, conservation and power factor improvement for BMSIT campus. International Journal of Research in Engineering and Technology, 2(11): 354 – 359. Davidson, O. 2006. Energy for sustainable development: an introduction. In: Winkler, H (Ed.), Energy Policies for
Sustainable Development in South Africa, Option for the Future. Energy Research Centre, Cape Town, South Africa.
Deshmukh, S. C., and Patil, V. S. 2013. Energy conservation and audit. International Journal of Scientific and Research Publications, 3(8): 1-5
Eastop, T.D. and Croft, D.R. 1990. Energy efficiency. Addison Wesley Longman Limited, England.
Energy Information Administration (EIA). 1995. Annual energy review 1994 U.S. Department of Energy, Energy Information Administration, Washington, DC.
Hasanuzzaman, M., Saidur, R. and Masjuki, H.H. 2011. Effects of different variables on moisture transfer of household refrigerator-freezer. Energy Education Science and Technology Part A-Energy Science and Research 27(2):401-418.
International Energy Outlook (IEO). 2011. U.S energy information administration. Washington, DC.
Jekayinfa, S.O. 2006. Energy consumption pattern of selected mechanized farms in southwestern nigeria. Agricultural engineering international. The CIGR E-Journal, 8: 1-11.
Mitrovic, B. and Muller, M.R. 2002. Energy impacts of productivity improvements in manufacturing. Proceedings of the Twenty-fourth National Industrial Energy Technology Conference, Houston, TX, April 16-19, 2002. Morvay, Z.K. and Gvozdenac, D.D. 2008. Applied industrial energy and environmental management. John Wiley and
Sons Ltd, United Kingdom.
Ojo, C.O. 1995. Energy audit of a refinery - case study of Port-Harcourt Refining Company. Master Thesis, University of Benin, Benin City, Nigeria.
Payne, G.A. 1997. The energy manager’s handbook. IPC Science and Technology Press Ltd, UK.
53
Rathod, D., Khandare, R. and Pandey, A.K. 2013. Electrical energy audit (a case study of Tobbaco Industry). International Journal of Engineering and Applied Sciences, 2(3): 9-18
Saidur, R., Hasanuzzaman, M., Sattar, M.A., Masjuki, H.H., Irfan A.M and Mohiuddin, A.K.M. 2007. An analysis of energy use, energy intensity and emissions at the industrial sector of Malaysia. International Journal of Mechanical Materials Engineering, 2(1): 84-92.
Shrivastava, S., Kumar, S. and Khare, J.M. 2013. Improving industrial efficiency by energy audit. International Journal of Scientific Engineering and Technology, 2(4): 291-294.
Umesh, R. 1998. A reference book energy management. S.K. Kataria and Sons, Prakash Mahal, India