www.elsevier.com / locate / bres
Research report
Acetylcholine release in the hippocampus of the urethane anaesthetised
rat positively correlates with both peak theta frequency and relative
power in the theta band
a ,1 a ,1 b c a , ,1
*
M.S. Keita
, L. Frankel-Kohn
, N. Bertrand , L. Lecanu , P. Monmaur
a
´ ´ `
Laboratoire de Neurosciences Comportementales, Universite Paris V-Rene Descartes, 45 rue des Saints Peres, H468, 75270 Paris Cedex 06, France
b
´
Laboratoire de Pharmacodynamie, Universite de Bourgogne, 7 bd J. d’Arc, 21033 Dijon, France
c
´ ´ ´
Laboratoire de Pharmacologie, Groupe Circulation Cerebrale, Universite Paris V, 4 rue de l’Observatoire 75006 Paris, France Accepted 19 September 2000
Abstract
The need to achieve a clearer understanding of relations between hippocampal theta characteristics and cholinergic septohippocampal neuron activity, prompted us to re-examine, in the urethane-anaesthetised rat, the statistical relationships between the electrophysiological and neurochemical variables using a procedure which is believed to enhance significantly the degree of confidence with which parameters of theta recorded with classic macroelectrodes can be related to concomitant acetylcholine output measured by high-performance liquid chromatography with electrochemical detection. Firstly, the theta rhythm and the acetylcholine content were derived from the same hippocampus. Secondly, the hippocampal electroencephalogram was quantified using spectral analysis which permits the more objective quantitative evaluation of selected electroencephalogram samples. Thirdly, a larger number of rats than in our previous study was used here, thus enhancing the validity of statistical results. This procedure yielded, in our time-course determination, two main findings. The first finding is that acetylcholine release was positively correlated with frequency at the peak power of the theta band which reflects the frequency of the theta signal. This finding had not been reported yet. The second finding is that hippocampal acetylcholine outflow also covaried with relative power of the theta band which reflects the amplitude of the theta signal. This finding is consistent with our previous study in which EEG was quantified by means of a traditional method. These findings suggest that the cholinergic component of the septohippocampal system, which is the main source of hippocampal acetylcholine, and neurophysiological mechanisms involved in the modulation of both the amplitude and the frequency of theta are functionally related. The possibility that, at least in the urethane-anaesthetised rat, hippocampal acetylcholine is involved in these modulator mechanisms is discussed. 2000 Elsevier Science B.V. All rights reserved.
Theme: Neurotransmitters, modulators, transporters, and receptors
Topic: Acetylcholine
Keywords: Microdialysis; Spectral analysis; Theta rhythm; Septohippocampal system; Septum
1. Introduction activity of neural components of the hippocampus, this rhythm has been used to build various theories relative to The theta (u) rhythm which can be recorded from the hippocampal functions (see references in Refs. [21,42]). hippocampus occurs within the 3–12 Hz frequency band Acetylcholine (ACh) is considered to play an important [54] in the brain of most mammalian species [6,7]. Since it role in the control of hippocampal u. Several pharmaco-is generally believed that u is a reliable index of the logical studies have shown that procholinergic drugs cause hippocampal synchronisation in both anaesthetised and freely moving animals, an electroencephalogram (EEG) *Corresponding author. Tel. / fax:133-1-4286-3364.
effect which was blocked by antimuscarinic agents such as
E-mail address: [email protected] (P. Monmaur).
1 atropine [25,54,56]. The latter also abolishes u which
Permanent address: Laboratoire de Psychopharmacologie et Processus ´
Cognitifs, Universite Paris VII, 2 place Jussieu, 75005 Paris, France. occurs spontaneously or after peripheral or central applica-0006-8993 / 00 / $ – see front matter 2000 Elsevier Science B.V. All rights reserved.
tion of stimuli to animals anaesthetised with ether or septal source [47] and, consequently, would occur at the urethane [25,26,36]. In addition, atropine treatment sup- same frequency and the same amplitude modulation pressesuoscillations seen with alert immobility and alters, throughout the hippocampus. In fact, it could be argued without suppressing, those that accompany voluntary that attempts to correlate electrophysiological parameters motor behaviour in the freely moving animal [25,54,56]. and ACh output may be problematic under certain ex-Many data support the view that the medial septum, the perimental conditions of this acute study. For example, hippocampus and the reciprocal connections between these damage to hippocampal tissues due to electrode lowering structures form a crucial network for u generation. For and probe insertion are not equivalent for the left and right example, lesions of the medial septum or transection of hippocampus. Moreover, neostigmine, an anticholinester-both the fimbria and the fornix permanently abolish ase agent added to the perfusate [38] and capable of hippocampal u [3,35,49,47]. Moreover, reversible func- influencing hippocampal EEG [44,51,54,56,57], likely tional blockade of the medial septum by local infusion of diffused to the adjacent layers in the right but not left anesthetic results in transient abolition of this rhythm hippocampus. It is possible, therefore, that the physiologi-[7,22,19,58]. Conversely, electrical or chemical activation cal activity of the left hippocampus and that of the right of the medial septum elicits u [24,26,32,36,37,39]. His- one, although probably similar, were not identical in this tological, histochemical and ACh release studies have previous study and that this factor, at least in part, shown that the medial septum, which projects cholinergic interfered with attempts to correlate changes in urhythm fibres to all hippocampal subfields, is the main source of and changes in ACh outflow derived, respectively, from hippocampal cholinergic innervation [2,27,29,33] and ACh separate hippocampi. It is important to clarify this point outflow in the hippocampi [15,16,40]. Specifically, hip- (1) to obtain clearer understanding of the neurochemical pocampal ACh release is increased by stimulation of the mechanisms underlying u, and (2) to interpret more medial septum [15,16] and strongly reduced following correctly both previous and future investigations using fimbria / fornix pathway transection [40]. Taken together, EEG and / or dialysis methods, particularly since, for the above data suggest that cholinergic components of the technical reasons, ‘hippocampal EEG’ is classically de-septohippocampal system are of importance for hippocam- rived from the dorsal part of the hippocampus and ‘hip-pal synchronisation. This suggestion is strongly supported pocampal ACh’ is often collected from the ventral part of by a study of Lee et al. [27]. These authors have shown this structure.
that, in both the drugged and normal rat, complete and One way to test and clarify this point is to repeat the selective destruction of cholinergic septal cells, by means EEG / microdialysis experiment and calculate the statistical of immunotoxin 192 IgC-saporin, dramatically reduced the relationships between characteristics of spontaneously amplitude of hippocampal u, in addition to clearing occurring u in one hippocampus and concomitant ACh acetylcholinesterase-positive fibres in the hippocampus. output derived from the same hippocampal structure. The These findings suggest thatuamplitude is almost entirely strategy of the present paper, therefore, was to record dependent on the anatomophysiological integrity of the hippocampal EEG from the dorsal part of the hippocampus cholinergic component of the septohippocampal system. and concomitantly record ACh output from the ventral part This is consistent with the suggestion of authors made on of the same hippocampus of the rat. Moreover, ACh output the basis of a procaine mapping study [19,22] and also was assessed by means of a steadier electrochemical tallies with our recent investigation using an approach detector than previously [38], and EEG was quantified combining hippocampal microdialysis with hippocampalu using spectral analysis, which permits the more objective recording in the urethane-anaesthetised rat [38]. Keeping quantification of selected EEG samples. Finally, more rats in mind that continuous dialysis measurement of extracel- were used here than in our previous study. This strategy lular ACh content of the hippocampus is the only method and procedure were believed to enhance significantly the capable of directly evaluating the dynamic activity of the degree of confidence with which u parameters can be septohippocampal population of neurons which synthesise related to concomitant ACh output. However, to obtain a this neurotransmitter [40] we have demonstrated that clearer understanding of relations between hippocampalu
that in our recent microdialysis study bothuand ACh were not met, the rats were excluded from the study. Histologi-concomitantly and spontaneously detected in the rat given cal results deriving from our prior experiments conducted an anaesthetic dose of urethane which blocked locomotor on a very large number of rats, and using this hippocampal activity [38]. Moreover, intraperitoneal administration of EEG recording technique, have shown that in all rats atropine in this preparation resulted in a strong increase in tested, short electrode tips were located in the corpus ACh release in the ventral hippocampus [P. Monmaur, callosum or in the overlying deep neocortex, and long unpublished data], likely via action of the anticholinergic electrode tips were located near the hippocampal fissure of agent on presynaptic M2 muscarinic subtype receptors the dorsal hippocampal formation [36–38].
[41,45,46]. These observations suggest that under urethane Home-made parallel (I-shaped) probes of an acrylonit-anaesthesia, septohippocampal cholinergic neurons of the rile sodium methylsulfonate dialysis copolymer membrane rat have a spontaneous activity. Taken together, the above (molecular weight cut-off of 45,000, 0.24 mm internal considerations prompted us to use again, for the present diameter, 0.29 mm outer diameter, AN 69, Filtral, Hospal study, the rat immobilised by an anaesthetic dose of SA, Lyon, France) were used in this study. The exposed urethane (ethyl carbamate, Sigma), an experimental model tips of the dialysis membrane were 4 mm. The probe was which can substantially facilitate the identification of implanted in the ventral hippocampus, ipsilateral to EEG potential causal relationships between u activity and electrodes. The co-ordinates for microdialysis probes were: concomitant ACh metabolism in the brain. Here we anterior 2.5 mm, lateral 4.7 mm from the lambda-skull significantly extend our previous hippocampal EEG / mi- surface and ventral 6.9 mm from the meninges surface. crodialysis data. Following probe implantation, ether, which was essentially used for the surgical steps including electrode and probe lowering into the brain, was then kept out and urethane,
2. Materials and methods which ensures more stable and longer-lasting light anaes-thesia with theta than ether, was administered (0.33 g / kg)
2.1. Animals via the abdominal cannula until the u occurred
sponta-neously or was easily elicited by gentle tail pinch. At this Experiments were performed on male Wistar rats (Jan- stage of the experiment, the rat was lightly anaesthetised. vier, France) weighing 280–320 g. They were housed one If clear-cut vibrissae movements were detected during the per cage under 12 h light / 12 h dark conditions and subsequent minutes of the experiment, an additional in-25628C. They had free access to food and water. jection of urethane was given at the dose of 0.1 g / kg. Urethane was prepared by dissolving 2.5 g of the drug in 5
2.2. Surgery ml of saline. Body temperature was maintained at
36.860.58C. Myographic activity and heart rate were The general surgical and recording techniques were continuously monitored by means of electrodes implanted similar to those previously described [44]. Under deep in the forepaws of the animals.
volatile ether (diethyl ether, Prolabo) anaesthesia, a
trach-eotomy was performed to facilitate breathing and a cannula 2.3. Microdialysis and ACh assay (hypodermic needle) was inserted into the peritoneal cavity
for subsequent administration of urethane solution. The rat Immediately after probe insertion in the ventral hip-was then mounted in a stereotaxic apparatus and both pocampus, the inlet cannula was connected to a microinfu-superficial and deep us of the right dorsal hippocampus sion syringe pump (CMA / 100) and the probe was continu-were reached under light ether anaesthesia by continuously ously perfused with normal saline 0.9%, pH 7.0 at a rate of recording EEG by means of home-made monopolar elec- 2 ml / min. A reversible cholinesterase inhibitor
(neostig-25
treatments. These treatments are outside the scope of the hippocampal electrode which usually produced well-de-present investigation and pharmacological data are there- veloped uin contrast to the short one, and the phase and fore not presented in this paper. the coherence spectra which were calculated for the ACh was assayed by high performance liquid chroma- electrode pair. The frequency corresponding to peak power tography (HPLC) with electrochemical detection produced by the long electrode was chosen as a reference (Coulochem II ESA). Sample volumes of the perfusate for phase and coherence calculations. The peak power was were injected by means of a microsyringe in a 20-ml loop defined as the largest power value between 0.25 Hz and of a manually controlled injection valve (Rheodyne 7725i). 49.50 Hz. When peak power was in theuband (3–12 Hz) This volume was less than the theoretical 30 ml normally it was named peakupower. The absolute power (sum of collected and was chosen to make sure that equivalent spectral values within a limited frequency band) and the volumes of available sample were submitted to the HPLC relative power (1003absolute power / total power (sum of analysis. The ACh and choline were separated on a CC spectral values between 0.25 Hz and 49.50 Hz)) were 12532 mm, 4 mm Superspher column (Macherey-Nagel). calculated for 0.25–2.75 Hz (dband), 3–12 Hz (uband), A CC 833 mm, 4mm Superspher precolumn (Macherey- 12.25–25 Hz (bband) and 25.25–49.50 Hz (gband). The Nagel) was always fitted to the column. A home-made relative peak power (1003peak power / total power) was enzyme postcolumn reactor containing silanised glass also calculated. Due to marked interindividual differences, beads with covalently bonded acetylcholinesterase and absolute power appears to be less reliable than relative choline oxidase [5] was used to convert ACh to hydrogen power in comparing power spectra recorded during the peroxide which was detected by a platinum electrode at experiment. Therefore, relative powers were always calcu-300 mV. The temperature of the pre-column, column and lated and used, in addition to absolute powers, for sub-the post-column was maintained at 258C in a column sequent statistical calculations. One spectral average was thermostat controller 482 (Kontron Instruments). The made for each 5-min interval for the 30 min of the ACh mobile phase (pH 6.6) delivered by a dual piston pump collection period. Within each 5-min interval, attempts (Kontron) at 0.350 ml / min was 50 mM potassium were made to carry out spectral averaging, preferentially dihydrogen phosphate (KH PO ) (Sigma), 5.5 mM tetra-2 4 during u waves or electrophysiological field oscillations methylammonium chloride (Aldrich), 1.2 mM 1-heptane- resembling u, as identified by visual inspection. The sulfonic acid (Sigma), 50 ml / l MBA (Eurosep). The spectral measurements were then assembled in two inter-perfusate ACh concentration was quantified with an vals of 15 min corresponding to two ACh collection MT450 integrator (Kontron) using external ACh standards. intervals of 15 min each. Thus, each interval included three ACh release (i.e. efflux of dialysable transmitter) was consecutive spectral values which were averaged. Clearly, expressed as fmol of ACh per 20ml dialysate sample. The within each 15-min interval, there was one average spectral main parameters used for amperometric measures of ACh value and one value for ACh release. These values were were filter510 s, gain50.5 nA / V, upper and lower current used for statistical analysis (see below).
limits in which measurements were carried out520 and 10 The proportion of time (s) that u was present in the nA, respectively. The detection limit, defined as the record (u duration) was scored from an at least 1-s amount of standard ACh producing a peak consistently uninterrupted train ofuwith a ruler at 15-min intervals for emerging from the basal noise, was 50 fmol per injection the 30 min of the ACh collection period. Here again, of 20 ml and the accuracy of measurements (probe within each 15-min interval, there was one u duration efficiency) of 100 fmol was 23%. value and one value for ACh release. Measurements were made for only the long hippocampal electrode which 2.4. EEG recording and analysis produced well-developed u in contrast to the short one. Only trains of clear-cutuoscillations, i.e. almost sinusoid-The EEG from hippocampal electrodes was recorded shaped waves, were considered.
monopolarly by a physiopolygraph (Alvar). The recording
was made continuously throughout the experiment. Hip- 2.5. Probe placement control pocampal EEG was digitised on-line at 128 Hz by a signal
processor (Tektronix 2630 Fourier Analyser) installed on a Upon completion of the experiments, methyl blue computer (Elonex 486) (spectral measurements). Spectral solution was perfused in the hippocampus at the rate of 2 averages were computed using the fast-Fourier transform ml / min for 15 min. The rat was then killed and the brain (FFT) on five 4-s segments of 512 points overlapped by removed. Resulting slices of fresh brain tissue were 50%. This procedure resulted in one spectral value per checked under a binocular microscope for dialysis probe 0.25 Hz (frequency resolution) over the range from 0 to 50 placements.
Hz. Data under 0.25 Hz and above 49.50 Hz were omitted
from the analysis in order to avoid any possible signal 2.6. Statistics artefact. Three kinds of spectra were routinely considered:
ACh levels varied markedly between rats (see Section 3). Therefore, statistical relations between ACh release andu
spectral parameters were determined by means of the exacting two-tailed Spearman rank-order correlation coeffi-cientr. The Wilcoxon sign test was also used to compare values of measurements made between 0 and 15 min and those of measurements made during the subsequent 15–30 min of the collection period (effect of time). A P value
#0.05 was accepted as evidence of a statistically signifi-cant effect. As spectral values were calculated on the basis of averages as mentioned above, present data were pre-sented as means and standard error of the mean (6S.E.M.).
3. Results
The data presented were derived from 19 rats.
3.1. Histology
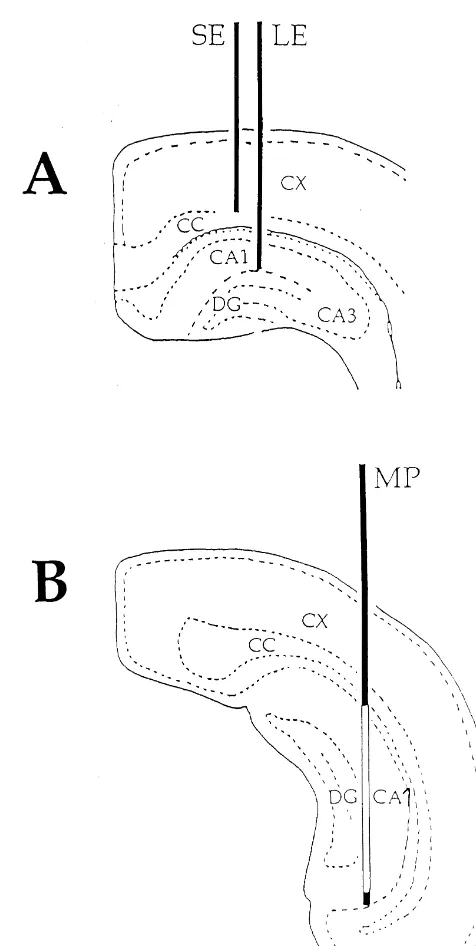
Fig. 1 shows the diagrammatic representation of the expected positions of the recording electrodes in the dorsal hippocampus and the typical placement of dialysis probes in the ipsilateral ventral hippocampus of the rat. In general, the exposed dialysis membrane (unshaded area) was in contact with most strata of the CA1-dentate regions due to the slight inclination of the ventral hippocampus at the chosen co-ordinates for probe insertion. As in our previous work [38], it was unclear whether or not the probes were in contact with the CA3 layers. Moreover, in two rats, the probe was in an area overlapping CA1 and the lateral adjacent corpus callosum / deep cortex regions. In two other rats, about 50% of the full length of the exposed membrane was inserted in the CA1 area; the remaining 50% was in the extrahippocampal overlying neural tissues. No clear relationship between probe placement and ACh release emerged from our histological examination.
Fig. 1. Schematic drawing (according to the atlas of Albe-Fessard) of the 3.2. ACh release expected position of the recording electrodes in the dorsal hippocampus (A) and the typical placement of the microdialysis probe with the 4 mm Basal ACh outputs were detectable in all animals and in membrane exposed (unshaded area) in the ipsilateral ventral hippocampus (B). Probe shaded areas indicate portions of the probe that were covered all collection intervals. ACh levels were quite variable
with glue (epoxy resin). LE, long electrode; SE, short electrode; MP, from rat to rat (range: 65.52 to 1768.22 fmol) but were
microdialysis probe; cc, corpus callosum; cx, cortex; CA1, Ammon’s relatively stable in the same animal over time. Mean values horn subfield 1; CA3, Ammon’s horn subfield 3; DG, dentate gyrus. and the standard error of the means of basal ACh output
were 419.876110.53 fmol (n519) and 401.816102.97
fmol (n519) for 0–15 min and 15–30 min of the 3.3. Electrophysiology and spectral analysis collection period, respectively. The mean output of ACh
in-creased and reached an asymptote by 60 to 120 min which 15-min interval and serving for correlation calculation, was, however, lower than the pre-probe amplitude level. were placed within the u band. This is summarized in Preliminary experiments indicated that small two-direc- Table 2: the mean values6S.E.M. of the frequency at peak tional electrode moving in the vertical plane across the power were: 3.4960.15 Hz (n519) and 3.6460.17 Hz hippocampal layers, at the end of the observation period, (n519) for the 0–15 min and 15–30 min intervals of the generally failed to improve significantly EEG (including u recording period, respectively. The mean6S.E.M. calcu-waves) amplitude, thus reducing the possibility that incom- lated over the 0–30 min of the recording period was plete recovery of signal amplitude was only due to shifting 3.5760.11 Hz (n538).
of hippocampal tissues relative to electrode tips as a Clear-cut theta rhythm and desynchronised electrophy-possible consequence of probe implantation. About 30 min siological activities coexisted during each 15-min interval following probe placement, rhythmicity was generally of the collection period. The means of u duration for the detectable on traces and 30 to 60 min later trains of u 0–15 min and 15–30 min intervals were 118.62617.82 s waves alternated with generally longer trains of de- (n517) and 116.83621.10 s (n517), respectively (mean synchronised activity although individual variations be- over the 0–30 min of the collection period: 117.72615.60 tween animals were observed. These EEG patterns formed s, n534), which are consistent with our previous mi-the background activity of mi-the dorsal hippocampus of most crodialysis study [38].
rats during the 30-min collection period. Visual scrutiny of From the data of the paragraph before and Tables 1 and the records indicated that 17 of 19 rats exhibited urhythm 2 which present the mean6S.E.M. of spectral parameters whereas clear-cut uwaves appeared to be absent from the derived from the spectra collected during the experiment, it record of the two remaining rats. However, spectral can be seen that, in general, both uduration and spectral analysis revealed that peak u powers were present in all values collected during 0 to 15 min were comparable to rats, thus indicating that u waves were, in fact, present those collected during 15 to 30 min of the recording although not clearly identifiable by visual inspection, in the period. A one-tailed Wilcoxon sign test applied to these records of all animals. Detailed spectrum by spectrum parameters revealed no statistically significant (Ps.0.1) analysis of all spectra carried out during the experiment difference (because of their large number, detailed statisti-indicated that 102 of 114 (89.5%) spectra had peak power cal data are not presented here) between members of pairs, (range: 3 to 6 Hz) within theuband (peakupower) and 12 indicating thatuduration and EEG spectral characteristics of 114 (10.5%) (approximately equally divided between were, as seen for ACh release, essentially stable over the the 0–15 min and 15–30 min intervals of the collection collection period, in accordance with our previous mi-period) had peak power (range: 0.75 to 2.75 Hz) within the crodialysis study [38].
delta band (peak delta power), thus suggesting that
essen-tially u oscillations were included in most spectra. As a 3.4. Correlations probable consequence, all the peak power values resulting
from averaged consecutive spectral values within each The values of the two-tailed Spearman rank-order
Table 1
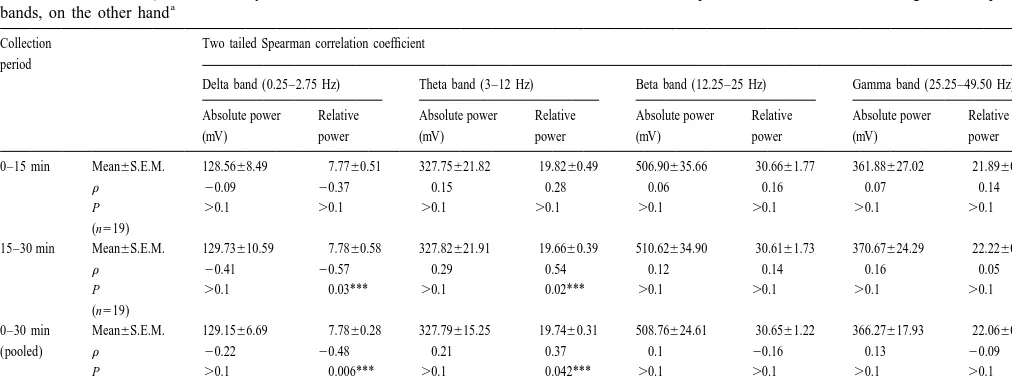
Correlation coefficientrbetween acetylcholine release, on the one hand, and both absolute and relative powers of delta, theta, beta and gamma frequency
a
bands, on the other hand
Collection Two tailed Spearman correlation coefficient period
Delta band (0.25–2.75 Hz) Theta band (3–12 Hz) Beta band (12.25–25 Hz) Gamma band (25.25–49.50 Hz)
Absolute power Relative Absolute power Relative Absolute power Relative Absolute power Relative
(mV) power (mV) power (mV) power (mV) power
0–15 min Mean6S.E.M. 128.5668.49 7.7760.51 327.75621.82 19.8260.49 506.90635.66 30.6661.77 361.88627.02 21.8960.63
r 20.09 20.37 0.15 0.28 0.06 0.16 0.07 0.14
P .0.1 .0.1 .0.1 .0.1 .0.1 .0.1 .0.1 .0.1 (n519)
15–30 min Mean6S.E.M. 129.73610.59 7.7860.58 327.82621.91 19.6660.39 510.62634.90 30.6161.73 370.67624.29 22.2260.53
r 20.41 20.57 0.29 0.54 0.12 0.14 0.16 0.05
P .0.1 0.03*** .0.1 0.02*** .0.1 .0.1 .0.1 .0.1
(n519)
0–30 min Mean6S.E.M. 129.1566.69 7.7860.28 327.79615.25 19.7460.31 508.76624.61 30.6561.22 366.27617.93 22.0660.42
(pooled) r 20.22 20.48 0.21 0.37 0.1 20.16 0.13 20.09
P .0.1 0.006*** .0.1 0.042*** .0.1 .0.1 .0.1 .0.1 (n538)
a
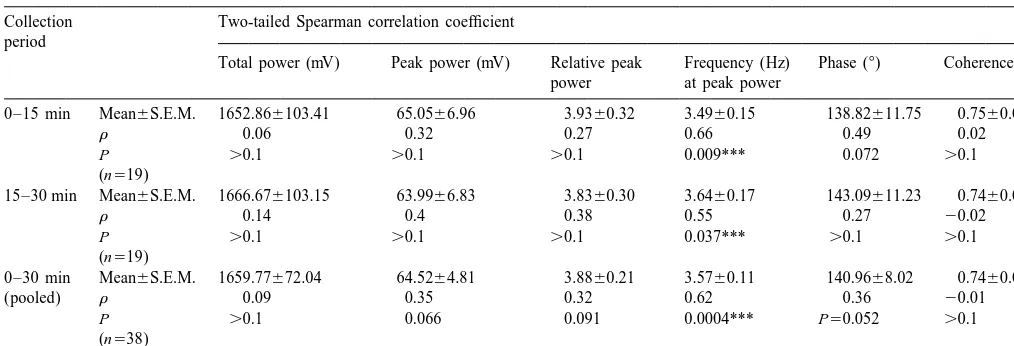
Table 2
As in Table 1, except that spectral parameters were total power, peak power, relative peak power, frequency at peak power, phase and coherence, calculated from the 0.25–49.50 Hz band
Collection Two-tailed Spearman correlation coefficient period
Total power (mV) Peak power (mV) Relative peak Frequency (Hz) Phase (8) Coherence power at peak power
0–15 min Mean6S.E.M. 1652.866103.41 65.0566.96 3.9360.32 3.4960.15 138.82611.75 0.7560.04
r 0.06 0.32 0.27 0.66 0.49 0.02
P .0.1 .0.1 .0.1 0.009*** 0.072 .0.1
(n519)
15–30 min Mean6S.E.M. 1666.676103.15 63.9966.83 3.8360.30 3.6460.17 143.09611.23 0.7460.05
r 0.14 0.4 0.38 0.55 0.27 20.02
P .0.1 .0.1 .0.1 0.037*** .0.1 .0.1
(n519)
0–30 min Mean6S.E.M. 1659.77672.04 64.5264.81 3.8860.21 3.5760.11 140.9668.02 0.7460.03
(pooled) r 0.09 0.35 0.32 0.62 0.36 20.01
P .0.1 0.066 0.091 0.0004*** P50.052 .0.1
(n538)
correlationrcalculated between ACh release and the EEG during the 30-min period were pooled (Table 2). Finally, a spectral parameters are presented in Tables 1 and 2. As can statistically significant correlation was no longer observed be seen from Table 1, a statistically significant positive between the cholinergic parameter and the duration of u
correlation (0.54, P50.02, n519) exists between the ACh for each consecutive 15-min interval (0.32, P.0.1, n517 output and the relative power of the theta band when the and 0.08, P.0.1, n517, respectively) and when pairs of pairs of values were collected during the 15–30-min values collected during the 30-min period were pooled interval of the recording period. Conversely, a statistically (0.08, P.0.1, n534).
significant negative correlation (20.57, P50.03, n519) In our previous study [38], in which electrophysiological was found in parallel between the neurochemical parame- characteristics of u were quantified with a ruler, ACh ter and the relative power of the delta band for pairs of content andufrequency were not found to be correlated. It measurements taken within the same interval. Both results could be argued that this apparent discrepancy between the were confirmed by the existence of significant correlations previous and the present experiments is due to the fact that (0.37, P50.042, n538 for ACh / relative power of theta 10.5% of spectra used for correlation calculation in the band pairs and20.48, P50.006, n538 for ACh / relative present study had peak power out of the u band, as power of delta band pairs) when the pairs of values were mentioned above. Specifically, these spectral values, al-pooled. Consistent with the above data, the relative power though infrequent, might interfere with attempts to corre-of the u band and that of delta band were negatively late subtle changes in bothuoscillations and ACh release. correlated at least when the pairs of values were pooled Therefore, in order to come to a clearer understanding of (20.46, P50.009, n538) (data not presented in the ACh release–u frequency, correlations between these tables). No correlation between spectral parameters and neurochemical and spectral parameters have been recalcu-ACh emerged from any high frequency bands (beta and lated using only spectra having peak power within the u
gamma). From Table 2, it can be seen that a statistically band. Clearly, only the averaged spectral values resulting significant positive correlation exists between ACh and the from three consecutive spectra with peak u power, col-frequency at peak upower when measurement pairs were lected during intervals of 15 min (see Section 2), were collected in the 0–15 min period (0.66, P50.009, n519). considered. On the basis of this criterion, we were able to This correlation was conserved between the pairs of values select 31 pairs of neurochemical / spectral values that were collected during the subsequent 15–30-min interval (0.55, used for correlation calculation. The results revealed that
P50.037, n519). This result was confirmed by the statistically significant correlations exist between ACh existence of a significant positive correlation between the release and frequency at peakupower when measurement cholinergic parameter and the frequency at peaku power pairs were collected in the 0–15-min period (0.61, P5
when the pairs of values collected during the 30-min 0.032, n516), the 15–30-min period (0.59, P50.05, n5
period were pooled (0.62, P50.0004, n538). The other 15) and when value pairs collected during the 30-min spectral parameters, i.e. total power, peak power, relative period were pooled (0.54, P50.006, n531). They are peak power, phase and coherence, were not significantly comparable to those derived from all the spectra collected correlated with ACh output, although the P value was during the same recording periods and which are presented close to the significance level of 0.05 (r50.36, P50.052, in Table 2 (frequency (Hz) at peak power). Thus, it
experiments regarding ACh release–u frequency relation- influence both the hippocampal EEG and autonomous ship is more likely due to differences in the two methods nervous system activity. For example, intrahippocampal or of calculation than inconsistencies in the selection of EEG systemic administration of large but sublethal doses of a segments for traditional and spectral measurements, re- reversible cholinesterase inhibitor, physostigmine,
general-spectively. ly elicits, in both the normal and urethane-anaesthetised
From Tables 1 and 2 which present the mean6S.E.M. of rat, uninterrupted trains of robustuwaves often associated spectral parameters derived from the spectra collected with tremors, salivation, and defecation (Refs. during the experiment, it can be seen that, in general, both [44,48,51,54,56,57] and P. Monmaur, unpublished
observa-uduration and spectral values collected during 0 to 15 min tion). Rats used in the present experiment exhibited none were comparable to those collected during 15 to 30 min of of these central and peripheral manifestations which can be the recording period. considered as clear-cut signs of toxicity. Collectively, these observations suggest that the neostigmine concentration in the perfusate used in the present dialysis study should be
4. Discussion within or near the limits of physiological conditions. An essential clue to the correct understanding of the
4.1. ACh release relationship betweenurecorded from the dorsal
hippocam-pus and ACh collected in the ventral hippocamhippocam-pus lies in ACh contents found in the present experiment are the general topography and the function(s) of the choliner-approximately of the same order of magnitude as those gic septal efferents to the whole hippocampus. Both the previously reported by Cao et al. [9] in the ventral dorsal and ventral hippocampus receive most of their hippocampus of the urethane-anaesthetised rat, but greater septal cholinergic inputs via the fornix, the fimbria, and the (3- to 4-fold) than those measured in the ventral hippocam- supracallosal stria (dorsal route) [21]. The ventral hip-pus during our previous dialysis study also using rats pocampus, but not the dorsal, receives additional choliner-anaesthetised with urethane [38]. This difference in ACh gic inputs (10–30%) from the septum via the amygdaloid contents between our two experiments might essentially be area (ventral route) [17,34]. Since selective lesion of the attributable to the fact that time between probe insertion fornix-fimbria fibres abolishes u in both the dorsal and and ACh collection period were significantly larger in the ventral hippocampus [47], the involvement of the ventral present experiment, which is consistent with the finding of route inu production is unlikely, although this is not yet Damsma et al. [12] that, at least in the freely moving rat, conclusively demonstrated. Based on these data, it can be striatal release of ACh gradually increased with time of argued that the activity of the ventral cholinergic route perfusion.The lowest ACh basal concentration measured in may contribute to changes in ACh level selectively in the the present study was 65.52 fmol, which is close to the ventral hippocampus, irrespective of the generation and / or detection limit of the present HPLC method, thus demon- modulation of hippocampalu. Such changes may introduce
25
strating that addition of 10 M neostigmine to the a bias in our attempts to correlate subtle u changes with perfusate was necessary when defining the ACh baseline. concomitant variations in ACh release from septohip-On the other hand, it might be argued that the use of a pocampal cholinergic pathway. In fact, observations by cholinesterase inhibitor at this concentration in the perfu- Nilsson et al. [40] reduces this possibility. On the basis of sate may induce both biochemical and electrophysiological dialysis experiments in the freely moving rat, these authors changes in the hippocampus from which the EEG was reported that following transection of the fornix and recorded. Such changes might seriously interfere with fimbria which normally abolish u in both the dorsal and attempts to correlate subtle EEG changes with real physio- ventral hippocampus [47], residual ACh (about 25% of logical variations in ACh release from the septohippocam- baseline level) was detected not only in the ventral as pal cholinergic pathway. It has been shown that neostig- expected but also in the dorsal hippocampus, as a possible mine significantly increases the extracellular ACh content consequence of ACh diffusion from structures adjacent to in rat brain [12]. This increased ACh level might, in turn, the hippocampus [40]. This finding is of importance for the affect ACh efflux from cholinergic terminals via action on present study since it can be taken to mean that the whole presynaptic nicotinic and the M2 subtype of muscarinic hippocampus can nearly be considered as a homogeneous receptors which mediate a feedback activation [45] and structure in terms of cholinergic activity when evaluated inhibition [23,41,45,46], respectively, of ACh release. In by the HPLC method.
fact, micromolar neostigmine concentrations in the
perfu-sate appear to inhibit only a small portion of the acetyl- 4.2. ACh andu duration
cholinesterase activity in the perfused area [12], and the
and provide further support for the view that theurhythm anaesthetised animal, is also of relevance to the above might be generated even though hippocampal ACh release hypothesis. Collectively, these observations are in line with does not increase, provided that sufficient synchronising the hypothesis that ascending cholinergic systems are activity occurs by an alternative system, the GABAergic critically involved in the regulation of EEG state. septohippocampal fibres, for instance [10,50]. However, it
can be argued that in the previous study and the present 4.4. ACh and frequency at peaku power relationships
investigation as well,uduration was calculated with a ruler
and, as a consequence, the resulting measures could be An additional and important finding brought about by subjective. Therefore, further study using an automated the present study is that ACh output was positively method to measure u duration is needed to decide this correlated with the frequency at peak power and that this
issue. correlation persisted throughout the experiment. The
fre-quency at peak power is considered to be a reflection of 4.3. ACh and power relationships the dominant frequency of the electrophysiological signal. In this context, the above data that ACh output and the The spectral method used here revealed that the relative frequency at peak power covaried can be taken to suggest power of the u band was positively correlated with ACh that the septohippocampal cholinergic cells and the neuro-output. However, peakupower (and relative peakupower physiological mechanism involved inufrequency modula-as well) wmodula-as not statistically related to ACh output. In fact, tion are functionally related. Based on a large compilation as far as the present spectral method is concerned, the peak of literature data, Kirk [21] recently concluded that both
urethane-anaesthetised rat, the modulation of u frequency modulation of frequency of this rhythm. They also confirm and of u amplitude may depend on the activity of that the activation / inactivation of the cholinergic septohip-GABAergic and cholinergic septal neurons projecting to pocampal neurons is of importance for the modulation of the hippocampus, respectively. However, the degree to both theuand delta components of the hippocampal EEG, which the action of septohippocampal GABA contributes which underly normal alert immobility and automatic to the control of u will be conclusively established only behaviour of the waking state, respectively, of the freely after studying the EEG effects of selective and complete moving rat. These findings and conclusions are derived inactivation of GABAergic components of the septohip- from the urethane-anaesthetised model which offers advan-pocampal pathway, which is critically involved in u tages for this study as mentioned in Section 1. However,
production. anaesthesia might modify the activity of other neural
In terms of septohippocampal functions, it is of interest systems involved in EEG regulation, such as serotoniner-that, in addition to relative u power, hippocampal ACh gic ascending fibres arising from the raphe nucleus and content is related to frequency at peak u power. This innervating both septum and hippocampus [20,58], a observation is consistent with the previous hypothesis that phenomenon which may interfere with the present study. septohippocampal cholinergic activity as well as shifts in Therefore, studies in undrugged animals are necessary to both hippocampaluamplitude andufrequency are critical determine the degree to which the cholinergic afferents to for hippocampal role in behavioural modulation, notably the hippocampus modulateurelative to the serotoninergic when the experimental animal is involved in learning and system, which is believed to cooperate with the septoch-memory tasks [18,43,53]. olinergic pathway in controlling u which accompanies
voluntary movements in the freely moving rat [55]. 4.5. Technical remarks
Our previous observations [38] indicated that the am- Acknowledgements
plitude, but not frequency, ofutraditionally scored with a
ruler and recorded from the dorsal hippocampus of the We thank Doctor Laurent Pezard for valuable remarks urethane-anaesthetised rat was positively correlated with regarding spectral analysis of signals. We would also like ACh output measured in the contralateral dorsal hippocam- to thank Jean-Yves Bertholet for his pertinent suggestions pus. No significant correlation was found between ACh regarding the discussion. This study was supported by the output in the ventral hippocampus anduparameters. It is Direction des Recherches et Etudes Techniques (D.R.E.T. therefore notable that, in preparations similar to that used 95 / 108).
in the present study, ACh output measured within the ventral hippocampus was positively correlated not only
with relative power in theuband but also the frequency at References the peak u power, which as mentioned above reflects the
amplitude and frequency, respectively, of urecorded from [1] D. Albe-Fessard, F. Stutinsky, S. Libouban, Atlas stereotaxique du ´
the ipsilateral dorsal hippocampus. This suggests that (1) diencephale du rat blanc, Editions du C.N.R.S, France, 1971. [2] D.G. Amaral, J. Kurz, An analysis of the origins of the cholinergic measurement of electrophysiological characteristics ofuby
and noncholinergic septal projections to the hippocampal formation means of the traditional method alone might not be a
of the rat, J. Comp. Neurol. 240 (1985) 37–59.
sufficient basis for making assumptions regarding hip- [3] P. Andersen, H.B. Bland, T. Myhrer, P.A. Schwartzkroin, Septo-pocampal ACh / EEG relationships, and (2) a combination hippocampal pathway necessary for dentate theta production, Brain of both in vivo microdialysis derived from ventral hip- Res. 165 (1985) 13–22.
[4] E. Apartis, F.R. Poindessous-Jazat, Y.A. Lamour, M.H. Bassant, pocampus and EEG recorded from the layer(s) presumed to
Loss of rhythmically bursting neurons in rat medial septum follow-be located near the fissure of the ipsilateral dorsal
hip-ing selective lesion of septohippocampal cholinergic system, J. pocampus, and analysed by means of the spectral method, Neurophysiol. 79 (1998) 1633–1642.
provide a powerful tool for clarifying the neurobiological [5] A. Beley, A. Zekhnini, S. Lartillot, D. Fage, J. Bralet, Improved function of the septohippocampal pathway. method for determination of acetylcholine, choline and other biogenic amines in a single brain tissue sample using HPLC and electrochemical detection, J. Liquid Chromatogr. 10 (1987) 2977– 2992.
5. Conclusions [6] B.H. Bland, The physiology and pharmacology of hippocampal
formation theta rhythms, Prog. Neurobiol. 26 (1986) 1–54. Coupled hippocampal EEG / microdialysis methods ap- [7] B.H. Bland, L.V. Colom, Extrinsic and intrinsic properties
underly-ing oscillation and synchrony in limbic cortex, Prog. Neurobiol. 41 plied to the urethane-anaesthetised rat yield, in our
time-(1993) 157–208. course determination, findings which are consistent with
complex increases local cerebral blood flow in the hippocampus in Jobe, The combined EEG-intracerebral microdialysis technique: a new tool for neuropharmacological studies on freely behaving anesthetized rats, Neurosci. Lett. 107 (1989) 135–140.
animals, J. Neurosci. Methods 43 (1992) 129–137. [10] L.V. Colom, S. Nassif-Caudarella, C.T. Dickson, J.W. Smythe, B.H.
[29] G. Lynch, G. Rose, G. Gall, Anatomical and functional aspects of Bland, In vivo intrahippocampal microinfusion of carbachol and
the septohippocampal projections, in: K. Elliot, J. Whelan (Eds.), bicuculline induces theta-like oscillations in the septally
deaf-Functions of the Septo-hippocampal System, Ciba Foundation ferented hippocampus, Hippocampus 1 (1991) 381–390.
Symposium, Vol. 58, Elsevier, Amsterdam, 1978, pp. 5–24. [11] G. Damsma, B.H. Westerink, P. de Boer, J.B. de Vries, A.S. Horn,
[30] G.P. Mark, P. Rada, E. Pothos, B.G. Hoebel, Effects of feeding and Basal acetylcholine release in freely moving rats detected by on-line
drinking on acetylcholine release in the nucleus accumbens, trans-striatal dialysis: pharmacological aspects, Life Sci. 43 (1988)
striatum, and hippocampus of freely behaving rats, J. Neurochem. 1161–1168.
58 (1992) 2269–2274. [12] G. Damsma, B.H. Westerink, J.B. de Vries, C.J. Van den Berg, A.S.
[31] F. Marrosu, C. Portas, M.S. Mascia, M.A. Casu, M. Fa, M. Horn, Measurement of acetylcholine release in freely moving rats by
Giagheddu, A. Imperato, G.L. Gessa, Microdialysis measurement of means of automated intracerebral dialysis, J. Neurochem. 48 (1987)
cortical and hippocampal acetylcholine release during sleep-wake 1523–1528.
cycle in freely moving cats, Brain Res. 671 (1995) 329–332. [13] J. Day, G. Damsma, H.C. Fibiger, Cholinergic activity in the rat
[32] N. McNaughton, D.T.D. James, J. Steward, J.A. Gray, I. Valero, A. hippocampus, cortex and striatum correlates with locomotor activity:
Drenowski, Septal driving of hippocampal that rhythm as a function an in vivo microdialysis study, Pharmacol. Biochem. Behav. 38
of frequency in the male rat: effects of drugs, Neurosciences 2 (1991) 723–729.
(1988) 1019–1027.
[14] H.C. Dringenberg, C.H. Vanderwolf, Neocortical activation: modula- [33] S.I. Mellgren, B. Srebro, Changes in acetylcholinesterase and tion by multiple pathways acting on central cholinergic and distribution of degenerating fibres in the hippocampal region after serotonergic systems, Exp. Brain Res. 116 (1997) 160–174. septal lesions in the rat, Brain Res. 52 (1973) 19–36.
[15] J.D. Dudar, The role of the septal nuclei in the release of acetyl- [34] T.A. Milner, D.G. Amaral, Evidence for a ventral septal projection choline from the rabbit cerebral cortex and dorsal hippocampus and to the hippocampal formation of the rat, Exp. Brain Res. 55 (1984) the effect of atropine, Brain Res. 129 (1977) 237–246. 579–585.
[16] J.D. Dudar, I.Q. Whishaw, J.C. Szerb, Release of acetylcholine from [35] S.J. Mitchell, J.N. Rawlins, O. Steward, D.S. Olton, Medial septal the hippocampus of freely moving rats during sensory stimulation area lesions disrupt theta rhythm and cholinergic staining in medial and running, Neuropharmacology 18 (1979) 673–678. entorhinal cortex and produce impaired radial arm maze behavior in [17] F.H. Gage, A. Bjorklund, U. Stenevi, Reinnervation of the partially rats, J. Neurosci. 2 (1982) 292–302.
deafferented hippocampus by compensatory collateral sprouting [36] P. Monmaur, K. Ayadi, P. Breton, Hippocampal EEG responses from spared cholinergic and noradrenergic afferents, Brain Res. 268 induced by carbachol and atropine infusions into the septum and the (1983) 27–37. hippocampus in the urethane-anaesthetized rat, Brain Res. 631 [18] B. Givens, D.S. Olton, Bidirectional modulation of scopolamine- (1993) 317–324.
induced working memory impairments by muscarinic activation of [37] P. Monmaur, P. Breton, Elicitation of hippocampal theta by intrasep-the medial septal area, Neurobiol. Learn Mem. 63 (1995) 269–276. tal carbachol injection in freely moving rats, Brain Res. 544 (1991) [19] H. Golebiewski, B. Eckersdorf, J. Konopacki, The effect of intrasep- 150–155.
tal procaine injection of hippocampal theta in freely moving cat, [38] P. Monmaur, A. Collet, C. Puma, L. Frankel-Kohn, A. Sharif, Brain Res. Bull. 49 (1999) 407–412. Relations between acetylcholine release and electrophysiological [20] G.G. Kinney, B. Kocsis, R.P. Vertes, Medial septal unit firing characteristics of theta rhythm: a microdialysis study in the characteristics following injections of 8-OH-DPAT into the median urethane-anesthetized rat hippocampus, Brain Res. Bull. 42 (1997) raphe nucleus, Brain Res. 708 (1999) 116–122. 141–146.
[21] I.J. Kirk, Frequency modulation of hippocampal theta by the [39] P. Monmaur, C. Puma, A. Sharif, Involvement of M2 and non-M2 supramammillary nucleus, and other hypothalamo–hippocampal muscarinic receptors in hippocampal theta rhythm induced by interactions: mechanisms and functional implications, Neurosci. carbachol infusion into the septum of the rat, Brain Res. 656 (1994)
Biobehav. Rev. 22 (1998) 291–302. 199–204.
[22] I.J. Kirk, N. McNaughton, Mapping the differential effects of [40] O.G. Nilsson, P. Kalen, E. Rosengren, A. Bjorklund, Acetylcholine procaine on frequency and amplitude of reticularly elicited hip- release in the rat hippocampus as studied by microdialysis is pocampal rhythmical slow activity, Hippocampus 3 (1993) 517– dependent on axonal impulse flow and increases during behavioural
525. activation, Neuroscience 36 (1990) 325–338.
[23] K. Kitaichi, J.C. Day, R. Quirion, A novel muscarinic M(4) receptor [41] O. Nordstrom, T. Bartfai, Muscarinic autoreceptor regulates acetyl-antagonist provides further evidence of an autoreceptor role for the choline release in rat hippocampus: in vitro evidence, Acta Physiol. muscarinic M(2) receptor sub-type, Eur. J. Pharmacol. 383 (1999) Scand. 108 (1980) 347–353.
53–56. [42] S.D. Oddie, B.H. Bland, Hippocampal formation theta activity and [24] R. Kramis, C.H. Vanderwolf, Frequency-specific RSA-like hip- movement selection, Neurosci. Biobehav. Rev. 22 (1998) 221–231. pocampal patterns elicited by septal, hypothalamic, and brain stem [43] D. Olton, A. Markowska, M.L. Voytko, B. Givens, L. Gorman, G. electrical stimulation, Brain Res. 192 (1980) 383–398. Wenk, Basal forebrain cholinergic system: a functional analysis, [25] R. Kramis, C.H. Vanderwolf, B.H. Bland, Two types of hippocampal Adv. Exp. Med. Biol. 295 (1991) 353–372.
[47] J.N.P. Rawlins, J. Feldon, J.A. Gray, Septo-hippocampal connect- cytochemical localization in relation to learning and memory, Prog. ions and the hippocampal theta rhythm, Exp. Brain Res. 37 (1979) Neurobiol. 58 (1999) 409–471.
49–63. [54] C.H. Vanderwolf, Neocortical and hippocampal activation relation to [48] C.I. Rowntree, B.H. Bland, An analysis of cholinoceptive neurons in behavior: effects of atropine, eserine, phenothiazines, and
amphet-the hippocampal formation by direct microinfusion, Brain Res. 362 amine, J. Comp. Physiol. Psychol 88 (1975) 300–323.
(1986) 98–113. [55] C.H. Vanderwolf, G.B. Baker, Evidence that serotonin mediates [49] R.S. Sainsbury, B.H. Bland, The effects of selective septal lesions non-cholinergic neocortical low voltage fast activity, non-choliner-on theta productinon-choliner-on in CA1 and the dentate gyrus of the hippocam- gic hippocampal rhythmical slow activity and contributes to in-pus, Physiol. Behav. 26 (1981) 1097–1101. telligent behavior, Brain Res. 374 (1986) 342–356.
[50] M. Stewart, S.E. Fox, Do septal neurons pace the hippocampal theta [56] C.H. Vanderwolf, R. Kramis, T.E. Robinson, Hippocampal electrical rhythm?, Trends Neurosci. 13 (1990) 163–168. activity during waking behaviour and sleep: analyses using centrally [51] C.H. Stumpf, H. Petsche, G. Gogolak, The significance of the acting drugs, in: K. Elliot, J. Whelan (Eds.), Functions of the rabbit’s septum as a relay station between the midbrain and the Septo-hippocampal System, Ciba Foundation Symposium, Vol. 58, hippocampus. II. The differential influence of drugs upon both the Elsevier, Amsterdam, 1978, pp. 199–221.
septal cell firing pattern and the hippocampus theta-activity, Clin. [57] O.S. Vinogradova, E.S. Brazhnik, V.S. Stafekhina, V.F. Kichigina, Neurophysiol. 14 (1962) 12–19. Modulation of the influences of cortical input on hippocampal [52] K. Toide, T. Arima, Effects of cholinergic drugs on extracellular neurons by cholinergic substances, Neurosci. Behav. Physiol. 26
levels of acetylcholine and choline in rat cortex, hippocampus and (1996) 45–54.
striatum studied by brain dialysis, Eur. J. Pharmacol. 173 (1989) [58] O.S. Vinogradova, V.F. Kitchigina, T.A. Kudina, K.I. Zenchenko, 133–141. Spontaneous activity and sensory responses of hippocampal neurons [53] E.A. Van der Zee, P.G. Luiten, Muscarinic acetylcholine receptors in during persistent theta-rhythm evoked by median raphe nucleus