Measures of complexity in neural spike-trains of the slowly
adapting stretch receptor organs
M.A. Jime´nez-Montan˜o
a, H. Penagos
a, A. Herna´ndez Torres
a,
O. Diez-Martı´nez
b,*
aDepartamento de Fı´sica y Matema´ticas,Uni6ersidad de las Ame´ricas-Puebla,Cholula,Puebla72820,Mexico bDepartamento de Psicologı´a,Uni6ersidad de las Ame´ricas-Puebla,Cholula,Puebla 72820,Mexico
Abstract
Discrete sequence analysis methods were applied to study spike-trains generated by the isolated neuron of the slowly adapting stretch receptor organ. Calculation of the algorithmic complexity and block entropies of digitized individual spike-train forms allowed us to distinguish different classes of neural behavior. While some spike-trains exhibited significant structure, others displayed diverse degrees of randomness. The sequences recorded during the stimulated portions of the intermittent and walk-through forms, differed considerably from their randomly shuffled surrogates. Informational and grammar complexity measures (in two, four and eight-letter alphabets), tell us things about the structure of spike-trains that are not obtained with conventional spike analysis. Comparison of the conditional entropies for the digitized signals showed that the method distinguishes between different stimulated conditions. Additionally, comparison of the different stimulated conditions with their corresponding surrogates showed that, both, conditional entropies and complexities were significantly different for the two groups. Although the original and the randomly shuffled sequences had the same distribution and average firing rate, their complexity values were different. The results obtained with both measures of sequence structure were quite consistent © 2000 Elsevier Science Ireland Ltd. All rights reserved.
Keywords:Stretch receptor organ; Spike-trains; Grammar-complexity; Block-entropies; Randomly shuffled surrogates
www.elsevier.com/locate/biosystems
1. Introduction
This communication describes the new tion that may be obtained by applying informa-tional and algorithmic measures of complexity to the analysis of neural spike-trains. We address an essential question concerning the value of this
type of analysis: do these measures provide in-sights into the description of certain categories of neural behaviors that could not be obtained by other methods? Our results suggest that the an-swer is positive. Calculation of the algorithmic complexity and block entropies allowed us to distinguish different classes of neural behavior. While some spike-trains exhibited significant structure, others displayed diverse degrees of ran-domness. We applied discrete sequence analysis * Corresponding author. Fax: +52-22-292634.
E-mail address:[email protected] (O. Diez-Martı´nez).
methods to study spike-trains generated by the isolated neuron of the slowly adapting stretch receptor organ (SAO). Our objective was to cor-relate the informational and algorithmic measures of complexity with different known neural behav-iors (i.e. individual spike-train forms). Segundo et al., (1987) observed the influence of regularly and irregularly arriving stimuli. These were pulse-like lengthenings applied to the muscle element of the SAO. The SAO neuron is a pacemaker cell that responds to isolated stimuli much like other cells respond to the arrival of EPSPs (Bryant et al., 1973; Diez-Martı´nez and Segundo, 1983). The effects of stimuli include shortening of the inter-vals in which they occur, i.e. they excite. Diez-Martı´nez et al. (1988) studied the consequences of periodically applied stimuli in pacemaker SAO neurons. Two individual spike-train forms are pervasive and straightforward: (i) locking is char-acterized by almost fixed phases; (ii) intermittency is distinguished by discharges that shift irregu-larly between prolonged epochs where spike phases barely change, and brief bursts with marked variations. As stimulus frequencies change, locking alternates with intermittency. Locked domains have simple, rational spike to tug ratios (e.g. 1:1, 2:1, etc.). This approach, based upon Dynamical System Theory, could not be applied as conveniently to study the effect of irregular perturbations. Since situations where pacemaker neurons are influenced by irregular inputs must be common in nature, other methods of analysis are needed. Furthermore, particularly with small amplitudes, other spike-train forms appear which are less clear. These include (Se-gundo et al., 1998): (i) phase walk-through, i.e. phases vary cyclically, increasing or decreasing respectively depending on whether stimulus fre-quency is larger or smaller than the natural one; (ii) ‘messy’, i.e. difficult to describe succinctly. Furthermore, with prolonged stimulation periods, irregular transitions between behaviors could oc-cur. Thus, many important facets of periodic driving remain puzzling; indeed, whereas behav-iors at some frequencies are summarized and un-derstood clearly, others are unclear. Therefore, to improve the comprehension of these ill-defined issues, we complement standard statistical
meth-ods and non-linear analytical techniques, em-ployed in former publications, with informational and algorithmic complexity mea-sures.
2. Materials and methods
2.1. Representations of sequences
A time series consists of a sequence of real numbers. Symbol sequences are composed of symbols (letters) from an alphabet of l letters (e.g. for l=4, {A, C, G, T} is the DNA alpha-bet; for l=2, {0, 1} is the binary alphabet, etc.). By digitization, time series may be converted into symbol sequences. The usefulness of subsequent complexity calculations depends crucially on the procedure used to partition the data among a finite alphabet of symbols. One alternative, sug-gested in (Rapp et al., 1994), is partitioning about the median. It is considered a good choice be-cause it most effectively reveals the randomness of the data. All binary sequences reported in this article correspond to interspike interval data con-verted to symbols by partitioning about the me-dian.
Two sections formed each test: a spontaneous discharge pre-stimulus control condition and one during which trains of stimuli were applied. The median was calculated separately for each of these portions. If the data values were less than the median, they were assigned the symbol 0. Otherwise, symbol 1 was assigned. The reduction of the data to a sequence of symbols was not limited to the binary alphabet. We applied the procedure for partitioning about the median to construct sequences composed of larger symbol sets (four and eight). In each case, an equal number of interspike intervals were assigned to each symbol.
2.2. Entropy-like measures of sequence structure
We give a short review of the definition of entropies and other informational concepts. Substrings ofn letters are termed n-words. If stationarity is as-sumed, any wordican be expected at any arbitrary site to occur with a well-defined probabilitypi. For
n=1 we get the usual Shannon entropy (Shannon, 1948):
H1= −% l
i=1
pi·log2pi (1)
Forn\1 we obtain the so-calledn-word entropies
(block-entropies or higher-order entropies) which are defined by
where the summation has to be carried out over all n-words withpi
(n)\0. The conditional entropies,
hn=Hn+1−Hn (3)
give the new information contained in then+1th symbol given the precedingn symbols. The maxi-mal value of H1 is log l, which occurs when the letters are independent and have the same probabil-ity (1/l).
The decay of the hn, as n increases, measures
correlation within the sequence. Hence, the condi-tional entropies are good candidates to detect structure in symbolic sequences because they re-spond to any deviation from statistical indepen-dence. To validate the results, we constructed surrogates. In the standard random shuffle (called algorithm zero in Rapp et al., 1994), the original data sequence is shuffled. This conserves the fre-quency of the letters but destroys all correlations. Following Theiler et al. (1992), we will take as our measure of significance theS-measure, defined by the difference between the original value and the mean surrogate value of a measurement, divided by the standard deviation of the surrogate values:
S=Morig−Msurr/ssurr (4)
S gives the number of standard deviations (ss) separating the value of the measurement obtained with the original data and its surrogates. In this paper,Mwill alternatively represent the values of the calculations of interest; i.e. conditional en-tropies and grammar complexities (see below).
2.3. Context-free grammatical complexity
The Grammar-complexity is an attempt to deter-mine the algorithmic complexity of a sequence (Ebeling and Jime´nez-Montan˜o, 1980), by means of a context-free grammar (Rayward-Smith, 1983). The essence of the concept is to compress a sequence by introducing new variables. The length of the compressed sequence is taken as a measure of the complexity of the sequence. Briefly, our procedure is the following: all subwords of length two are formed to make, with each one, a search over the whole string to determine the most fre-quent one (Jime´nez-Montan˜o et al., 1997). The most frequent pattern is substituted by a non-termi-nal symbol, also called variable or syntactic cate-gory (Rayward-Smith, 1983), in all its appearances in the sequence, with the condition that it is repeated more than twice. This operation is per-formed, as many times as possible, until there are no more strings of length two, which occur more than two times. Then, one searches for strings of length equal or greater than three, that appear at least two times, substituting the longest one by a non-terminal symbol. In this way a context-free grammar which generates the original sequence is obtained. If the sequence is coded in a l-letter alphabet, the corresponding complexity is denoted by Cl.. In the following we shall calculateCl for
l=2, 4, 8. A detailed description of the procedure and appropriate examples may be found in a former publication (Rapp et al., 1994).
2.4. Experimental methods
analyzed four arbitrarily chosen individual spike-train forms. Every spike-spike-train analyzed here, se-lected from a broader set, was typical of a particular form.
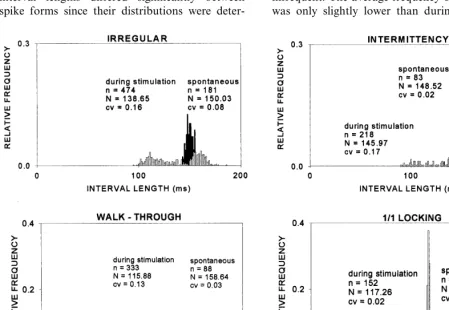
Interspike interval histograms (ISIHs) were constructed to compare the corresponding control conditions with the effects of stimulus application (Fig. 1). The SAO spontaneously discharged as a noisy pacemaker. Its interval distributions were Gaussian with relatively narrow histograms, which reflected the small CVs. Hence, interval fluctuations during the spontaneous firings were slight (e.g., CV=0.02). During stimulation, the interval lengths differed significantly between spike forms since their distributions were
deter-mined by the stimulus parameters (i.e. regularity and frequency). When irregular stimulation was applied, the spike-train form displayed a bimodal pattern. Some intervals were shortened with re-spect to the spontaneous ones; the average fre-quency of the intervals was lower than during the spontaneous condition (138.65 vs. 150.03 ms). However, some intervals were lengthened and, as expected, the overall variation of intervals in-creased considerably (CV=0.16). In the intermit-tent spike form, the interval distribution was complex. Although some intervals were shortened with respect to the spontaneous ones, these were infrequent. The average frequency of the intervals was only slightly lower than during the control
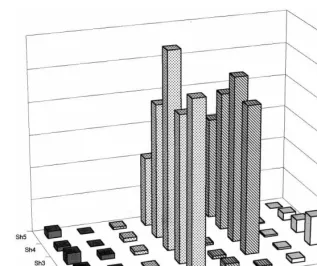
Fig. 2.Svalues of conditional entropies for binary alphabet. The y-axis represents the S measures of the conditional entropies (Shn=hnorig−hnsurr/ssurr). TheShngives the number ofssseparating the value of the measurement obtained with the original
data and the mean of its surrogates. Thex-axis represents the different selected spike-train forms for the respective spontaneous (Sp) and stimulated (St) portions. Each spike-train form is identified by a different pattern of the bars. Thez-axis identifies theShnsfor
the conditional entropies (hn) fromn=1, … , 5. In all spike forms, during the spontaneous condition (Sp) theShnvalues were always
near zero. In contrast, the sequences recorded during the stimulated portions of the intermittent (INT) and walk-through (W-T) forms, differed considerably from their surrogates (i.e. the number ofssfrom the expectation value of the null hypothesis was large for allhns).
(145.97 vs. 148.52 ms). However, most intervals were lengthened and, the CV was similar to that observed during irregular stimulation (CV= 0.17). The ISIHs for the walk-through and locked spike forms were qualitatively similar. During stimulation, intervals were shortened and their distributions were Gaussian-like. However, the width was much narrower in the locked form, reflecting the consistency of the interval values.
3. Results
3.1. Entropy and conditional entropies
We analyzed the four arbitrarily chosen individ-ual spike-train forms that were encoded in a
binary alphabet. In each case, we compared the original digitized signals obtained during stimula-tion with their corresponding surrogates. We used 100 different random shuffles. The randomly shuffled surrogates examine a specific null hypoth-esis: the structure of the spike-train is indistin-guishable from uncorrelated noise that has the same distribution. We calculated theS-measure of the conditional entropies (Shn) of the different
spike-train forms, coded in a binary alphabet, for both spontaneous (Sp) and stimulated (St) condi-tions (Fig. 2). From these calculacondi-tions, several important observations can be made. In all spike forms, during the spontaneous condition the Shn
values were always near zero. Hence, the original and the mean surrogate hn values were similar.
se-quences was also observed for the stimulated por-tions of the irregular (IRR) and locked (1/1) forms. Thus, the original and surrogate sequences were similar in both spontaneous and stimulated portions. In contrast, the sequences recorded dur-ing the stimulated portions of the intermittent (INT) and walk-through (W-T) forms, were con-siderably different from their surrogates (i.e. the number of ss from the expectation value of the null hypothesis was large for all hn). The only
exception was the Sh1 value in the W-T case. Furthermore, the Shn values were obviously
dif-ferent from those of their respective spontaneous portions. Hence, the interval sequences of these spike-trains had a considerable degree of inner structure that was destroyed by the shuffling.
S-measures were also calculated with four and eight letter alphabets. With the four-letter alpha-bet, results for intermittent and walk-through forms were, in general, similar to those observed with the binary alphabet. The exception, was the lack of significant difference for the Sh4 value in the W-T form in the stimulated portion. With the eight-letter alphabet, results were similar to those obtained with the binary alphabet except for the locked form.
3.2. Binary grammar-complexity
We now address the following question: is the pattern of the message (i.e. the temporal order of the spikes) a significant contributor of the com-plexity or is this simply an exotic way of measur-ing its firmeasur-ing rate? This question can be addressed with very simple calculations. In all the sponta-neous conditions, the variation between the com-plexities of the original sequences and their surrogates was not significant. Hence, we will describe the results observed during the stimu-lated portions. Consider the irregular form as a specific example. This sequence was found to have a complexity, in the binary representation (C2= 153), almost identical with the average complexity of 100 random shuffles (C2=152.9). The distribu-tion and average firing rates were identical for the original and surrogate data sets. The structure of the spike-train was indistinguishable from uncor-related noise with the same distribution. This
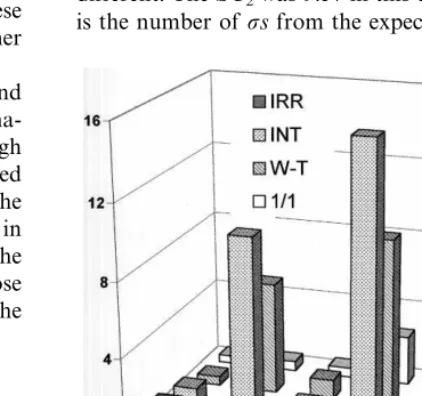
result is confirmed by the low value of theS -mea-sure: SC2=0.25 (Fig. 3). Thus, the rate and not the internal structure of the message, which was destroyed by the shuffle, determined the C2 ob-tained with the original data. Now let us consider the intermittent condition. This data set was found to have aC2value of 65. This sequence was subjected to 100 random shuffles, and the average complexity of the shuffled sequences was 84.64. Although the original and the randomly shuffled sequences had the same distribution and average firing rate, their complexity values were quite different. TheSC2was 9.57 in this case. BecauseS is the number ofssfrom the expectation value of
Fig. 3.S measures of complexity for the different alphabets. The y-axis represents the S-measures of the complexity (SCl=Clorig−Clsurr/ssurr). In this case, lis the number
of symbols in the alphabet that was used. TheSClgives the
the null hypothesis, the intermittent neural spike form had a degree of structure that was rate-inde-pendent. TheC2value increased with the random shuffle. The increase in disorder that occurred was what one might have expected. The SC2 for the W-T form was 6.01. This also reflects the rate-in-dependent inner structure of this form. In con-trast, the SC2 value of the locked form was 0.52 (i.e. the variation of the original sequence with respect to its surrogates was minimal). The signifi-cant differences between original and surrogate data sets for the intermittent and walk-through forms were also observed with the four and eight-letter alphabets (Fig. 3). Therefore, the complexity measures gave consistent results, regardless of the alphabet employed.
4. Discussion
As pointed out by Segundo et al. (1995): ‘At every synapse, a relation, or coding, between cor-responding spike trains is established. Physiolo-gists recognized early the importance of whether neuronal spikes were close of far apart, arose regularly or irregularly, etc.’. Trains of spikes have interval and instantaneous rate averages and patterns. Patterns reflect their pacemaker, inter-mittent, chaotic, etc., character. The informa-tional and algorithmic methods described in this communication complement statistical and dy-namical procedures, to quantitatively categorize sequence-sensitive patterns in neural spike trains. These measures may be valuable not only for this purpose but also in answering questions about input-output relations, information transmission, and mechanisms underlying impulse generation.
Rapp (1994) addresses three questions regard-ing the comparison of values of dynamical mea-sures obtained in contrasting experimental conditions. We will paraphrase these in a final analysis of our results. The first question is, did the methods we used tell us anything? This ques-tion must be answered with a definite yes. Both the informational and grammar complexity meth-ods tell us things about the structure of specific and neural behaviors that are not obtained with conventional spike analysis. Comparison of the
different stimulated conditions and their corre-sponding surrogates showed significantly different results, with both measures. Hence, these two measures of sequence structure are quite consis-tent. The second question asked is the following: did these methods tell us anything that we didn’t already know? The answer in this case is, yes and no. The measurement of block entropies and the derived conditional entropies allowed a more ac-curate prediction of the degree of correlation in the signals. Also, quantification of different de-grees of randomness is possible. Furthermore, the determination of theS values has obvious advan-tages in terms of the capacity to test data ob-tained in certain experimental conditions with clear statistical criteria. However, the negative part of the answer has to do with the fact that we knew the differences in the behaviors beforehand through other means. The third question is, did these methods tell us anything useful? Here, the advantages and limitations of the methods deter-mine our answer. The usefulness of the methods is derived from their simplicity. Furthermore, they do not require large data samples to be used. Nevertheless, they have limitations when applied to study naturally functioning neurons. These are complicated systems that involve numerous physi-cal variables. Because representations based on many variables are bound to be unmanageable, compacted models are employed because they mimic neuronal behavior satisfactorily (Segundo et al., 1998). The use of such models allows explanation of mechanisms and prediction in the context of their underlying theories. In contrast, the methods we used are empirical in the sense that they require no such models or theories to be applied. This shortcoming, if recognized, may also be a powerful pragmatic advantage.
Acknowledgements
for suggestions to improve the manuscript. Finan-cial support from CONACYT (Projects 25977-A and M9401-3823) is warmly acknowledged.
References
Bryant, H.L., Jr, Ruı´z Marcos, A., Segundo, J.P., 1973. Corre-lations of the neural spike discharges produced by monosy-naptic connections and by common inputs. J. Neurophysiol. 36, 205 – 225.
Diez-Martı´nez, O., Segundo, J.P., 1983. Behavior of a neuron in a recurrent excitatory loop. Biol. Cybern. 47, 33 – 41. Diez-Martı´nez, O., Pe´rez, R., Budelli, R., Segundo, J.P., 1988.
Locking, intermittency and bifurcations in a periodically driven pacemaker neuron: Poincare´ maps and biological implications. Biol. Cybern. 60, 49 – 58.
Ebeling, W., Jime´nez-Montan˜o, M.A., 1980. On grammars, complexity, and information measures of biological macro-molecules. Math. Biosci. 52, 53 – 71.
Ebeling, W., Feistel, R., Herzel, H., 1987. Dynamics and complexity of biomolecules. Phys. Scripta 35, 761. Herzel, H., Ebeling, W., Schmitt, A.O., Jime´nez-Montan˜o,
M.A., 1995. Entropies and lexicographic analysis of biose-quences. In: Mu¨ller, A., Dress, A., Vo¨gtle, F. (Eds.), From Simplicity to Complexity in Chemistry. Springer – Verlag, Heidelberg, pp. 7 – 26.
Jime´nez-Montan˜o, M.A., Po¨schel, T., Rapp, P.E., 1997. A
measure of the information content of neural spike trains. In: Mizraji, E., Acerenza, L., Alvarez, F., Pomi, A. (Eds.), Biological Complexity, A Symposium. D.I.R.A.C. Facul-tad de Ciencias, Montevideo, Uruguay, pp. 133 – 142. Rapp, P.E., 1994. A guide to dynamical analysis. Integr.
Physiol. Behav. Sci. 29 (3), 311 – 327.
Rapp, P.E., Zimmerman, I.D., Vining, E.P., Cohen, N., Al-bano, A.M., Jime´nez-Montan˜o, M.A., 1994. The algorith-mic complexity of neural spike trains increases during focal seizures. J. Neurosci. 14, 4731 – 4739.
Rayward-Smith, V.J., 1983. A First Course in Formal Lan-guage Theory. Blackwell Scientific Publications, Oxford, pp. 16 – 17.
Segundo, J.P., Diez-Martı´nez, O., Quijano, H., 1987. Testing a model of excitatory interactions between oscillators. Biol. Cybern. 55, 355 – 365.
Segundo, J.P., Stiber, M., Vibert, J.F., 1995. Synaptic coding of spike trains. In: Arbib, M.A. (Ed.), The Handbook of Brain Theory and Neural Networks. MIT Press, Cam-bridge, MA, pp. 953 – 956.
Segundo, J.P., Sugihara, G., Dixon, P., Stiber, M., Bersier, L., 1998. The spike trains of inhibited pacemaker neurons seen through the magnifying glass of nonlinear analyses. Neuro-science 87 (4), 741 – 766.
Shannon, C.E., 1948. A mathematical theory of communica-tion. Bell Syst. Tech. J. 27, 379 – 423.
Theiler, J., Eubank, S., Longtin, A., Galdrikian, B., Farmer, J.D., 1992. Testing for nonlinearity in time series: the method of surrogate date. Physica D 58, 77 – 94.