Indicators of carbon emission intensity from
commercial energy use in India
Barnali Nag
U, Jyoti Parikh
( )
Indira Gandhi Institute of De¨elopment Research, Gen. A. K. Vaidya Marg, Goregaon East ,
Mumbai 400065, India
Abstract
This study tries to analyze the commercial energy consumption evolution patterns in India in terms of primary energy requirements and final energy consumption and their implica-tions for overall carbon intensity of the economy. The relative contribution and impact of different factors such as activity levels, structural changes, energy intensity, fuel mix and fuel quality on the changes in aggregate carbon intensity of the economy has been studied, taking into account coal quality which has declined drastically in the last two decades. The major findings of the study are: firstly, from the 1980s onwards, income effect has been the major determinant of India’s per capita emission increase, although prior to that, energy intensity used to be the most important factor. Secondly, there has been a major shift towards electricity from primary energy carriers in the major energy consuming sectors, and the higher end use-efficiency of electricity has been able to compensate for the high emission coefficient of electricity consumption. Thirdly, emission intensity of thermal power generation shows a substantial decline when the data is controlled for the declining quality of coal used in power generation.Q2000 Elsevier Science B.V. All rights reserved.
JEL classifications:Q41; O53
Keywords:Decomposition; Divisia; Intensity; Structural effects; Fuel mix; Fuel quality
1. Introduction
Ž . Ž
The third session of the Conference of Parties COP 3 to the UNFCCC United
.
Nations Framework Convention of Climate Change held in Kyoto had highlighted the role of developing countries in helping to solve the problem of climate change
U
Tel.:q91-22-8400919; fax:q91-22-8402752.
Ž .
E-mail address:[email protected] B. Nag .
0140-9883r00r$ - see front matterQ2000 Elsevier Science B.V. All rights reserved.
Ž .
even though there is consensus on ‘common but differentiated responsibilities’ as specified during the 1992 Earth Summit at Rio. These concerns rest on the premise that developing countries would become a dominant force in the demand side of the world coal and oil markets1 during the next two decades.
In the present analysis, we study emissions due to energy use in India at different levels of energy use and activity. India is one of the developing world’s largest consumers of energy, primarily because of its huge population, rapidly rising income, urbanization and industrialization. Coal, which is the most polluting of all fossil fuels, is the most abundant source of commercial energy in India. India is the third largest producer of coal in the World after China and the USA with total coal reserves of approximately 200 billion tonnes. India’s coal industry is growing at 7%,
Ž .
well above the world average of 3% IEA, 1993 and most of the coal produced is used for indigenous use. On the other hand, India has been unable to raise its oil production substantially in the 1990s. Rising oil demand of almost 10% per year has led to sizeable oil import bills. In 1995 India’s installed generation capacity was 81 000 MW, of which 73% was thermal and 67% of the electricity generated in India is from coal. Keeping in view all these factors, the approach paper to the Ninth Plan has emphasized the satisfaction of energy demand from indigenous resources so as to reduce the vulnerability of the economy to uncertainties of
Ž
external markets as well as outflow of scarce foreign exchange resources Murthy
.
et al., 1997 . Even though a number of steps have been taken to orient energy sector towards market based economy and penetration of alternative sources such
Ž
as gas and renewable forms resource endowments patterns Parikh, 1997; Reid and
.
Goldenberg, 1998; Srivastava, 1997 , some constraints, such as energy supply security issues, inadequate gas distribution infrastructure, stagnation of oil
produc-Ž .
tion in the last decade Rao and Parikh, 1996 and lack of investible funds and weak institutions imply that India’s economy would continue to be dependent on carbon-intensive fuels at least in the medium term.
In absolute terms, India is the world’s sixth largest emitter of energy related
Ž .
CO , according to estimates of IEA reports 1993 , contributing to 3.3% of world2 CO emissions. Although measured on per capita basis, India’s energy related CO2 2
Ž
emissions are very low it was approx. 0.78 t of CO per person in 1993, five times2
.
below the world average of 3.90 energy related emissions have been growing rapidly, almost doubling between 1980 and 1990.
In the present study, we try to identify the major factors, which have influenced carbon emissions at different levels of energy use in India by using the Divisia decomposition technique. While rising incomes and increase in population con-tribute more to demand for primary energy sources, rapid urbanization and industrialization result in a shift from primary energy forms to transformed energy, namely electricity and from non-commercial to commercial energy. To this extent it becomes important to analyze the carbon intensity changes resulting from substitution of coal, oil and non-commercial fuels by electricity on the one hand
1
Consumption of petroleum and coal accounts for 41.2% and 38.5% of world’s total CO emissions2
and from changes in economic activity, sectoral and sub-sectoral shifts, and changes in energy efficiency on the other.
Our study seeks to answer the following questions:
1. What is the relationship between economic growth, energy intensity and carbon intensity? What has been the role of past national economic and energy policies on the trajectory, of these components?
2. How has the commercial energy consumption pattern evolved in India in terms of final energy consumption and primary energy consumption? What have been their implications for overall carbon intensity of the economy?
3. What is the relative contribution of different factors such as activity levels, structural changes, energy intensity and fuel mix on the changes in aggregate carbon intensity of the economy?
4. What can we infer from the past patterns of energy demand? How has the substitution of primary energy carriers namely coal, petroleum products by electricity contributed to overall carbon intensity changes in the wake of large generation and transmission and distribution losses in India?
5. Is there any evidence of environmental Kuznets curve behavior between economic growth and per capita income?
There exists a number of studies involving decomposition of energy consump-tion, energy intensity and emissions, which have attempted to distinguish the relative contribution of the different factors affecting changes in energy
consump-Ž
tion Boyd et al., 1987, 1988; Li et al., 1990; Shreshtha and Timilsina, 1996, 1997,
. Ž
1998 . The studies can be broadly categorized into cross-country studies Torvanger,
.
1991; Shreshtha and Timilsina, 1996; Ang and Pandiyan, 1997 and country-specific
Ž .
studies Boyd et al., 1987, 1988; Li et al., 1990; Lin and Chang, 1996; Huang, 1993 and most of the studies have preferred to concentrate on a specific sector of the
Ž
economy, the most frequently studied sector being the manufacturing sector Li et
.
al., 1990, for Taiwan; Torvanger, 1991, for OECD countries . Shreshtha and
Ž .
Timilsina 1996, 1997 have studied CO , SO and NO emissions in the power2 2 x
sector for selected Asian economies.
Ž .
So far, not much detailed study has been done on India. Srivastava 1997 has studied the past trends in energy consumption and economic growth in India, which primarily was a statistical analysis of the energy scenario and failed to capture the various factors which influenced such energy and emission trends.
Ž .
Shreshtha and Timilsina 1996 studied emission from power generation in India as part of a cross-country analysis of 12 countries.
All the previous studies have provided useful information regarding energy and emission indicators. However, one needs to be aware of the limitations of the analyses. The inter-country comparison of indicators of emission tends to be biased due to a number of reasons. Firstly, cross-country comparisons involve strong assumptions since the data used are not homogeneous in definition and measure-ment across countries. Indicators calculated to assess energy efficiency vary from country to country and the interpretations of similar ratios diverge considerably
Ž . Ž .
instance, has been derived from ADB 1992, 1993 , AEEMTRC 1994 and IEA
Ž1993 , for analyzing the emission intensity of power generation in 12 countries..
India has been studied along with other countries using this data source. These data assume calorific value as constant across countries whereas in India the calorific value of power grade coal has declined from 4822 kcalrkg in 1974 to 3736 kcalrkg in 1994, a decrease of approximately 22.5%. Our paper shows that conclusions differ significantly when indigenous data source that gives gross calori-fic value of each fuel, is used instead of data that add these fuels in weight regardless of varying quality across time. Secondly, detailed and richer data from such sources facilitate detailed decomposition and study of other important factors, which influence emissions considerably. Important indicators might be neglected due to data limitations and inferences could be misleading.
In this paper, we carry out three separate analyses for India. First, we look at growth in per capita emissions through primary energy requirements for India, which is more indicative of efficiency of generation and distribution as it includes losses. Next, we study final energy consumption from two broad perspectives: carbon emission arising due to final consumption of only commercial primary energy carriers such as coal and carbon emission arising due to final energy consumption including both primary energy carriers as well as electricity. The difference between the results in the two cases reflects the effect of substitution of primary energy carriers by electricity in final energy consumption. This kind of substitution has two implications as far as carbon emissions are concerned. Elec-tricity has high end use efficiency but its generation and distribution involves huge losses2 especially so since major generation in India is from primarily coal based
thermal plants. Increase in demand for electricity for end use consumption could therefore lead to increased carbon emissions. For further insights we also analyze the effects of fuel quality, fuel mix, and energy intensity on emissions from electricity generation separately. Changes in emission intensity in the power sector is a major indicator of change in efficiency because emission in the thermal power sector results from fossil fuel consumption to generate power, and emissions would
Ž .
be directly proportional to the ratio between total primary energy TPE consumed
Ž .3
and total final energy generated TFE .
2. Methodology
We carried out a study of emission intensity at three different levels of energy use and activity, using the Divisia decomposition technique. Although various decomposition techniques have been used for similar analyses, like Laspeyres index
Ž .
method Howarth et al., 1991; Schipper et al. 1997 and the more recent, factor
Ž .
analysis Landwehr and Jochem, 1997 , we have chosen to use Divisia decomposi-tion technique due to its various advantages over other indices including its
2
Transmission and distribution losses account for approximately 21% of total generation in India.
3
Ž
simplicity of implementation and size of residual Ang and Lee, 1994; Greening et
.
al., 1997 .
The decomposition equations for per capita emission and emission intensity and the components for each of the analyses are explained below. Carbon emission intensity has been defined as the ratio between total carbon emitted by a sector and activity level of that sector. In different studies, activity is taken as physical output or a measure of output such as PKm. in transport or value added. We have chosen value added as the determinant of activity level4 for study of emission due
to final energy consumption by sectors and total thermal power generation as a measure of activity level for emission intensity of power generation.
( )
2.1. TPER total primary energy requirements
For studying movements in per capita emissions and its indicators, we have done the analysis for the period between 1970 and 1995 and have considered emissions from primary energy consumption, namely coal, oil and hydro and nuclear power. We decompose per capita emission into fuel mix, energy intensity and per capita GDP.
The identity for the per capita emission can be written as,
F
ki s s carbon emission coefficient of energy source i5, which is constant over time;
Nt s population in year t;
Ž
Fi t s consumption of primary energy carrier i coal, crude oil, natural gas,
.
hydro and nuclear power ;
Ž .
Ft s total energy consumed expressed in gigajoules ; and GDPts gross domestic product in year t.
4
The concept of value added as proxy of activity level for the sector in question is not error free especially for sectors like transport where private trips do not contribute to value addition in the sector. However, studies where changes in carbon intensity are considered at sector level, it becomes the most suitable indicator for measuring aggregate output if not the best.
5
Ž .
For ease of notation, we write the decomposition Eq. 1b as
Ž . cts
Ý
ki t.mi t.It.PCt. 3i
The above relation between the variables is the decomposition we use to base our analysis on Divisia approach. This relationship can also be written as a decomposition of the growth rates of emission intensity of the four component indices, i.e.
Ž .
gcsgmqgIqgP C 4
where growth rates can be expressed as
dYrdt dlnY
Integrating both sides of Eq. 4 expressed as in Eq. 5 and taking antilog, yields a constant time Divisia index decomposition of the change in emission intensity. A Divisia index is the exponential of the weighted sum of growth rates where weights are each component’s share in aggregate. Thus, the weights change over time and can be written asWi ,t where,
However, our observations being discrete, time approximation has to be made and since for short-time periods, integrals can be approximated by means of the start-point and end-point, we use the weights as:
It
Dm s index for changing energy mix in the economy;
DI s index for changing energy intensity in the economy;
DPC s index for per capita income in the economy; and
R s residual term due to approximation.
R is very small in the case of Divisia index compared to other techniques of decomposition like the Laspeyres index with either fixed or rolling base year
ŽGreening et al., 1997 . Other features of this technique which prompted us to.
choose it for analysis are that the discrete form index approaches the continuous form index when length of the time period goes to zero. DI is also flexible since it employs moving weights rather than fixed weights.
2.2. Total final energy consumption, TFEC: inter sectoral analysis
Overall emission intensity of the sectors is decomposed into emission coefficient, fuel mix, energy intensity and structural effect. The residential sector has been excluded from this analysis as personal income of this sector and value added of other sectors are not comparable.6 The following variables have been used for the
decomposition:
ki s s carbon emission coefficient of fuel i in sector s, this coefficient does not vary across sectors. In the case of electricity, total carbon emissions were first calculated by summing over the products of individual fossil fuels used in power generation and their respective emission coefficients. This was divided by the total electricity used by final consumers to get the emission coefficient for electricity.7 This weighted coefficient is
depen-dent on the fuel quality and fuel mix in power generation, generation efficiency, transmission, and distribution losses. Calculation of emission for power sector is discussed in detail in the following section.
6
In National Income Accounting they appear in separate accounts.
7
Ž . Ei s s energy used from i in sector s. This is measured in gigajoules GJ .
Es s the sum of energy use over iin sectors, s, i.e. total energy use in sector s.
VAs s the volume of output measured as value added in sector s.
VA s the sum of value added over all sectors.
Ci s s carbon emission from use of fuel i in sector s.
Csstotal emission of carbon from all fuels and all sectors.
Ž .
Cs
Ý
Ci s 15i,s
csAggregate emission intensity over all sectors defined as total carbon emis-sion divided by total value added.
For our analysis emission intensity c is written as the following identity:
C Ei,s Es VAs
Ž .
cs s
Ý
ki s= = = 16VA i,s Es VAs VA
To facilitate notation let us write
Ei,s
The Divisia indices of the above components are found using the methodology described in the previous section. The final decomposition into indices of major components can be written as:
ct
Ž .
sDk?De?DI?DSqR 19
where Ris a residual term due to approximation, and Dk, De,DI, and DSare the Divisia indices for effects due to changes in emission coefficient, energy mix, energy intensity and structural shift.
Since final energy intensities refer to the final end uses of energy, they are more suitable for comparing the energy required for final consumption against value added than primary energy intensities. All sectoral activities do not respond equally to population changes and therefore specific energy intensity changes in each sector provide greater insight than energy per GDP or energy per capita. The analysis has been done twice, once including power in the group of energy sources used by the sectors and again by excluding it and using only petroleum products, gas and coal.
2.3. Transformation and con¨ersion sector
The components of the emission intensity studied are ‘fuel intensity effect’, i.e.
Ž
effect due to change in fuel intensities e.g. improvements in generation efficiency
. Ž
of power plants , generation mix effect and fuel quality effect due to changing
. Ž .
heat value of the fuels . An earlier study by Shreshtha et al. 1996 assumed constant calorific value of coal for all the countries thus neglecting the following two effects of declining calorific value of coal. Firstly, for the same amount of
Ž .
electricity generated GWH , a bigger quantity of coal may have to be consumed and secondly, since the carbon content of fuel is directly linked with the fuel’s energy content, the carbon per kilogram of fuel also reduces.
We call these two effects intensity effect and quality effect, respectively. Since these two effects are in opposite directions the net effect on carbon emissions would depend on the relative strengths of these two effects. The decomposition equation can be written as
ct s ki t?qi t?fi t?gi t, where,
ct s carbon emission intensity of thermal power generation;
ki t s emission coefficient of fuel i;
Ž .
qi t s fuel quality of i in GJrunit weight of fuel i ; and
fi t s fuel intensity, defined as
Fi t
Ž .
fi ts 20
Qi t
where,
Fi t s amount of fuel i used for power generation in year t.
Qi t s power generation based on fuel type i in year t.
Qi t
The final decomposition into indices of major components can be written as
ct
Ž .
sDq?Df?DgqR 22
cty1
where,
Dq s Divisia index for changing fuel quality;
Df s Divisia index for fuel intensity; and
Dg s Divisia index for generation mix.
To show the extent to which data limitations orrand assumptions in analyses affect results we have done the decomposition exercise for the power sector, once using constant calorific value of coal and once using varying calorific value of coal. We have fixed the calorific value of only coal for the former analysis because coal is used in large quantities by the power sectors and its quality has declined the most for coal compared to the other fuels used.
Ž
We have used annual time series data for consumption and quality gross
.
calorific value of coal, lignite, high-speed diesel oil, light diesel oil, furnace oil, LSHS and natural gas by thermal power plants. The period of analysis is 1974]1994.
3. Data sourcesIndependent data sources were used for the three analyses. The details and source data are given below.
( )
3.1. TPER total primary energy requirements
We use annual time series data for consumption of coal, crude oil, natural gas and hydro and nuclear power by the economy for the period between 1970 and 1995. Data sources for the analysis are Petroleum and Natural Gas Statistics,
ŽMoPNG , Coal directory of India, CCO , Central Electricity Authority, CEA. Ž .8 Ž .9
Ž .10
and National Accounts Statistics CSO .
( )
3.2. TFEC total final energy consumption
Four sectors have been studied, namely industry, agriculture, commercial and
8Coal directory of India, Coal Controller’s Organisation, Ministry of Coal, Government of India Žseveral issues ..
9Public electricity supply: All India Statistics: General Review, Central Electricity Authority,
Ž .
Government of India several issues .
10
National Accounts Statistics, Central Statistics Organization, Ministry of Planning and Programme
Ž .
transport. Data for energy use in agriculture includes consumption of petroleum
Ž .
products and natural gas by plantations like tea , but does not include petroleum products used by the agriculture sector for transportation of agricultural
commodi-Ž .
ties. Annual time series data for consumption and fuel quality in kcalrkg for each of these six fuels, namely coal, high speed diesel oil, light diesel oil, furnace oil, LSHS and natural gas and electricity by each of the sectors has been used for the period 1984]1994. Same data for aviation turbine fuel has been additionally used by the transport sector. Fuel consumption and fuel quality data are from energy
Ž .
statistics Ministry of Petroleum and Natural Gas, MoPNG and Central Electricity
Ž .
Supply Authority, Government of India CEA . Data for sectoral value added have
Ž .
been acquired from National Accounts Statistics of India CSO .
3.3. Transformation and con¨ersion sector
Study has been done for the period between 1974 and 1994 using annual time series data for fuel quality of each of the six fuels, i.e. coal, high speed diesel oil, light diesel oil, furnace oil, LSHS and natural gas and their consumption by power
Ž .
sector. Source of this data is Central Electricity Supply Authority CEA .
4. Discussion of results
4.1. Per capita emissions
Increase in per capita emission in itself is not so much of a concern to India as the current level of emissions have reached a mere 0.23 Tc per capita. However, it is important to identify contribution of the various factors, namely mix of energy sources, efficiency of energy use and rising income which boosts greater energy use, and also the change in trend of these factors for suitable policy analysis.
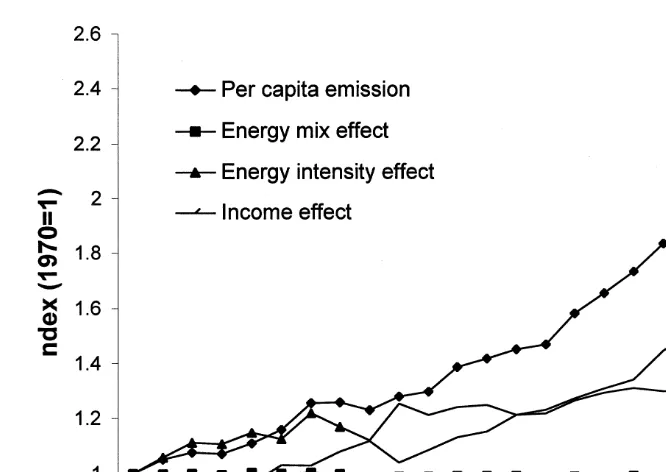
The results as shown in Fig. 1 indicate that until 1980, energy intensity was the major determining factor behind per capita emissions and from 1980 onwards income effect became the major contributor to per capita emissions. In the first decade of study, growth rate of per capita emissions was lower than in the 1980s
Ž .
when per capita emissions grew by 51.7% from 1980 to 1990 Table 1 . In the period 1970]1980, it was 29.4%. From 1980 to 1990, income effect showed a sharp rise by 44% and approximately 89% of the growth in per capita emissions were contributed by this factor. From 1990 to 1995, per capita emission rose by approximately 22% and all the three effects contributed to the rise, although fuel
Ž .
mix effect was almost nil the index being very close to 1 . Approximately 21% of the per capita emission rise was influenced by intensity component, that is, during this period economic activity became more energy intensive. Fuel mix effect has been almost constant, slightly moving in favor of reduced emission.
Fig. 1. Divisia index decomposition of per capita emission.
higher energy efficiency in the 1980s and can be attributed to the reason that after the first oil crisis in 1973, India undertook the policy of energy independence, which on the demand side implied energy efficiency. This along with the fact that India saw a high annual rate of growth in the 1980s led to a shift in the trend. Annual growth rate increased to approximately 6% in the 1980s from a low of approximately 3% in the 1970s. So although energy intensity used to contribute
Table 1
a
Divisia index decomposition of per capita emission intensity
1970]1980 1980]1990 1990]1995
Per capita emission 1.294 1.517 1.216
Energy mix effect 0.987 0.986 1.002
Žy4.6. Žy2.7. Ž1.2.
Energy intensity effect 1.210 1.068 1.043
Ž75.0. Ž13.8. Ž20.61.
Income effect 1.083 1.440 1.163
Ž29.6. Ž88.9. Ž78.1.
aNote.
nearly 75% of the per capita emission in the 1970s, the contribution declined to only approximately 13.8% in the 1980s.
Ž .
If the existence of an environmental Kuznet’s curve EKC is assumed for India, the rapidly rising per capita emissions following the trend of rising per capita income indicates that India is still in the rising slope of the inverted U-shaped EKC. CO being a global pollutant does not inflict local damage and its abatement2 cost being very high, the peak of EKC for CO is usually expected to be very high,2
Ž .
if at all it exists Cole et al., 1997 . The presence of Kuznets curve for CO2 emission is debatable since CO being a global pollutant does not give rise to local2
Ž .
disutility in the short run Arrow et al., 1995; Moomaw and Unruh, 1997 . However, in India, potential for improved efficiency in energy use, transmission and distribution of electricity, completion of the shift towards commercial fuels from traditional fuels and full electrification of all villages indicate towards the possibility of reaching a peak of the Kuznets curve. The downward movement might have to be a conscious effort towards removal of market distortions,
Ž .
structural change towards less polluting sectors growth of the service sector and international transfer of energy efficient and emission abating technologies.
4.2. TFE: cross-sectoral analysis
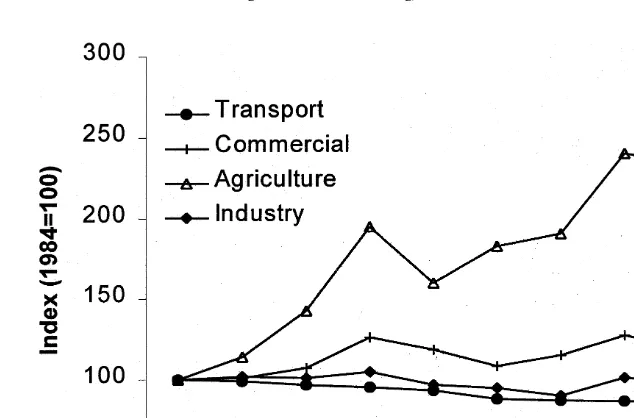
Changes in emission intensity of the four sectors have been shown in Fig. 2 as estimated from their energy use and composition including electricity. Comparing the different sectors, we find that transport sector had the strongest reduction in intensity of 18%, between 1984 and 1994 followed by the industrial sector where the reduction was approximately 8%. Emission intensity in the agricultural sector, however, has risen sharply by approximately 2.5 times. This could be explained by the fact that highly subsidized price of power in the agricultural sector, has led to indiscriminate use of electricity in this sector. Emission pertaining to fossil fuel use in power generation is considered as emission from electricity. Electricity being a transformed energy has a high emission coefficient due to generation and transmis-sion losses; thus, emistransmis-sion resulting from electricity consumption is very high for the agricultural sector. Approximately 95% of emission in agriculture comes from electricity consumption.
Fig. 2. Carbon emission intensities in different sectors.
increased from 38% in 1984 to 42% in 1994. Emission from power consumption has decreased by approximately 4% in this period.11
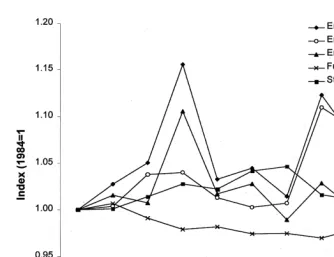
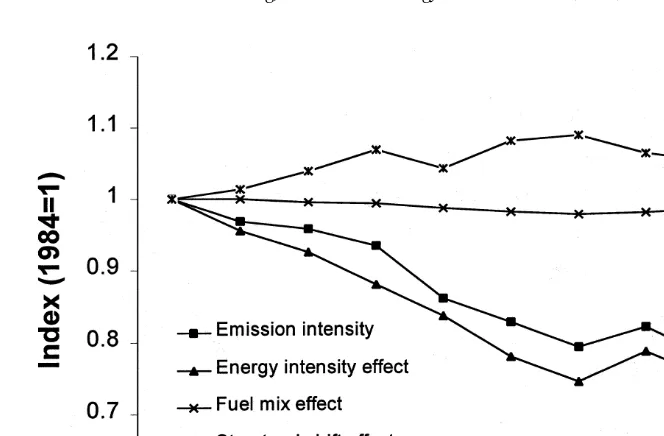
Results of the Divisia decomposition on emission intensity due to consumption of major primary energy carriers and electricity are presented in Fig. 3, which shows the evolution of carbon emission intensity, emission coefficient, fuel mix, energy intensity and structural effects. Fig. 4 presents the results of the analysis without considering power consumption by the sectors. Hence it does not include the emission coefficient change effect which results solely from the changing coefficient of power.
Fig. 3 shows that in the period between 1984 and 1987, all the three factors of energy intensity, emission coefficient and structural effect contributed to the rising emission intensity. In the period between 1984 and 1987, emission intensity increased by 15%, of which approximately 64.5% was contributed by the rise in emission coefficient. The effect of this factor, however, declined gradually. From 1991 onwards energy intensity effect was the most dominating factor in the rise in emission intensity. Results indicate that the contribution of the different factors have varied considerably over the years without showing any clear trend. So study of sub-periods might be misleading depending on the choice of end-points.
When the above analysis is carried out without including power consumption by
11
Ž .
Fig. 3. Decomposition of emission intensity of final energy consumption including electricity .
Ž .
the different sectors, results show Fig. 4 that emission intensity from direct consumption of fossil fuels is falling and declining energy intensity is the major causal factor behind this change emission intensity. Fuel mix effect and structural shift show similar movements as in the previous analysis including electricity, the former contributing to reduction in emission intensity while the latter showing movement towards energy intensive sectors. In the period from 1984 to 1994, emission intensity shows a fall of 28% caused primarily by energy intensity effect, which contributes 121% of the decline and by fuel mix effect, which contributes 14% of the decline. Structural shift has an effect of approximately 35% to an increase in emission intensity.
The two analyses, with and without power sector, captures implicitly the effect of fuel substitution. The sharply declining fuel energy intensity in the second analysis and a rising energy intensity in the first analysis, shows that in Indian economic sectors, direct fossil fuel consumption has been substituted by power consumption. This substitution has been distinct for the transport sector. However, the fact that
Ž .
Ž .
Fig. 4. Decomposition of emission intensity of final energy consumption excluding electricity .
4.3. Transformation and con¨ersion sector
Coal is the major fuel used in thermal power generation in India. However, the quality of coal going to thermal power generation has been declining in India as shown in Fig. 5. Energy used in power generation, measured as gigajoules per
Ž .
gigawatt hour GWH of thermal power generation shows a sharp decline when the calorific value of coal used is taken into account. From 1974 to 1984, the ratio of primary energy input in GJ to final electricity output in GWH declined by 12.4% and from 1984 to 1994, it further declined by 14%.
Ž
We have carried out our analysis using both constant calorific value 5000
.
kcalrkg and varying calorific value of coal to study the impact of coal quality
Ž .
decline on measurement of emission intensity growth. Results show Figs. 6 and 7 that the impact of coal quality on emission is substantial and the analysis fails to project the true picture if this aspect is ignored.
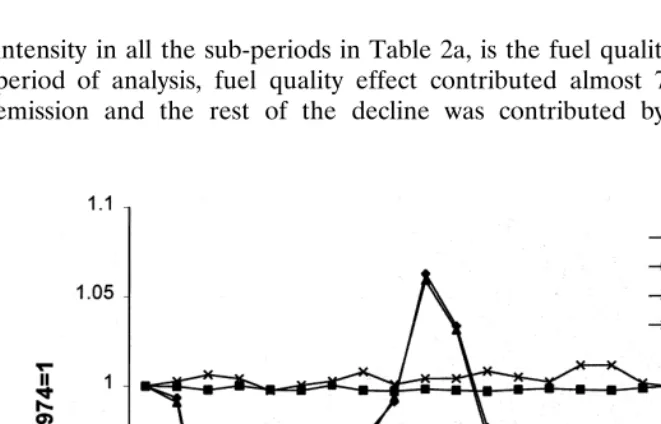
Ž .
Emission intensity with constant calorific value of coal Fig. 6 follows the path
Ž
of fuel intensity while fuel quality effect resulting from quality variations in other
.
Fig. 5. Calorific value of power grade coal in India.
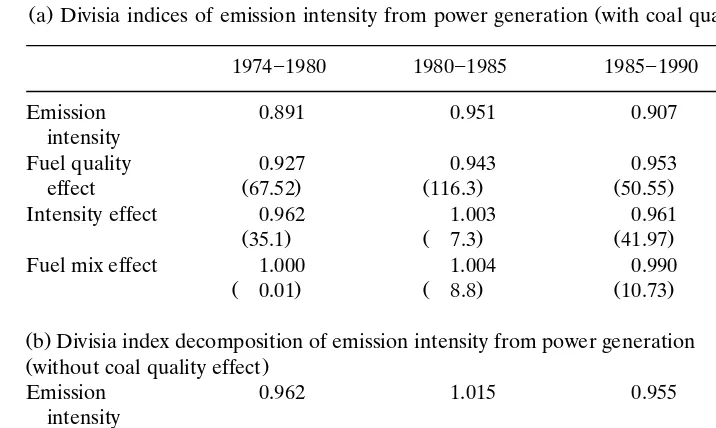
intensity in all the sub-periods in Table 2a, is the fuel quality effect. In the overall period of analysis, fuel quality effect contributed almost 74% of the decline in
Ž .
emission and the rest of the decline was contributed by intensity 24% and
Fig. 7. Decomposition of emission intensity of power generation with declining calorific value of coal.
Ž . Ž .
generation mix effect 2% . In the analysis without coal quality Table 2b , intensity effect is the major determinant of emission intensity.
5. Policy implications and conclusion
Need for GHG abatement on the one hand and urgency for improvement in energy efficiency, especially of non-renewable fossil fuel sources on the other, and the uncompromisable objective of development have diverted attention of energy policy of developing countries, more towards energy intensity changes of economic activity or GDP. The three different levels of analyses in this paper help us to face the questions posed at the beginning of the paper. Study of per capita emission from primary energy use shows that although rising energy intensity was the most important factor in the 1970s, from the 1980s onwards, rising per capita income became the major determinant of per capita emissions. The change in the trend can be attributed to the energy policy of the government emphasizing self-suf-ficiency through increased efself-suf-ficiency on the demand side and also the increased rate of economic growth in the 1980s.
Table 2
a Ž .a Divisia indices of emission intensity from power generation with coal quality effectŽ .
1974]1980 1980]1985 1985]1990 1990]1994
Emission 0.891 0.951 0.907 0.9747
intensity
Fuel quality 0.927 0.943 0.953 0.9653
Ž . Ž . Ž . Ž .
effect 67.52 116.3 50.55 138.9
Intensity effect 0.962 1.003 0.961 1.009
Ž35.1. Žy7.3. Ž41.97. Žy35.98.
Fuel mix effect 1.000 1.004 0.990 1.001
Žy0.01. Žy8.8. Ž10.73. Žy3.0.
Ž .b Divisia index decomposition of emission intensity from power generation
Žwithout coal quality effect.
Emission 0.962 1.015 0.955 1.013
intensity
Fuel quality 1.005 0.996 1.002 1.001
b Ž . Ž . Ž . Ž .
effect y1.3 y22.7 y4.4 12.1
Intensity effect 0.959 1.012 0.959 1.009
Ž108.3. Ž85.1. Ž89.7. Ž73.28.
Generation mix 1.003 1.005 0.993 1.002
Ž7.1. Ž37.5. Ž14.6. Ž14.6. aNote
: Figures in parentheses indicate percentage contribution of the components to change in emission intensity.
b
Quality effect implies the effect of changes in calorific value of fuels used other than coal in power generation.
consumption indicated that there has been significant substitution of primary energy carriers by electricity in energy consumption by the sectors. Furthermore, the analysis, including electricity, showed that overall growth in emission intensity has been contributed mainly by rise in energy intensity, although structural composition of production seemed to have been in favor of reduced emissions. Although emission coefficient of electricity consumption is much higher than primary fossil fuel consumption, our analysis showed that the effect of change in energy consumption mix, i.e. substitution of primary fuels by electricity has con-tributed towards reduction in emission intensity, the fuel mix effect being less than unity. The higher end-use efficiency of electricity consumption more than compen-sates for the high emission coefficient of electricity consumption. Thus, fuel shift towards electricity in India is favorable for emission reduction. The magnitude of this effect can be further enhanced through improvement in transmission and distributional efficiency, which would help in reducing the emission coefficient of electricity use.
improvement in efficiency. This improvement in efficiency could be due to the reason that although coal quality declined drastically, the reduction in price of inferior quality coal was much less than proportionate. This brought about ‘forced efficiency’ of coal use in power plants to avoid increased expenses of acquiring larger quantities of coal and also increased transportation cost of coal.
From the study of emission at different levels and the trend of the components, it can be expected that emissions will continue to be influenced by increased energy use by middle and upper income groups as more and more consumer products, especially electrical gadgets, penetrate into the market. Given that per capita energy consumption is very low and only a small percentage of households own consumer durables in India, it is expected that demand for energy will rise and so will emissions. The analysis indicates that energy consumption and hence emission in India are still in the rising slope of the EKC and peak might be reached when the organic level of energy use is reached, i.e. when full
electrifica-Ž .
tion and motorization of the economy is complete Sengupta, 1997 and the economy shifts from traditional to commercial fuels and from primary energy forms to transformed energy. Efficiency improvements through technological and managerial solutions could help India to ‘tunnel through’ the EKC. So far, most of the improvement in efficiency has come through autonomous technological im-provement and not conscious technical shift towards newer and more efficient technologies. India is expected to become more and more important as global energy consumer and therefore autonomous technological change will not be enough to attain the desired level of efficiency and emission reduction. It is important to recognize the features of the energy market in India which affect efficiency improvements. These include several price and non-price factors like improvement of energy infrastructure and removal of imperfections in the energy market.
References
ADB, 1992, Energy Indicators of Developing Member Countries of ADB, Asian Development Bank, Manila.
ADB, 1993, Electricity Utility Data Book for the Asia and Pacific region, Asian Development Bank, Manila.
AEEMTRC, 1994, Asian Energy Review, Asian-EC Energy Management Training and Research Centre, Jakarta, Indonesia.
Ang, B.W., Lee, S.Y., 1994. Decomposition of industrial energy consumption: Some methodological and
Ž .
application issues. Energy Econ. 16 2 , 83]92.
Ang, B.W., Pandiyan, G., 1997. Decomposition of energy induced CO emission in manufacturing.2
Energy Econ. 19, 363]374.
Arrow, K., Bolin, B., Costanza, R. et al., 1995. Economic growth, carrying capacity and environment. Science 268, 520]521.
Bosseboeuf, D., Chateau, B., Lapillonne, B., 1997. Cross-country comparison of energy efficiency
Ž .
indicators: The on-going European effort towards a common methodology. Energy Policy 25 7]9 , 673]682.
Boyd, G.A., Hanson, D.A., Sterner, T., 1988. Decomposition of changes in energy intensity: A
Ž .
Boyd, G.A., McDonald, J.F., Ross, M., Hanson, D.A., 1987. Separating the changing composition of US manufacturing production from energy efficiency improvements: A Divisia index approach. Energy
Ž .
J. 8 2 , 77]96.
Cole, M.A., Rayner, A.J., Bates, J.M., 1997. The environmental Kuznets curve and empirical analysis.
Ž .
Environ. Dev. Econ. 2 4 , 401]416.
Greening, L.A., Davis, W.B., Schipper, L., Khrusch, M., 1997. Comparison of six decomposition methods: application to aggregate energy intensity for manufacturing in ten OECD countries. Energy Econ. 19, 375]390.
Howarth, R.B., Schipper, L., Duerr, P.A., Stross, S., 1991. Manufacturing energy use in eight OECD countries: decomposing the impacts of changes in output, industry structure and energy intensity.
Ž .
Energy Econ. 13 2 , 135]142.
Huang, J., 1993. Industry energy use and structural change: a case study of People’s Republic of China.
Ž .
Energy Econ. 15 2 , 131]135.
IEA, 1993. Energy Statistics and Balance Sheet of OECD countries various issues, International Energy Agency, 1983]1991, IEA, Paris.
Landwehr, M., Jochem E., 1997. From primary to final energy consumption: Analysis of efficiency
Ž .
changes on the energy supply side. Energy Policy 25 7]9 , 693]702.
Li, J.-W., Shreshtha, R.M., Foell, W.K., 1990. Structural change and energy use: The case study of the manufacturing sector in Taiwan. Energy Econ., 109]115.
Lin, S.J, Chang, T.C., 1996. Decomposition of SO , NO , and CO emissions from energy use of major2 x 2 Ž .
economic sectors in Taiwan. Energy J. 70 1 , 1]17.
Moomaw, W.R., Unruh, G.C., 1997. Are environmental Kuznets curves misleading us? The case of CO2
emissions. Environ. Dev. Econ. 2, 451]463.
Murthy, N.S., Panda, M., Parikh, J., 1997. Economic development, poverty reduction and carbon emissions in India. Energy Econ. 19, 327]354.
Parikh, J., 1997. What is India doing to minimize GHG emissions: policies, programs and institutions, Paper presented at ‘North]South Dialog on Climate Change’, Bangladesh Centre for Advanced Studies, 9]10 November 1997.
Rao, R.D., Parikh, J., 1996. Forecast and analysis of demand for petroleum products in India. Energy
Ž .
Policy 24 6 , 583]592.
Reid, W.V., Goldemberg, J., 1998. Developing countries are combating climate change: actions in
Ž .
developing countries that slow growth in carbon emissions. Energy Policy 26 3 , 233]237. Schipper, L., Ting, M., Khrusch, M., Golove, W., 1997. The evolution of carbon dioxide emissions from
Ž .
energy use in industrialized countries: an end use analysis. Energy Policy 25 7]9 , 651]672. Sengupta, R., 1997. Energy and development: some macroeconomic constraints for energy planning in
Ž .
India. In: Bose, A. Ed. , Issues in Economic Theory and Public Policy: Essays in Honour of Prof. Tapas Majumdar. Oxford University Press, Delhi.
Shreshtha, R.M., Timilsina, G.R., 1996. Factors affecting CO intensities of power sector in Asia: A2
Divisia decomposition analysis. Energy Econ. 18, 283]293
Shreshtha, R.M., Timilsina, G.R., 1997. SO emission intensities of the power sector in Asia: Effects of2
generation mix and fuel intensity changes. Energy Econ. 19, 355]362.
Shreshtha, R.M., Timilsina, G.R., 1998. A Divisia decomposition analysis of NO emission intensities forx
Ž .
the power sector in Thailand and South Korea. Energy, 23 6 , 433]438.
Srivastava, L., 1997. Energy and CO emissions in India: increasing trends and alarming portents..2 Ž .
Energy Policy 25 11 , 941]949.