bChair of Geoinformatics, Technische Universit¨at M¨unchen, 80333 M¨unchen, Germany - [email protected]
Commission VI, WG VI/4
KEY WORDS:High resolution SAR, SAR simulation, GIS, CityGML, Interpretation, TerraSAR-X, Urban Areas
ABSTRACT:
Motivated by the distinct appearance of facades in high resolution SAR images with respect to signal incidence angles and polarizations, this paper introduces a way to fuse SAR imagery and 3D GIS (geoinformation system) data (format: CityGML) based on SAR simulation methods. To this end, the known building geometry is used to simulate the extent of building layover for identifying the related image parts in high resolution TerraSAR-X images. The simulated SAR images are generated and geocoded by an automated processing chain which is initialized by the automated parsing of the CityGML dataset and the TerraSAR-X orbit file. Confirming the functionality of the developed interface between simulation and CityGML, first results are presented for an urban scene in the Munich city center in order to discuss future opportunities in the context of change detection applications.
1. INTRODUCTION
High resolution SAR images are of special interest if rapid re-sponse is necessary in urgent situations such as flooding or earth quakes. In this context, the reason is not only related to the avail-ability of imagery due to the independence on weather or day-time. What is more, SAR images contain important information which is complementary to other sensor data. As an example, the imaging concept of SAR favors the salient appearance of facade structures in so-called layover areas which are hardly visible to optical satellite sensors.
For identifying the status or change of urban objects, the main dif-ficulty is related to the identification of layover areas correspond-ing to individual buildcorrespond-ings or even individual facades. A look to the literature reveals that possible concepts may be based on the integration of known object geometry from LiDAR data (Tao et al., 2014) but also on the analysis of interferometric SAR data (Thiele et al., 2013) or SAR image amplitudes (Ferro et al., 2013). In that regard, the identification of layover parts is either limited by the included scene model (density of LiDAR point cloud or spacing of DSM) or the layover property in the SAR data (promi-nent appearance of signatures, speckle, and coherence). How-ever, the extraction of building layover offers new opportunities as an object-based analysis can be pursued for equal or changing imaging perspectives. Besides basic measures of building lay-over (e.g. areal features or intensity distributions), methods for characterizing linear signatures (Simonetto et al., 2005, Wegner et al., 2010) or point-like signatures may be applied in this con-text (Soergel et al., 2006, Michaelsen et al., 2006, Auer et al., 2015).
This paper addresses two main aspects related to the distinct anal-ysis of buildings in high resolution SAR images. First, the typi-cal appearance of facade layover in high resolution SAR images is exemplified and discussed with respect to different signal inci-dence angles and polarizations (Section II), giving an impression on information contained in the related image signatures. In this context, the extraction of building layover in SAR images is mo-tivated. Serving this need, a simulation method based on (Tao
∗Corresponding author.
et al., 2014) is reported in the second part of the paper. Build-ing layover parts are identified in the SAR image based on the integration of prior knowledge given by a CityGML dataset. To the knowledge of the authors, the development of an interface between CityGML and SAR data in a framework of absolute co-ordinates is presented for the first time (Section III). Simulation results of a case study are shown in Section IV followed by a discussion in Section V in order to indicate the potential of the CityGML data in the context of change detection. Section VI concludes the paper and provides an outlook to future work.
2. FACADE LAYOVER - PROPERTIES AND POTENTIALS
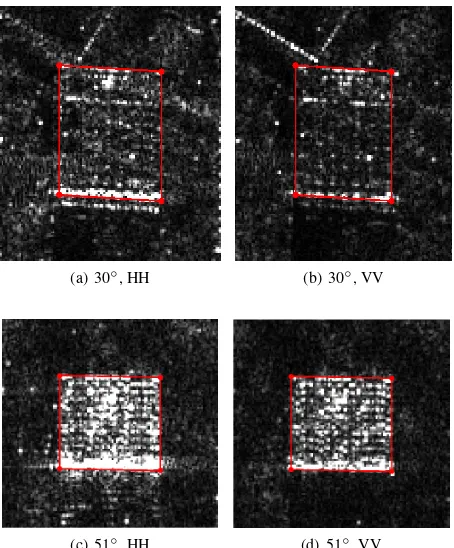
dis-(a) 30◦, HH (b) 30◦, VV
(c) 51◦, HH (d) 51◦, VV
Figure 1. Facade at Hansaviertel, Berlin. Extracted facade lay-over areas indicated by red frames. HH: signal emitted and de-tected in horizontal plane. VV: signal emitted and dede-tected in vertical plane. Time difference between HH and VV data takes: 11 days.
tribution as an approximate function for urban areas (Oliver and Quegan, 2004). For each building, the intensities are clipped at the same level for HH and VV and visualized in 8-bit gray values. The analysis of the distributions is conducted with the full range of intensities.
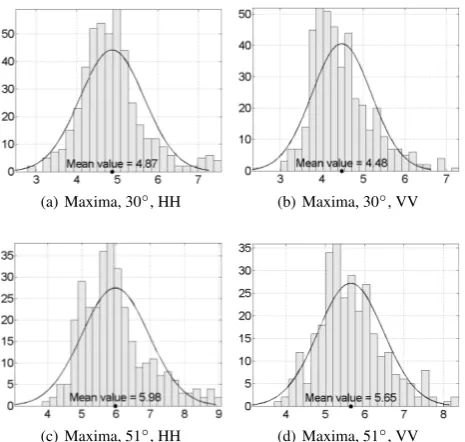
The first example is related to a facade of a residential building, located in the Hansaviertel, which is covered with columns of windows at the outer ends and columns of balconies in the cen-ter. Despite the balconies, the corner reflectors (windows, doors) are located on a plane and mostly part of a uniform grid. The facade is only little rotated with respect to the line-of-flight of TerraSAR-X. Fig. 1 shows the corresponding layover areas for two incidence angles and two polarizations. Visually, the regular-ity of the facade structure is not present for the incidence angle of 30◦and barely distinguishable for 51◦. Intensities in HH seem to dominate those in VV. In particular, the corner line at the bottom end of the layover is more prominent in HH. The visual impres-sion is confirmed by the intensity distribution (Fig. 2) and char-acteristic numbers (see columns 1-3 in Table 1) where the mean and median intensity is higher in HH. The standard deviation is higher in HH as well, meeting the visual perception of speckle in the images. Considering all layover pixels, the assumption of log-likelihood distributions fits well to the data with except of the histogram peaks (Fig. 2). Considering only local max-ima of strong intensity, which are presumably related to corner reflections, the assumption only holds as a rough approximation (Fig. 3). Accordingly, the distributions may be used for identify-ing strong outliers in intensity, e.g., dominatidentify-ing but isolated point targets outside a grid of uniform corner reflectors. Comparable to the selection of all layover pixels, the mean intensities, me-dian intensities and standard deviations of the local maxima are higher in HH (see columns 3-6 in Table 1). Counting the number of prominent local maxima - with intensities higher than the mean
(a) Layover, 30◦, HH (b) Layover, 30◦, VV
(c) Layover, 51◦, HH (d) Layover, 51◦, VV
Figure 2. Hansaviertel, intensity distribution of layover pixels for different polarizations and incidence angles.
layover intensity - reveals no trend (see last column in Table 1).
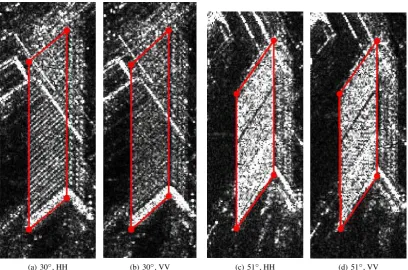
The second example relates to a skyscraper at the Alexanderplatz which is rotated with respect to the line-of-flight of TerraSAR-X. Covered by a combination of regularly arranged metallic struc-tures and glass, the four data takes (combination of two incidence angles and two polarizations) reveal different appearances of the facade layover area (see Fig. 4). For the incidence angle of 51◦, the visual perception of the HH and VV images is similar. In contrast, a signature pattern is distinguishable in the HH image for 30◦(linear arrangement of point signatures for each floor) which is not present in the VV image. The intensities of corner lines at the bottom ends of the layovers to be comparable.
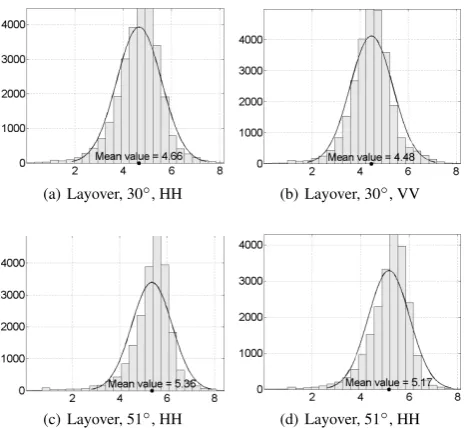
As shown in Fig. 5, the intensity distribution of layover pixels can be described by a log-normal distribution for 30◦. The lay-over pixels pertinent to the incidence angle of 51◦, however, only roughly follow this assumption. Comparable to the Hansaviertel building, the mean and median intensities are higher in HH (see columns 1-3 in Table 1). The standard deviations are comparable for both angles. Considering only local maxima in the layover, the log-normal distribution can be used as a rough approximation (Fig. 6). Again, intensities in HH are dominant compared to VV (mean and median intensity), whereas the standard deviations are comparable (see columns 4-6 in Table 1). As for the residential building above, the comparison of HH and VV indicates no trend on the number of dominant point targets which represent struc-tural elements at the skyscraper facade (last column in Table 1).
Considering also results of other facades not reported in the pa-per, the following conclusions can be drawn at this point:
(a) Maxima, 30◦, HH (b) Maxima, 30◦, VV
(c) Maxima, 51◦, HH (d) Maxima, 51◦, VV
Figure 3. Hansaviertel, intensity distribution of maxima for dif-ferent polarizations and incidence angles.
trihedral (corner reflector) can be shown by a simple sim-ulation experiment where two surfaces are made of metal with little signal loss and one surface of glass containing a silver compound for light protection (comparable to a win-dow on a building facade). In this context, the reflection components of the glass and silver compound (located at the interior glass surface) are summed to derive the final signal strength. For the sake of simplicity, signal refraction and attenuation in the glass surface are neglected. The amount of light protection is steered by a weight factor, represent-ing the percentage of glass surface covered by silver. For all signals leaving the corner reflector, the reflection factors for HH are always higher than for VV (see different cases sum-marized in Table 2), independently of the amount of light protection.
• The intensity variation in HH tends to be stronger than or equal to VV. As expected, the intensity level of the layover increases with the incidence angle as more signal contribu-tions are condensed in one range resolution cell.
• The log-normal distribution is applicable as a rough repre-sentation of layover pixels. This extends the assumption of (Oliver and Quegan, 2004) where the log-normal distribu-tion is generally related to urban clutter. The analysis in this paper indicates that this assumption is applicable to in-dividual facades as well with dominant signatures related to structural details. Considering local maxima only, the as-sumption can be used to identify strong outliers in intensity. However, the applicability of the log-normal distribution is moderate for strongly rotated facades and facades with a low number of local maxima (low number of entries in the his-togram).
• No general trend has been identified in the number of dom-inant pixels in building layover (HH vs. VV). Hence, the higher number of salient point targets in HH stacks (see (Gernhardt and Bamler, 2012)) is not confirmed for single SAR images.
• The appearance of facade regularities in the SAR image not only depends on the geometry (object structure and rotation; imaging perspective) but also on the signal polarization (see
As shown above, the appearance of facades in SAR images can be manifold. Nonetheless, distinct layover properties can be ana-lyzed for individual buildings or facades, given the layover extent. To this end, however, the facade layover has to be identified and extracted beforehand in the SAR image. Following this objective, the remainder of this paper extends a simulation method reported in (Tao et al., 2014) by implementing an interface to the GIS stan-dard CityGML as an external data source. The building geometry defined in the CityGML dataset is used as prior knowledge to di-rectly simulate the extent of building layover in the SAR image plane.
3. SAR SIMULATION FOR BUILDING IDENTIFICATION
3.1 Processing Chain for SAR Simulation
CityGML data and TerraSAR-X data are fused in the framework of a SAR simulator named RaySAR (Auer, 2011). Extended to an automated processing chain for simulating geocoded data named GeoRaySAR, the resulting images can be directly super-posed to the TerraSAR-X data in order to identify buildings of interest (Tao et al., 2014). So far, the processing chain has been adapted to import geometric information from LiDAR data and digital surface models (DSMs). In this paper, first steps are re-ported to open the processing chain for GIS data.
The core of the simulator is based on an extended version of the open-source ray tracer POV-Ray. Concentrating on the geomet-ric part (while using simplified radiometgeomet-ric parameters), artificial signals (rays) are followed a virtual urban scene in order to detect signal reflections of different reflection levels. In that regard, re-flection levels 1-3 are of special interest for 2.5D object models, whereas higher reflection levels are of use for analyzing the im-pact of detailed facade structures. The geometric component is based on a scene model in absolute coordinates and the orbit pa-rameters defining the point-of-view with respect to the scene (in-cidence angle, rotation angle of buildings). To this end, the scene geometry is parsed into a language interpretable by the SAR sim-ulator (POV-Ray model format; processed in C++ code). Details on the potentials and limitations of the SAR simulation method can be found in (Auer, 2011).
3.2 CityGML-Data as Data Source
CityGML (City Geography Markup Language) is an international data standard for geoinformation systems (GIS) which has been defined by the Open Geospatial Consortium (OGC) (Groeger et al., 2012). CityGML defines an object-oriented, application neu-tral information model for 3D city and landscape models. Using CityGML, real world entities such as buildings, roads and water bodies are modeled with respect to their geometric and semantic properties as well as with their appearance in five discrete levels of detail (LOD). In addition to the information model which is de-scribed by a UML class diagram, the CityGML standard defines an XML-based data encoding.
(a) 30◦, HH (b) 30◦, VV (c) 51◦, HH (d) 51◦, VV
Figure 4. Facade at Alexanderplatz, Berlin. Extracted facade layover areas indicated by red frames. Time difference between HH and VV data takes: 11 days.
Building / data take Mean (LO)
Median (LO)
Std. Dev. (LO)
Mean (Max)
Median (Max)
Std. Dev. (Max)
No. Max.
Hansaviertel, HH, 30◦ 4.06 4.07 1.01 4.87 4.81 0.79 409
Hansaviertel, VV, 30◦ 3.67 3.69 0.95 4.48 4.32 0.72 359
Hansaviertel, HH, 51◦ 5.13 5.08 1.16 5.98 5.83 0.98 256
Hansaviertel, VV, 51◦ 4.70 4.70 1.06 5.65 5.55 0.83 272
Alexanderplatz, HH, 30◦ 4.66 4.72 0.92 5.46 5.48 0.66 783
Alexanderplatz, VV, 30◦ 4.48 4.51 0.89 5.21 5.12 0.65 872
Alexanderplatz, HH, 51◦ 5.36 5.47 0.85 6.04 6.05 0.57 736
Alexanderplatz, VV, 51◦ 5.17 5.30 0.85 5.92 5.98 0.57 670
Table 1. Summary of layover properties. LO = layover, Max = local maxima, No. Max. = number of maxima with intensity above mean layover intensity.
Cadastral and Surveying Authorities of the L¨ander of the Fed-eral Republic of Germany provide CityGML building objects for the entire territory of Germany (Aringer and Roschlaub, 2013), the INSPIRE directive of the European Union allows EU mem-ber states to encode their data on buildings using the CityGML format (Groeger et al., 2013) and many cities around the World such as Doha, Kuala Lumpur, Yokohama and Zurich are applying CityGML for their 3D city models). Second, the CityGML data structure is adapted to the requirements of building reconstruction using data acquisition techniques (such as SAR) which allow to observe the boundary surfaces of real world objects (Nagel et al., 2009).
A realistic choice is made with respect to the level of detail in the context of SAR applications and with respect to CityGML data availability (LOD-1 and LOD-2). A higher level of detail may be preferable but hardly available. In this paper, LOD-2 is chosen for the simulation case study, roughly representing the geometry of roofs. Compared to geometric information from a DEM, several advantages are of interest in the context of SAR simulation under the assumption of a (geodetic) origin of the data and a thorough maintaining of the GIS data base:
• In contrast to a DSM, semantic objects are stored in a CityGML data set which allows for discriminating e.g. build-ings from their surrounding vegetation.
• The coordinates of the building boundaries are defined as vector (boundary representation) data in 3D and presumably of high accuracy. In case of a DSM, 3D building boundaries have to be extracted from a 2.5D model where facades are not represented by vertical surfaces. As a consequence, the accuracy of the building outline is moderate.
• The building geometry (horizontal position and height) can be consecutively updated, e.g. by surveying campaigns. Up-dating a DSM requires much more effort, limiting the actu-ality of the data.
• The semantic classification of facade and roof parts is al-ready given by the model. Methods for decomposing model parts (as required for the DSM; e.g. (Tao et al., 2014)) are not necessary.
(a) Layover, 30◦, HH (b) Layover, 30◦, VV
(c) Layover, 51◦, HH (d) Layover, 51◦, HH
Figure 5. Alexanderplatz, intensity distribution of layover pixels for different polarizations and incidence angles.
Surface arrangement θi H Pol V Pol
Glas on first or second surface
15◦ 0.28 0.26
Glas on third surface 15◦ 0.72 0.11
Arbitrary 45◦ 0.38 0.17
Glas on first or second surface
80◦ 0.82 0.21
Glas on third surface 80◦ 0.27 0.26
Table 2. Reflection component resulting at two metallic sur-faces and one glass surface coated by 10 percent silver (no signal loss: 1) for different local signal incidence angles (θi)
on first surface. Permittivity parameters assumed for C-Band. Metal:1.0 +j∗3.4∗107, glass: 6.4, silver compound:
1.0 +j∗2.1∗108. Note: High or low local signal incidence
an-gles may occur for strong rotations of the corner with respect to the sensor’s line-of-sight.
links to external information systems. Accordingly, SAR simulation case studies can be concentrated on specific model properties.
One major drawback is related to building walls/roofs if the ge-ometry does not rely on measured data (example: height estimate based on height step multiplied with number of floors). Then, the correctness of the simulated building layover will be representa-tive at the corner line (bottom line of facade; far-range) but only a rough approximate at the other end (near-range).
As a major objective, realizing an interface to CityGML increases the flexibility of the simulation processing chain which was con-centrated on LiDAR data and DEMS so far (necessary to deal with urgent situations). As a next step, findings of the case study may be extended to other formats.
3.3 Simulation based on CityGML
The simulation based on CityGML requires a functional and fully automated interface between CityGML and GeoRaySAR. As a pre-requisite, the interface has to be developed in a way that it can be adapted to other GIS formats and other information models with low effort. Following this idea, the Feature Manipulation
(a) Maxima, 30◦, HH (b) Maxima, 30◦, VV
(c) Maxima, 51◦, HH (d) Maxima, 51◦, VV
Figure 6. Alexanderplatz, intensity distribution of maxima for different polarizations and incidence angles.
Engine (FME) by Safe Software Inc. (http://www.safe.com) has been selected as an appropriate platform for own developments as it is flexible to a high number of different model formats. In more detail, imported model formats are parsed to a uniform model code in FME where model properties can be manipulated based on own strategies (tools: transformers). Note that the developed interface can be integrated into the simulation processing chain reported in (Tao et al., 2014).
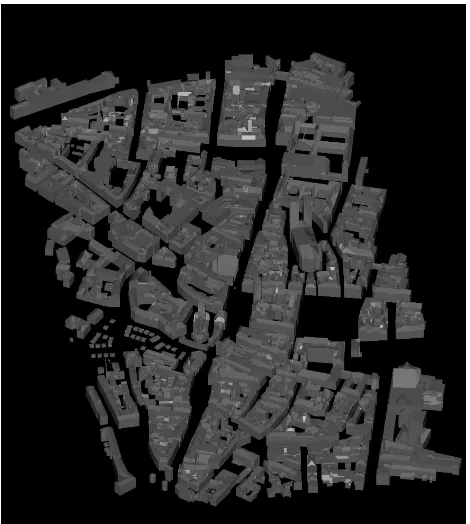
Figure 7. Rendered image of CityGML model, representing the line-of-sight of the virtual SAR sensor.
which are not represented by LOD-1 and LOD-2 models. The re-flection levels of the simulation are restricted to direct backscat-tering and double reflections as these can be directly related to buildings. Reflection levels beyond double reflection are deac-tivated as they are not representative due to missing details on the facade models (facades represented by plane polygons). The simulated SAR images are generated based on a ray tracing pro-cedure (see details in (Auer, 2011)). Thereafter, the geocoding of the images is conducted using the bounding box information of the scene (Tao et al., 2014) (full scene or individual building). In that regard, differences in the height system are considered for avoiding a shift error in range direction. As an example, the dif-ference between the ellipsoidal height and sea level height of the Munich city center is 45.52 m for the case study presented below.
4. SIMULATION CASE STUDY
As an appropriate test site, the Munich city center has been cho-sen where a high resolution TerraSAR-X data set and a CityGML model, derived from 2D building footprints from cadastral land register and photogrammetric measurements, are available. The geocoded TerraSAR-X image, captured in spotlight mode from a descending orbit with an incidence angle of 49.75◦, has a pixel spacing of 0.5 m x 0.5 m. Being of type LOD-2, the CityGML data set includes a rough approximation of the roof geometry. The model coordinates, given in the GK coordinate system, have been transformed to the UTM coordinate system, which is real-ized when translating the geometry to the POV-Ray format. After adding the virtual sensor based on the TerraSAR-X orbit file to the POV-Ray model code, ray tracing is performed for detecting signal reflections on the model surface (diffuse, specular) and a SAR image is simulated whose pixel spacing is adapted to the TerraSAR-X image. As a bi-product, an optical image can be derived as well, indicating the sensor perspective with respect to the urban scene. Fig. 7 shows the rendered scene which is mainly characterized by residential buildings but also contains buildings of large (e.g. Frauenkirche on the center right) and small size
(e.g. Viktualienmarkt on the center left). Foreshortening is dis-tinguishable for some roofs which are hit perpendicular by the radar signal. Nonetheless, diffusely reflected signals are more important as they will represent the extent of building layover in the simulated SAR image, whereas signal contributions related to foreshortening and double reflections will be condensed to lines. Diffuse reflection from the ground is suppressed as the focus is on building layover. In contrast, specular reflections are assigned to ground parts in order to enable the simulation of double reflec-tion lines. Accordingly, with except of the contribureflec-tion to double reflection lines, ground parts are not distinguishable in the simu-lated SAR image.
Fig. 8(a) shows the resulting SAR image where building re-sponses are represented by bright layover areas and partly dou-ble reflection lines. It is seen that the layover extent of large and small buildings shows prominent appearance which enables to define the corresponding layover extent in the azimuth-range plane. Geocoding performs a rotation of the image, consider-ing the angle between the sensor headconsider-ing direction and the north direction. For a visual inspection, the simulated image can be superposed to the TerraSAR-X image as shown in Fig. 8(b) (lay-over marked by red color).
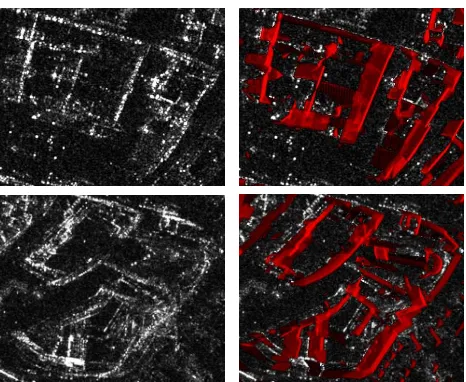
Fig. 9 exemplifies the simulation of large and small urban struc-tures by two examples within the urban scene. The layover cor-responding to facade and roof structures include dominant signa-tures but also parts with little response. However, the simulated image enables to mark the related layover outline. Moreover, it is obvious that some building geometries are not represented by the CityGML model due to errors in data acquisition and modeling. This can also be seen in Fig. 8(b) where some newly constructed building blocks are missing in the simulation result (bright lay-over without red clay-over). For a distinct analysis of the buildings in the TerraSAR-X image, image parts related to building layover may be extracted based on an intensity threshold, following the concept reported in (Tao et al., 2014).
5. POTENTIALS AND CHALLENGES OF CITYGML IN THE CONTEXT OF CHANGE DETECTION
Simulations of the full scene enable to provide an overview of the scene in order to identify image parts related to building facades. Layover parts can be extracted in two SAR images in order to an-alyze changes of the pertinent intensity distributions or prominent features. Beyond this level, CityGML data provides additional opportunities compared to the use of digital surface models.
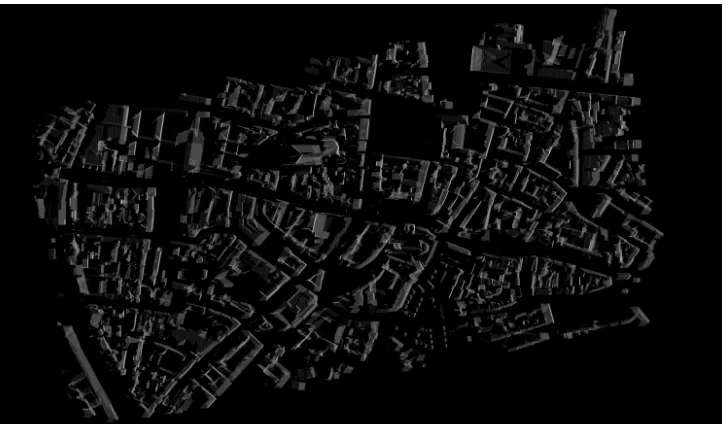
(a) Simulated reflectivity map with pixel spacing adapted to TerraSAR-X image (0.5 m x 0.5 m). Included reflec-tion levels: direct backscattering and double reflecreflec-tion.
(b) Reflectivity map superposed on geocoded spotlight TerraSAR-X image.
Figure 8. Simulation result based on CityGML model.
continuously with limited effort (based on dedicated field sur-veys) whereas updates of DSMs commonly depend on new flight campaigns based on optical sensors or laser scanning. More-over, individual city objects can be filtered by the transaction time of the data (CityGML attributes ”creationDate” and ”ter-minationDate”). Thereby, the varying actuality of the geometric and semantic information can be considered. Finally, buildings can be filtered by considering the valid time (CityGML attributes ”yearOfConstruction” and ”yearOfDemolition”) in order to adapt the comparability to the SAR data. As a drawback, though, the accuracy of building heights in the CityGML may be moderate, e.g., due to height estimates.
As CityGML not only allows for representing objects in several levels of detail but also for geometrically representing objects in a number of ways (e.g. an LOD2-Building may be represented by a single Solid geometry as well as by several MultiSurface ge-ometries and its outer shell may or may not be decomposed in semantic boundary surface objects), the transformation process has to account for all these variations and can therefore become
rather complex. With regard to the thematic information con-tained in a CityGML data set, on the one hand the transformation process should be able to exploit all the thematic information, e.g. for filtering the data as described above. As most of the thematic attributes of the CityGML information model are optional, the transformation process on the other hand, should be able to pro-vide valuable input to the SAR simulation even if the thematic information is not available.
6. CONCLUSION AND OUTLOOK
Figure 9. Close-up view on building blocks.
HH dominates VV in intensity (mean, median) but also tends to show stronger intensity variation (standard deviation). In con-trast, no tendency with respect to the proportion between HH and VV is observed on the number of prominent point signatures. As a conclusion, distribution-based methods for layover analysis seem to be favored which may be optionally supported by feature-based concepts, e.g., focused on lines or point-like signatures.
The prominent appearance of facade layover motivates the identi-fication of the related SAR image parts in order to extract building-related information. In this context, a concept has been proposed for identifying building layover based on simulation methods in-cluding CityGML data. To this end, a simulation processing chain has been extended to fuse TerraSAR-X images and prior information provided by CityGML data sets. In this context, the data transformation from CityGML to the POV-Ray data struc-ture used by the simulator is fully automated using the spatial ETL (extract, transform, and load) software FME. As a first ex-ample, a case study of the Munich city center has been shown where the extent of simulated building layover is directly super-posed on a geocoded TerraSAR-X image. The simulation concept based on CityGML data indicates that the representation of real world entities by semantic objects has a number of advantages over the purely geometric representation in a DSM. In particular, change detection applications may benefit from CityGML data sets if they are kept up to date and assigned with meta informa-tion.
Future work will be related to enhancements of the interface be-tween simulation and GIS data. Different levels of detail (LODs) and model formats will have to be tested for their use and inter-faces. The simulation results of the case studies are related to the full scene model. As a next step, the analysis will be continued on the level of individual buildings and facades.
7. ACKNOWLEDGEMENTS
The authors want to thank Isabel Hornig and Martin P¨ultz for their support in the layover analysis and CityGML integration, re-spectively. The work was partly funded by the Deutsche Forschungs-gemeinschaft (DFG), project VHR-SAR (BA 2033/3-1).
REFERENCES
Aringer, K. and Roschlaub, R., 2013. Calculation and update of a 3D building model of bacaria using LiDAR, image matching and
catastre information. In: Int. Arch. Photogramm. Remote Sens., Vol. II-2/W1.
Auer, S., 2011. 3D Synthetic Aperture Radar Simulation for Interpreting Complex Urban Reflection Scenarios. PhD thesis, Deutsche Geod¨atische Kommission, Reihe C, Nr. 660, Verlag der Bayerischen Akademie der Wissenschaften, 126 p.
Auer, S., Gisinger, C. and Tao, J., 2015. Characterization of fa-cade regularities in high-resolution SAR images. IEEE Trans. Geosci. Remote Sens. 53(5), pp. 2727–2737.
Ferro, A., Brunner, D. and Bruzzone, L., 2013. Automatic detec-tion and reconstrucdetec-tion of building radar footprints from single VHR SAR images. IEEE Trans. Geosci. Remote Sens. 51(2), pp. 935 – 952.
Gernhardt, S. and Bamler, R., 2012. Deformation monitoring of single buildings using meter-resolution SAR data in PSI. ISPRS J. Photogramm. Remote Sens. 73, pp. 68–79.
Groeger, G., Kolbe, T. H., Nagel, C. and Haefele, K.-H., 2012. OGC City Geography Markup Language (CityGML) Encoding Standard, v2.0. OGC Doc. No. 12-019. Open Geospatial Consor-tium.
Groeger, G., Kutzner, T. and Kolbe, T. H., 2013. A CityGML-based encoding for the INSPIRE data specification on buildings. In: INSPIRE 2013: The Green Renaissance.
Michaelsen, E., Soergel, U. and Thoennessen, U., 2006. Percep-tual grouping for automatic detection of man-made structures in high-resolution SAR data. Pattern Recogn. Lett. 27(4), pp. 218– 225.
Nagel, C., Stadler, A. and Kolbe, T. H., 2009. Conceptual re-quirements for the automatic reconstruction of building informa-tion models from uninterpreted 3D models. In: Int. Arch. Pho-togramm. Remote Sens., Vol. Vol. 34, Part XXX.
Oliver, C. and Quegan, S., 2004. Understanding Synthetic Aper-ture Images. SciTech Publishing, Inc.
Simonetto, E., Oriot, H. and Garello, R., 2005. Rectangu-lar building extraction from stereoscopic airborne radar images. IEEE Trans. Geosci. Remote Sens. 43(10), pp. 2386–2395.
Soergel, U., Thoennessen, U., Brenner, A. and Stilla, U., 2006. High-resolution SAR data: new opportunities and challenges for the analysis of urban areas. IEE Proceedings - Radar, Sonar and Navigation 153(3), pp. 294–300.
Tao, J., Auer, S., Palubinskas, G., Reinartz, P. and Bamler, R., 2014. Automatic SAR simulation technique for object identifica-tion in complex urban scenarios. IEEE J. Sel. Topics Appl. Earth Observ. 7(3), pp. 994–1003.
Tao, J., Auer, S., Reinartz, P. and Bamler, R., 2013. Object-based change detection for individual buildings in SAR images captured with different incidence angles. In: Proceedings of IGARSS.
Thiele, A., Wurth, M., Even, M. and Hinz, S., 2013. Extrac-tion of building shape from TanDEM-X data. In: Int. Arch. Pho-togramm. Remote Sens., Vol. XL-1/W1.