MAPPING URBAN TREE CANOPY COVER USING
FUSED AIRBORNE LIDAR AND SATELLITE IMAGERY DATA
Ebadat G. Parmehr a,*, Marco Amati a, Clive S. Fraser b
a Centre for Urban Research, School of Global, Urban and Social Studies, RMIT University, VIC 3001, Australia- (ebadat.parmehr, marco.amati)@rmit.edu.au
b Department of Infrastructure Engineering, University of Melbourne, VIC 3010, Australia- [email protected]
Commission VII, WG VII/6
KEY WORDS: Tree Canopy Cover, Airborne LiDAR, Imagery Data, NDVI, Data Fusion
ABSTRACT:
Urban green spaces, particularly urban trees, play a key role in enhancing the liveability of cities. The availability of accurate and up-to-date maps of tree canopy cover is important for sustainable development of urban green spaces. LiDAR point clouds are widely used for the mapping of buildings and trees, and several LiDAR point cloud classification techniques have been proposed for automatic mapping. However, the effectiveness of point cloud classification techniques for automated tree extraction from LiDAR data can be impacted to the point of failure by the complexity of tree canopy shapes in urban areas. Multispectral imagery, which provides complementary information to LiDAR data, can improve point cloud classification quality. This paper proposes a reliable method for the extraction of tree canopy cover from fused LiDAR point cloud and multispectral satellite imagery data. The proposed method initially associates each LiDAR point with spectral information from the co-registered satellite imagery data. It calculates the normalised difference vegetation index (NDVI) value for each LiDAR point and corrects tree points which have been misclassified as buildings. Then, region growing of tree points, taking the NDVI value into account, is applied. Finally, the LiDAR points classified as tree points are utilised to generate a canopy cover map. The performance of the proposed tree canopy cover mapping method is experimentally evaluated on a data set of airborne LiDAR and WorldView 2 imagery covering a suburb in Melbourne, Australia.
* Corresponding author.
1. INTRODUCTION
Accurate and up-to-date maps of urban tree cover are required for many applications such as planning, green space management and improvement of liveability within cities. The automated production of tree cover maps from available remotely sensed imagery and ranging data remains a research topic of interest.
Multispectral satellite/aerial images and airborne LiDAR (Light Detection And Ranging), provide sets of complementary spatial data. For instance, multispectral satellite imagery offers low-cost spectral data for vegetation classification over large areas, while LiDAR data provides accurate 3D point clouds with recorded intensity values of the reflected laser beam. The integration of satellite imagery with LiDAR point clouds, registered to 1-pixel level, offers an enriched data source for scene classification.
LiDAR point clouds are used for many forestry applications such as the estimation of forest inventory, measurement of tree canopy profile, estimation of leaf area index, etc. (Koch et al., 2006; Kwak et al., 2007; Li et al., 2012; Maltamo et al., 2014; Rutledge and Popescu, 2006). The performance of tree canopy cover mapping using LiDAR data and WorldView 2 imagery data separately has previously been analysed and it was shown that superior results were achieved using LiDAR data (Jakubowski et al., 2013). Nevertheless, algorithms designed for the extraction of trees, from LiDAR data, can fail in urban areas due to the presence of man-made objects, principally buildings.
There are a number of classification techniques that have been applied in the extraction of man-made and natural features from LiDAR data. For instance, the random forest classification method has been used to extract buildings, trees and power lines (Guan et al., 2013; Kim et al., 2010). Support vector machine-based classification methods have also been applied for the extraction of buildings and trees (Lodha et al., 2006; Secord and Zakhor, 2007; Zhang et al., 2013). Moreover, principal component analysis (PCA) has been used for 3D shape analysis to identify planar and non-planar surfaces in LiDAR point clouds, in order to identify buildings and trees (Carlberg et al., 2009; Lalonde et al., 2006).
While these approaches offer a variety of solutions, a universal challenge is that buildings and trees can appear geometrically similar, which complicates their extraction from LiDAR data. The combination of LiDAR data and multispectral imagery, which brings the benefits of geometric and radiometric data attributes, has been employed for the extraction of buildings (Awrangjeb et al., 2010; Rottensteiner et al., 2003; Teo and Chen, 2004). Also, fusion of LiDAR and multispectral images, via the Dempster-Shafer algorithm, has been utilised to detect buildings in LiDAR data. This improved the correctness of the LiDAR point cloud classification process for small residential buildings by up to 20% (Rottensteiner et al., 2007). In applications focussing on building extraction, an aim of the LiDAR point cloud processing is generally to remove trees. However, the separation of buildings and tree points can be
Tree canopy cover map
complicated, especially when trees are close to buildings, potentially with the canopy partially overhanging the building.
Approaches exploiting the complementary nature of multispectral imagery and LiDAR data for the extraction of both buildings and trees in urban areas have also been reported. For example, object-based classification of fused LiDAR data and aerial orthoimagery has been adopted for urban thematic mapping (Guan et al., 2013), and the extracted vegetation mask from the aerial imagery has been utilised to differentiate trees from buildings in LiDAR data (Bandyopadhyay et al., 2013). Demir and Baltsavias (2010) utilised four different methods for the extraction of trees and buildings using aerial images and LiDAR data. While building and tree extraction from fused imagery and LiDAR data has yielded improved classification performance, the process still suffers somewhat from the lack of a full incorporation of spectral information. Importantly, the performance using fused data is dependent upon the quality of the co-registration of the imagery and the LiDAR point cloud.
As distinct from the method proposed in this paper, the approaches referred to above neither fully address the data misalignment problem nor use fused multispectral image data in the point cloud processing procedure. The process proposed here centres upon a fusion of multispectral image and LiDAR point cloud data to improve point cloud classification quality, and consequently to produce tree canopy cover maps. It will be illustrated through the example of using co-registered WorldView 2 multispectral imagery and LiDAR data covering an urban area to improve the quality of LiDAR classification for tree canopy cover mapping.
The paper is organised as follows: Section 2 presents the proposed method for tree canopy cover mapping. The performance of the proposed method is then experimentally evaluated and discussed in Section 3, and conclusions follow in Section 4.
2. METHOD
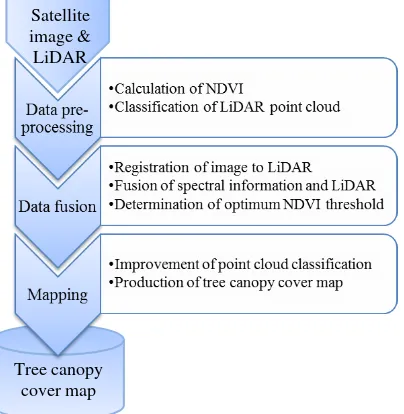
The flow chart shown in Figure 1 presents the proposed method for tree canopy cover mapping. It includes three main components, namely: data pre-processing, data fusion and mapping.
Figure 1. Flowchart of tree canopy cover mapping process.
2.1 Data Pre-processing
2.1.1 Calculation of NDVI: Multispectral imagery (4 bands of red, green, blue and infrared) can be utilised for the extraction of vegetation. The normalised difference vegetation index (NDVI) as a vegetation measure is defined as:
. respectively. NDVI is used for differentiating the vegetation from green man-made objects. Since NDVI calculates the normalised difference between the infrared and red bands, it is able to compensate the shadow effect of the image.
2.1.2 Classification of LiDAR point cloud: LiDAR point cloud classification into ground and non-ground points is required to generate a digital elevation model (DEM) from the LiDAR data. Various reliable methods for separating ground points from non-ground points have been proposed (eg Kobler et al., 2007; Kraus and Pfeifer, 1998), and are commonly available through commercial software tools.
However, classification of non-ground LiDAR points into different classes such as buildings and trees is still a challenging task. Geometric characteristics of LiDAR points, such as planar and non-planar facets, have been widely used to classify LiDAR point clouds. In this method, planar and non-planar objects relate to buildings and trees, respectively, and surface variation is measured by using principle component analysis (PCA) of the surface points (Hoppe et al., 1992; Lalonde et al., 2006). The planarity of k-nearest neighbour points xi around a point x0 can
be defined via the covariance matrix of points. The symmetric and positive semi-definite covariance matrix is given as
surface normal of xi. A scale-invariant surface variation of the k
-nearest neighbours is given by:
2 (close to zero) for a planar surface because in the planar surface
λ0<<(λ1 ≈ λ2). Non-planar surfaces, on the other hand, yield extraction, it may lead to misclassification of tree points due to the modifications of tree canopies in urban areas. For example, trimming tree canopies due to the overlap with power lines modifies tree canopy shape and causes appearance of planar Satellite
image & LiDAR
surfaces in the tree canopies. This invokes the assumption of LiDAR classification criteria that trees have non-planar surfaces. Also, large tree canopies may have small planar surfaces that can be classified as buildings.
2.2 Data Fusion
2.3.1 Registration of image to LiDAR: In integration of the LiDAR point cloud with imagery, a one-to-one correspondence of LiDAR points and image pixels is required. To establish this correspondence between LiDAR and imagery data, geometric alignment of the data set is necessary and any small displacement between the data set significantly decreases the quality of integration.
Although multi-sensor data may be georeferenced, residual misalignment errors are often present and these errors need to be removed through a registration procedure. In order to co-register imagery to the LiDAR point cloud with sub-pixel accuracy, an intensity-based method using local mutual information, proposed by Parmehr et al., (2013), is adopted. To estimate the transformation between the satellite image and 3D LiDAR point cloud, 3D affine transformation was utilised (Yamakawa and Fraser, 2004). It is able to model the parallel projection of satellite imagery and therefore removes the image perspective errors in the registered image.
2.3.2 Fusion of spectral information and LiDAR data: Registration of imagery to LiDAR data facilitates enrichment of the LiDAR point cloud with spectral information. Therefore, every LiDAR point acquires RGB and NDVI values in addition to its original information in a process known as point cloud colourising. Also, a true orthorectified image can be produced using registered imagery and LiDAR data.
Data fusion techniques are mainly adopted for data sets in raster format. Rasterising the LiDAR point cloud yields the appearance of artefacts. Here, point-based data fusion is adopted to maintain the integrity of the point cloud data structure for the further processing.
2.3.3 Determination of optimum NDVI threshold: In order to utilise fused NDVI and the LiDAR point cloud for the separation of trees from buildings, NDVI values need to be classified into 0 and 1 for buildings and trees, respectively. The quality of classification of NDVI for tree and building points is highly dependent on the NDVI threshold value.
In this paper, an automatic threshold selection method proposed by Otsu (1979) is deployed because of its performance in bimodal data (tree and building classes) clustering, and therefore, atmospheric pre-processing of multi-spectral image is not required. This method tries to maximise the discrimination of tree and building classes using the histogram of NDVI values. As a result, classified NDVI values with minimum standard deviations in each class can be calculated and these are used to improve LiDAR point cloud classification.
2.3 Mapping
2.3.1 Improvement of point cloud classification: PCA-based LiDAR point cloud classification, the most popular LiDAR data classification method, may fail in the separation of trees and buildings due to possible planar surfaces within the tree canopies. For example, tree points can be classified as building points. Therefore, the fused NDVI values with LiDAR points
are employed to improve the classification. Building points with high value of NDVI can be considered as tree points. In spite of high accuracy in the registration of the two data sets, NDVI is unlikely to be 100% reliable in separating trees from buildings. That is, NDVI suffers from both the existence of noise in the imagery data and the residual errors from the estimation of sensor perspective model parameters in the registration procedure.
Algorithm 1. The use of NDVI in LiDAR classification.
Input: Classified LiDAR using only LiDAR data
Output: Improved LiDAR classification using integrated NDVI cover map from LiDAR tree points is highly impacted by gaps in the LiDAR point cloud. This is more challenging if the density of the point cloud is low. Here, point-based and raster-based closing morphological operators are applied to fill the gaps among the LiDAR tree points. The point-based method takes k-nearest neighbour points and applies morphological closing operator to remove the gaps. While the raster-based method needs conversion of discrete LiDAR points into raster form, which can yield the appearance of artefacts. As a result, the point-based morphological closing operator is able to provide more accurate tree canopy cover rather than the conventional raster-based morphological closing operator.
After removing gaps in LiDAR tree points, nearest neighbour interpolation is utilised to create a raster tree canopy cover map. Finally, this map is converted to a vector canopy cover map which can be used in GIS software for various applications.
3. EXPERIMENTAL RESULTS AND DISCUSSIONS
3.1 Data Set
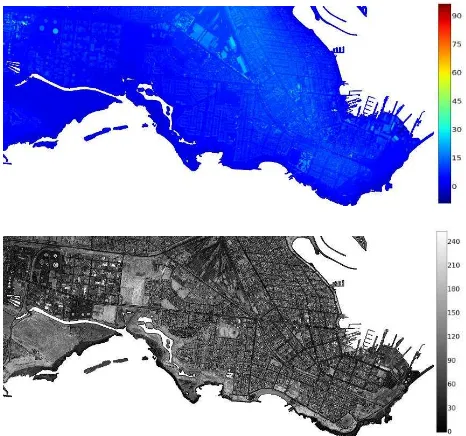
The data set covered a 3 x 6 km area of Williamstown in Melbourne, Australia. It comprised a WorldView 2 satellite image with 50 cm ground sample distance (GSD), which was captured in 2011. The corresponding LiDAR point cloud of 1-2 pts/m2 point density, along with corresponding intensity data, was acquired in 2009. The pan-sharpened true-colour satellite image is shown in Figure 2 along with the NDVI image. The corresponding LiDAR DSM and intensity image are shown in Figure 3.
Figure 2. True colour satellite image (top) and NDVI image (bottom).
Figure 3. Colour-coded LiDAR DSM (top) and LiDAR intensity image (bottom).
3.2 Results and Discussion
3.2.1 Data fusion: Accurate co-registration of the data sets is necessary for data fusion. An intensity-based registration method using local mutual information employing 8 well-distributed templates was adopted to register the WorldView 2 image to the LiDAR point cloud. To estimate the accuracy of the registration, the standard error of unit weight, 0, of the least-squares adjustment was used and a 0 value of 1 pixel was achieved for the registration. The orthorectified satellite image is shown in Figure 4. A small portion of the colourised LiDAR point cloud with co-registered colour and NDVI images is shown in Figure 5, which indicates the accuracy of the registration. As seen in the figure, LiDAR points of vegetation including trees and grass have higher values of NDVI. These are presented in light grey whereas buildings, with low NDVI values, are presented in dark grey.
Figure 4. Orthorectified satellite image.
Figure 5. Colourised LiDAR points with colour (top) and NDVI images (bottom) for a small area.
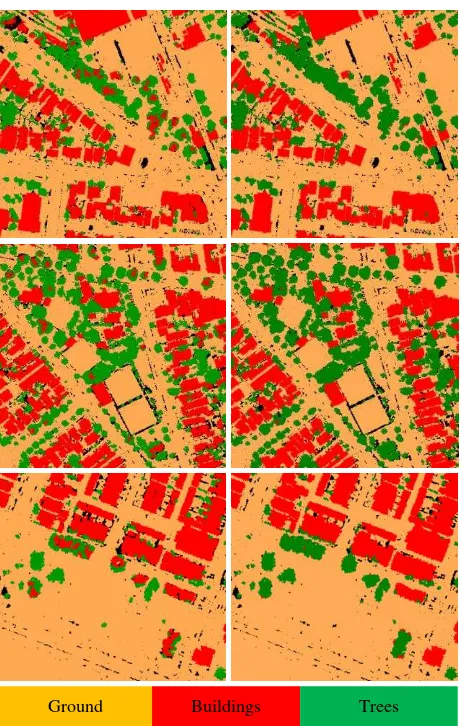
3.2.2 Mapping: The NDVI values associated with the LiDAR points are employed in the classification process as additional information. This provided more reliable extraction of trees from LiDAR data compared to a purely geometric classification. The performance of the classification of fused LiDAR data with NDVI values is demonstrated through both visual and statistical evaluation approaches. In order to apply visual evaluation, three examples are given in Figure 6, where LiDAR classification results using only LiDAR data, and fused LiDAR data with NDVI values, are shown.
The classification results shown in Figure 6 indicate a significant misclassification in building and tree points. The tree points misclassified as buildings were detected by using the fused LiDAR and NDVI, which improved the reliability of tree extraction. Although the use of fused LiDAR and NDVI increases the robustness of tree extraction, it fails in the detection of tree points where trees are not recognised in both the LiDAR and imagery data. This occurs, for example, where trees appearing in the LiDAR data were cut down and replaced by buildings before the satellite image was recorded, as exemplified in Figure 7.
Ground Buildings Trees
Figure 6. Examples of classified LiDAR points using LiDAR data only (left) and fused LiDAR data and NDVI (right).
Ground Buildings Trees
Figure 7. Colourised LiDAR points (left), classified LiDAR points using LiDAR data only (middle) and fused LiDAR data
and NDVI (right).
The correctness of tree extraction was ascertained manually and statistical evaluation of the results was carried out using the well-known completeness and correctness measures proposed by Heipke et al. (1997). Table 1 summarises the evaluation for extraction of trees using both LiDAR data only and fused LiDAR and NDVI. As indicated in the table, use of the proposed method improved completeness and correctness of tree extraction by 13% and 18%, respectively.
Table 1. Accuracy analysis of the results.
LiDAR only Fused data set
Completeness 85% 98%
Correctness 76% 94%
Overall Quality 75% 92%
The main advantage of the proposed method is that it complements and extends tree detection based on conventional LiDAR point cloud classification methods. Tree detection can be further improved by using multiple return information of LiDAR points. In this experiment, multiple return data was unavailable; therefore, only an improvement of detected tree canopies was achieved. In terms of overall quality, superior performance in extraction of tree canopies was achieved using the proposed method, with the improvement being 17%. This highlights the significance of the use of fused LiDAR and multispectral imagery for tree canopy extraction.
A small area of the produced tree canopy cover map, before and after removal of gaps in the point cloud, is shown in Figure 8. Finally, a small area of the produced vector tree canopy cover map, overlaying the orthorectified image, is shown in Figure 9.
Figure 8. Tree canopy cover map before (left) and after (right) removal of gaps, tree (white) and non-tree (black).
Figure 9. Tree canopy cover map.
4. CONCLUSIONS
The performance of the proposed method for urban tree canopy cover mapping using fused multispectral satellite imagery and LiDAR data has been demonstrated. The proposed method introduces a new approach for the enrichment of LiDAR point clouds through co-registration with imagery data. It has been observed that the use of LiDAR classification may yield misclassification of tree points in urban areas due to the complexity of tree canopy shape. Complementary spectral information from registered satellite images has been shown to afford correction of the misclassification, and consequently lead to an improved reliability of LiDAR point cloud classification.
Comprehensive testing has shown that the classification performance can be enhanced by as much as 17% when using the fused data set. While the proposed method improved classification quality, it failed in the extraction of some tree canopies due to both the low density of the LiDAR data used in the experimental testing, and the lack of multiple return LiDAR data. Future research work will focus on extraction of additional biometric information on urban tree canopies through use of the same method applied to higher resolution imagery and LiDAR Water and Planning (www.delwp.vic.gov.au) for providing the LiDAR and imagery data set.
REFERENCES
Awrangjeb, M., Ravanbakhsh, M., Fraser, C.S., 2010. Automatic detection of residential buildings using LIDAR data and multispectral imagery. ISPRS Journal of Photogrammetry and Remote Sensing 65, 457–467.
Bandyopadhyay, M., van Aardt, J. a. N., Cawse-Nicholson, K., 2013. Classification and extraction of trees and buildings from urban scenes using discrete return LiDAR and aerial color imagery, in: SPIE Defense, Security, and Sensing. International Society for Optics and Photonics. pp. 873105–873109.
Carlberg, M., Gao, P., Chen, G., Zakhor, A., 2009. Classifying urban landscape in aerial LiDAR using 3D shape analysis, in: Image Processing (ICIP), 2009 16th IEEE International Conference on. pp. 1701–1704.
Demir, N., Baltsavias, E., 2010. Combination of Image and Lidar Data for Building and Tree Extraction. International Archives of the Photogrammetry, Remote Sensing and Spatial Information Sciences 38, 131–136.
Guan, H., Li, J., Chapman, M., Deng, F., Ji, Z., Yang, X., 2013. Integration of orthoimagery and lidar data for object-based urban thematic mapping using random forests. International Journal of Remote Sensing 34, 5166–5186.
Heipke, C., Mayer, H., Wiedemann, C., Jamet, O., 1997. Evaluation of automatic road extraction, in: International Archives of Photogrammetry and Remote Sensing, 32(3SECT 4W2). pp. 151–160.
Hoppe, H., DeRose, T., Duchamp, T., McDonald, J., Stuetzle, W., 1992. Surface reconstruction from unorganized points. ACM SIGGRAPH Computer Graphics 26, 71–78.
Jakubowski, M.K., Li, W., Guo, Q., Kelly, M., 2013. Delineating individual trees from lidar data: A comparison of vector- and raster-based segmentation approaches. Remote Sensing 5, 4163–4186.
Kim, H.B., Sohn, G., Science, S., 2010. 3D Classification of Power-Line Scene From Airborne Laser Scanning Data Using Random Forests, in: IAPRS, Vol. XXXVIII, Part 3B – Saint-Mandé, France, September 1-3, 2010. pp. 126–132.
Kobler, A., Pfeifer, N., Ogrinc, P., Todorovski, L., Oštir, K., Džeroski, S., 2007. Repetitive interpolation: A robust algorithm for DTM generation from Aerial Laser Scanner Data in forested
terrain. Remote Sensing of Environment 108, 9–23.
Koch, B., Heyder, U., Weinacker, H., 2006. Detection of individual tree crowns in airborne lidar data. Photogrammetric Engineering & Remote Sensing 72, 357.
Kraus, K., Pfeifer, N., 1998. Determination of terrain models in wooded areas with airborne laser scanner data. ISPRS Journal of Photogrammetry and Remote Sensing 53, 193–203.
Kwak, D.A., Lee, W.K., Lee, J.H., Biging, G.S., Gong, P., 2007. Detection of individual trees and estimation of tree height using LiDAR data. Journal of Forest Research 12, 425–434.
Lalonde, J., V, N., Huber, D.F., Hebert, M., 2006. Natural terrain classification using three-dimensional ladar data for ground robot mobility. Journal of Field Robotics 23, 839–861.
Li, W., Guo, Q., Jakubowski, M.K., Kelly, M., 2012. A New Method for Segmenting Individual Trees from the Lidar Point Cloud. Photogrammetric Engineering & Remote Sensing 78, 75–84.
Lodha, S.K., Kreps, E.J., Helmbold, D.P., Fitzpatrick, D., 2006. Aerial LiDAR Data Classification Using Support Vector Machines (SVM), in: Third International Symposium on 3D Data Processing, Visualization, and Transmission (3DPVT’06). pp. 567–574.
Maltamo, M., Næsset, E., Vauhkonen, J., 2014. Forestry Applications of Airborne Laser Scanning, Springer. Dordrecht.
Otsu, N., 1979. A Threshold Selection Method from Gray-Level Histograms. IEEE Transactions on Systems, Man, and Cybernetics 9(1), 62–66.
Parmehr, E.G., Fraser, C.S., Zhang, C., Leach, J., 2013. Automatic co-registration of satellite imagery and LiDAR data using local Mutual Information, in: Geoscience and Remote Sensing Symposium (IGARSS), IEEE International. pp. 1099– 1102.
Rottensteiner, F., Trinder, J., Clode, S., 2003. Building detection using LIDAR data and multispectral images, in: Proceedings of Digital Image Computing: Techniques and Applications (DICTA). pp. 10–12.
Rottensteiner, F., Trinder, J., Clode, S., Kubik, K., 2007. Building detection by fusion of airborne laser scanner data and multi-spectral images: Performance evaluation and sensitivity analysis. ISPRS Journal of Photogrammetry and Remote Sensing 62, 135–149.
Rutledge, A., Popescu, S., 2006. Using Lidar in Determining Forest Canopy Parameters, in: ASPRS Annual Conference.
Secord, J., Zakhor, A., 2007. Tree detection in aerial lidar and image data. Proceedings - International Conference on Image Processing, ICIP 4, 2317–2320.
Teo, T.A., Chen, L.C., 2004. Object-based building detection from LiDAR data and high resolution satellite imagery. Proceedings of the 25th Asian Conference on Remote Sensing 1614–1619.
Yamakawa, T., Fraser, C.S., 2004. The affine projection model for sensor orientation: experiences with high-resolution satellite imagery, in: International Archives of Photogrammetry and Remote Sensing, 35, B1. pp. 1–6.
Zhang, J., Lin, X., Ning, X., 2013. SVM-Based Classification of Segmented Airborne LiDAR Point Clouds in Urban Areas. Remote Sensing 5, 3749–3775.