EFFICIENCY OF CONTEXT-BASED ATTRIBUTES FOR LAND-USE CLASSIFICATION
OF URBAN ENVIRONMENTS
Hermosillaa *, T., Ruiza, L.A., Recioa, J.A., Cambra-Lópezb, M.
a
GeoEnvironmental Cartography and Remote Sensing Research Group. Universidad Politécnica de Valencia. Camino de Vera s/n, 46022 Valencia, Spain. - [email protected]
b
ICTA. Universidad Politécnica de Valencia. Camino de Vera s/n, 46022 Valencia, Spain.
KEY WORDS: Urban areas, Descriptive feature extraction, Context-based attributes, Object-based image classification, LiDAR data.
ABSTRACT:
We present a study for the evaluation of the efficiency of context features in object-based land-use classification of urban environments using aerial high spatial resolution imagery and LiDAR data. Objects were defined by means of cartographic boundaries derived from the cadastral geospatial database. Objects are exhaustively described through different types of image derived features (i.e. spectral and texture), three-dimensional features computed from LiDAR data, and geometrical features describing the shape of each object. Additionally, the context of each object is described considering several aspects: adjacency, urban morphology, vegetation, and geometry. Adjacency between objects was characterized by features computed using the graph theory. Urban morphology features are related to the shape and size of neighbouring buildings, and are often related to their socio-economic function. The presence and density of vegetation are strongly related to the different urban typologies. Many of the contextual features are related to buildings, which are obtained by means of automatic building detection techniques. The meaning of the defined features, and their contribution to the classification accuracy were analyzed. The results showed that the inclusion of contextual features had a positive effect on land use classification of urban environments, increasing the overall accuracy around 4%, compared of using only the rest of features. The classification efficiency particularly increased in some classes, such as different typologies of suburban buildings, planned urban areas and historical areas.
1. INTRODUCTION
Half of the world’s population is currently living in cities and this proportion is expected to increase progressively to 70% by 2050 (United Nations, 2010). The global increase in urban population and the rapid urbanisation processes was first experienced in developed countries in the middle of the twentieth century, and it is currently occurring in developing countries of Africa, Asia and Latin America. Urban sprawl phenomenon is produced due to the fast growing of cities and it entails diverse environmental consequences such as increasing the dependence on cars. The resulting reliance on fossil fuel causes a rise in pollution and greenhouse gas emission. Uncontrolled building and impervious surface construction leads to an increase in flood risk and a less effective absorption of rainfall into ground water aquifers, producing a decrease in land and water quality. Consequently, it is necessary to develop technologies and methodologies for monitoring urban sprawl and the side effects it causes. Remotely sensed data would enable the rapid adoption of policies that minimise the negative effects of urban sprawl. Solutions require a precise knowledge of the current urban environment to develop more efficient urban and territorial plans.
The high dynamism of urban areas causes a continuous alteration of land cover and use, and consequently, cartographic information is quickly outdated. The availability of detailed and up-to-date cartographic and geographic information is imperative for an adequate management and planning of urban areas. Traditionally, the process of deriving land-use/land-cover maps of urban areas involves field visits and classical photo-interpretation techniques using aerial imagery. These
methodologies are expensive, time consuming, and subjective. Digital image processing techniques may reduce the time employed for manual interpretation, satisfying current demands for continuously and precise data that accurately describes the territory.
The human recognition techniques employed for identifying elements in maps or images are performed by means of an intuitive analysis of individual characteristics and the topological features of spatial context within the overall environment (Hussain et al., 2007). According to Anders et al. (1999), the aim of retrieving structured information translated into more meaningful homogeneous regions can be achieved by identifying important structures within the initial random collection of objects and by understanding their spatial arrangement. Analogously to visual techniques used by photo-interpreters, digital image processing techniques describe urban elements properties through image derived features (i.e. spectral and texture features), three-dimensional features computed from LiDAR data, geometrical features describing the shape of each object, and contextual features which are related to the spatial attributes of the overall environment. These descriptive features aim to emulate human cognition by numerically quantifying the properties of the image elements prior to classification.
Urban areas can be decomposed in different aggregation levels, based on the categorisation, relationships, functions, and attributes of their various elements (Thomson and Béra; 2008). Objects can be defined using cartographical limits, such as plots or urban blocks. This is suitable for anthropogenic environments, where landscape units present unambiguous International Archives of the Photogrammetry, Remote Sensing and Spatial Information Sciences, Volume XXXVIII-4/W19, 2011
boundaries that are relatively stable over time. Objects are classified usually by using two-stage approximation methods. After classifying land-cover type or identifying significant urban elements – mostly buildings – a land use is assigned to each plot (Zhan et al., 2000) or urban block (Bauer and Steinnocher, 2001; Laskari et al., 2008) by examining their contextual relationships. Contextual relationships have been often represented by using two methods: fragmentation metric descriptors (Alberti and Waddell, 2000), which are frequently used in ecological and landscape analysis (McGarigal et al., 2002); and graph theory approach, which extends the concept of relational graph allowing for the representation of both, intrinsic and extrinsic relationships (Barnsley and Barr, 1997). Building information is important for characterising the land use of urban elements. The shape, size, and number of buildings per block determines its area and volume, and are often related to their socio-economic function. This suggests that the land use of an urban block may be determined by using quantitative observations related to the buildings that it contains. Building surface related features – i.e. building-to-land ratio (BTL) (Van de Voorde et al., 2009) – are often complemented with height information and volumetric descriptors when three-dimensional data is available (Yoshida and Omae, 2005; Yu et al., 2010; Vanderhaegen and Canter; 2010).
As a result of the hierarchical structure of urban landscapes, it is necessary to consider the different aggregation levels of their elements. Consequently, this paper aims to define and analyse context-based descriptive features for classifying land use in urban environments – using object-based image classification techniques and combining high spatial resolution imagery, LiDAR, and cartographic data. Objects are defined by considering plot limits. Context is described by analysing the urban blocks. The meaning of context-based descriptive features and their contribution to improve classification accuracy are studied in this paper.
2. MATERIAL AND METHODS
Urban land use classification was carried out following an object-based approach. The main steps of this approach were: class definition; sample selection; descriptive feature extraction; classification of the objects; and evaluation of the results. Objects were exhaustively described through image derived features (i.e. spectral and texture features), three-dimensional features computed from LiDAR data, and geometrical features relating the shape of each object. In addition, a set of features regarding the context were defined. Many of the features derived from context are based on the detection of buildings. Objects were classified using decision trees algorithm combined with boosting multi-classifier. The descriptive features groups were progressively combined in order to analyze and identify their specific effect in the classification accuracy.
2.1 Study area and data
The study area was the town of Oliva at the province of Valencia (Spain). Oliva is located on the coast and contains a variety of urban zones with several suburban areas, surrounded by large areas of citrus orchards and farmlands.
Image data were acquired in the framework of the Spanish Programme of Aerial Orthophotography (PNOA), which provides – among other photogrammetric products – periodic coverage of the entire national territory. Aerial images were
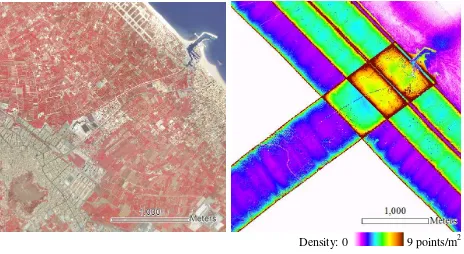
acquired in June 2006 with a spatial resolution of 0.5 m/pixel and three spectral bands: infrared, red and green. The images were already orthorectified, geo-referenced, panchromatic and multi-spectral band fused, and radiometrically adjusted. LiDAR data was acquired in September 2009 using an Optech ALTM 3025 sensor, with a nominal density of 2 points/m2, but with a high variability of the actual density distribution (see Figure 1). The limits of the plots were provided by cadastral cartography at a scale of 1:1000, produced by the Spanish National Land Registry Office (Dirección General de Catastro).
Density: 0 9 points/m2
Figure 1.Study area in colour infrared composition (left) and actual density distribution map of LiDAR data (right).
2.2 Definition of classes
The definition of urban land use classes was based on the specifications of the Land Cover and Land Use Information System of Spain (SIOSE) database. This data was generated by Spanish public administrations at a scale of 1:25,000. SIOSE divides the territory in polygons that separate different environments or uses. The urban land use classes considered were: historical, urban, open urban, detached housing and terraced/semidetached housing (see examples in Figure 2.a). In addition, agricultural/vegetation related classes were defined into orchards, croplands and bare/arable lands in order to fully classify the study zone. These last two classes were finally merged in a single category. According to the internal variability of the defined classes, a total of 1,129 samples were collected.
2.3 Building detection
Buildings were detected by means of a thresholding-based building detection approach (Hermosilla and Ruiz, 2009). This method is founded on the establishment of two threshold values: one referred to the presence of vegetation, defined by using the normalised difference vegetation index (NDVI) image; and other referring to the height, applied over the normalised digital surface model (nDSM). The nDSM, i.e. the difference between the digital surface model and the digital terrain model (DTM), was generated from LiDAR data. The DTM was computed by using an iterative algorithm – fully described in Estornell et al. (in press) – that eliminates points belonging to any above ground objects, such as vegetation or buildings.
The threshold values for vegetation and height were determined in a semi-automatic manner by collecting samples of both classes to be differentiated. Gaussian curves modelling their histogram were computed with the mean and standard deviation values of both sample classes. The threshold value was defined International Archives of the Photogrammetry, Remote Sensing and Spatial Information Sciences, Volume XXXVIII-4/W19, 2011
as the point where both curves intersected. The binary images produced during the thresholding steps were softened using morphological opening and closing filters, and small objects were eliminated to remove noise. Finally, the two binary images (vegetation and height) were intersected, revealing the detected buildings. Buildings and vegetation masks were used to define several descriptive features.
2.4 Descriptive features
Object-based features describe each object as a single entity based on several aspects that reflect the information typology used: multi-spectral, three-dimensional, geometry, etc. These features are computed using an object-based image analysis software: FETEX 2.0 (Ruiz et al., in press). Object-based features were divided in three groups: spectral features, texture features, and three-dimensional and shape features. Spectral features provide information about the intensity values of objects in the different spectral bands. Mean, standard deviation, minimum and maximum descriptors were computed for each object in the available bands and in the NDVI image. Texture features quantify the spatial distribution of the intensity values in the analysed objects. The following descriptive features were derived: kurtosis and skewness of the histogram; grey level co-occurrence matrix (GLCM) derived descriptors proposed by Haralick et al. (1973); edgeness factor descriptors (Sutton and Hall, 1972); and semivariogram based features defined by Balaguer et al. (2010). Three-dimensional features are derived from the nDSM computed from LiDAR data, each object being characterised by the mean, standard deviation, and maximum values of the heights. Shape features describe the dimensions of the objects and their contour complexity. Area, perimeter, compactness, shape index and fractal dimension were computed.
The context-based features provide information about the properties of the super-object created by merging adjacent objects (plots). This merging produces new entities with a higher aggregation level, corresponding to urban blocks in urban areas. Context is described by considering the spatial relationships of adjacent objects by means of building-based, vegetation-based, geometrical and adjacency features. Adjacency between objects was characterised based on the study of graphs, or mathematical structures used to model pairwise relations between objects from a collection (Laurini and Thompson, 1992). This theory was introduced for image classification purposes to describe the spatial relationship of adjacency – corresponding with edges in the graph – between geographical objects represented by vertices in order to quantify the adjacency relationships between objects, several features were defined: the number of correspondences with surrounding objects; the mean distance of these adjacencies; and the standard deviation of the distances between adjacent objects. These features are closely related to both, object and super-object dimensions.
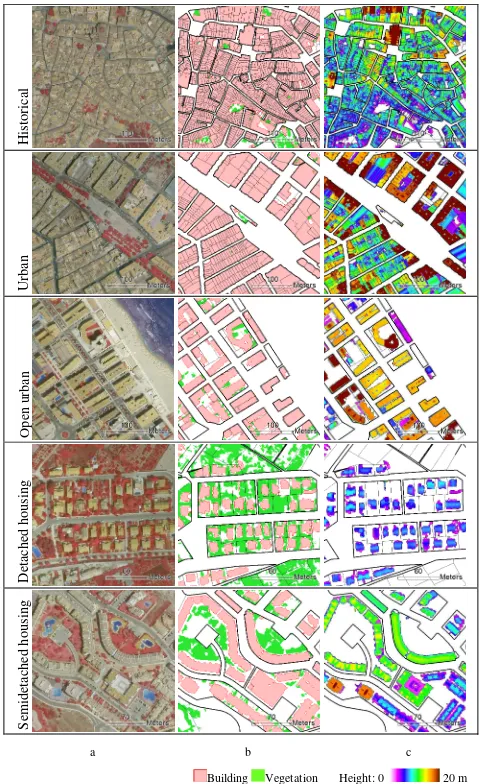
Buildings correspond to basic elements of urban areas, and their characteristics shape our perception of the various urban morphological areas. Bi-dimensional and three-dimensional features describing the buildings inside each urban block were computed. Bi-dimensional features refer to built-up surface and built-up percentage, which is usually referred to as building coverage ratio (BCR) or sealed surface. As shown in Figure 2.b, in general, buildings in the historical and urban classes include urban blocks with small inner light wells. The open urban class
a.
Figure 2.Examples of the urban classes defined in (a) colour infrared composition, and (b) details of the built-up and
vegetation covered surface, and (c) distribution of building heights.
usually has only a portion of built-up area in a plot or urban block. The detached housing class tends to include several small buildings distributed in variable size plots and large urban blocks. The semi-detached/terraced housing class has larger built-up areas in small plots and urban blocks.
Buildings contained in an urban block were also characterised using a set of three-dimensional features, i.e. mean and standard deviation values of their heights, and also features related with the volumetric information of buildings. Using the volume of mainly characterised by the irregularity of building heights and dimensions. Urban class contains taller buildings with more uniformity, larger dimensions, and higher volume values. Open urban class buildings have a diversity of dimensions and heights, but these are regular and lack internal variability. Individual semi-detached/terraced housing buildings normally have smaller dimensions, but taller buildings than the detached housing class. Semi-detached/terraced housing constructions International Archives of the Photogrammetry, Remote Sensing and Spatial Information Sciences, Volume XXXVIII-4/W19, 2011
are attached and so produce elongated building rows with high unitary volumes at the urban block level.
The presence and density of vegetation is strongly related to the different urban areas. The percentage of surface covered by vegetation within an urban block was defined. Additionally, statistical descriptors (mean and standard deviation) were computed from the pixels identified as vegetation from nDSM and NDVI, respectively. Little vegetation is found in industrial areas and in other urban classes. In contrast suburban residential areas show abundant vegetation (Figure 2.b).
The geometrical properties of the urban blocks were described using area, perimeter, compactness, shape index, and fractal dimension features. Historical blocks are characterised by the extreme irregularity of their contours and by small and medium surface areas. In contrast, the urban class blocks show regular shapes with an abundance of perpendicular junctions that are similar to the open urban block. This class reveals especially variable dimensions. Suburban single-family blocks also present a variety of sizes. Detached housing blocks are commonly square, while semi-detached/terraced housing reveals significantly elongated shapes.
2.5 Classification and accuracy assessment methods
Four classifications were done by progressively adding descriptive features groups: spectral, texture, three-dimensional and shape, and context. Classification was performed using decision trees built with the C5.0 algorithm and the boosting multi-classifier method. This algorithm searches the features that best separate one class from the others by using mutually exclusive conditions, until homogeneous subgroups are generated, i.e. all the elements in a subgroup belong to the same class, or a stopping condition is satisfied.
The evaluation of the four classifications performed was done by analysing the confusion matrix. The overall accuracies of the classifications were computed, as well as the producer and user accuracies for each class (which respectively reveal the errors of omission and commission). To improve the efficiency of the number of samples, the leave-one-out cross-validation technique was employed. In addition, a specific confusion index was defined to quantify the misclassification between classes by pairs, computed as the sum of their mutual errors divided by the total objects from that pair of classes. Confusion index values range from 0 (absence of per-class-pair errors) to 1 (all the objects of both classes are misclassified).
3. RESULTS
The classification results showed that the progressive addition of feature groups increases the classification accuracy, indicating the complementary nature of these feature groups (Table 1). The lowest values were obtained when only spectral features were considered. The addition of texture features slightly increased the accuracy. Three-dimensional and geometrical data offered valuable information (over 9% of overall accuracy increase). Finally, context based features also produce noticeable increases (4.3%) in overall accuracy.
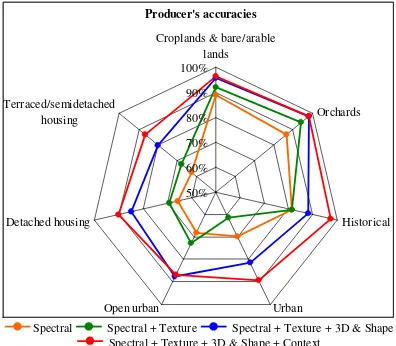
User’s and producer’s accuracies per class for the various feature group combinations are respectively shown in Figure 3 and Figure 4. Analogously to the overall accuracy values, the least accurate performances were achieved when only spectral features were considered. The combination of different feature
groups increased accuracy values, with the exception of the texture features, that negatively affected the producer’s accuracy of urban class and the user’s accuracy of historical and open urban classes. The agricultural classes performed properly considering only spectral and texture features. In general, urban classes presented low accuracy values considering only image derived features. The addition of LiDAR derived three-dimensional features yield a noticeable increase of the user’s and producer’s accuracies, and the addition of context based features improves the accuracy, being significantly remarkable for the user’s accuracy of the urban class. When all feature groups were considered, accuracy values of all classes were closer or higher than 90%, with the only exception of the user’s accuracy of the terraced/semi-detached housing class, which was slightly lower than 80%.
Table 1.Classification overall accuracy combining feature groups.
Spectral Spectral + Texture Spectral + Texture + 3D & Shape Spectral + Texture + 3D & Shape + Context
Figure 3.User’s accuracies as feature groups are combined.
Producer's accuracies
Spectral Spectral + Texture Spectral + Texture + 3D & Shape Spectral + Texture + 3D & Shape + Context
Figure 4.Producer’s accuracies as feature groups are combined.
0% 5% 10% 15% 20% 25%
Detached housing vs Terraced/semi-detached
housing
Urban vs Historical Urban vs Open urban
Pairs of classes
C
o
n
fu
si
o
n
i
n
d
ex
.
Spectral Spectral + Texture Spectral + Texture + 3D & Shape Spectral + Texture + 3D & Shape + Context
Figure 5.Evolution of confusion index when descriptive features are successively introduced into the classification
model.
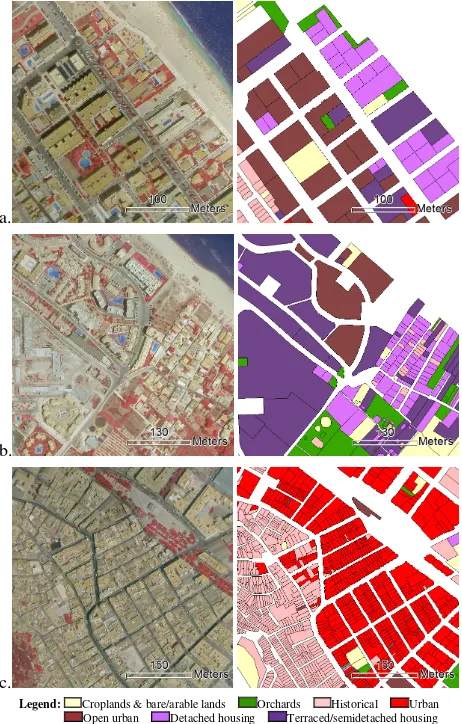
Three pairs of classes presented high levels of confusion due to their spectral similarities and the absence of a framework for contextualising their differences: detached housing and terraced/semidetached housing; urban and open urban; and urban and historical. The per-class-pair confusion index for these classes (see Figure 5) noticeably decreases when three-dimensional and geometrical based features are considered. This is especially evident for the detached housing and terraced/semidetached housing classes, since plots contained in the semi-detached/terraced housing class are characterised by smaller dimensions and taller buildings than detached housing plots. The successive addition of the contextual features reduces the confusion between both classes up to a value of 8%. Figure 6.a and Figure 6.b shows an area mainly occupied by the classes detached housing and terraced/semi-detached housing. Similarly, urban and open urban classes present a slightly high initial per-class-pair confusion index that is considerably reduced when tree-dimensional and context based features are considered in the classification.
Historical and urban classes show a high per-class-pair confusion index, but it is remarkably reduced as three-dimensional and also contextual features are used in the classification. The plots from these classes present similar object level features, being their main differences at urban block level. The urban class blocks usually belong to a previously planned and ordered environment. Urban blocks of historical areas have irregular and complex shapes. Figure 6.c graphically shows how historical and urban classes are in general efficiently discriminated, in spite of some minor errors produced in isolated objects.
4. CONCLUSIONS
This paper describes a set of context-based descriptive features for urban environment land-use classification computed from high spatial resolution imagery and airborne LiDAR data. These features aim to imitate human cognition through the numerical quantification of the discrimant properties of image elements. The results of the classification show that the inclusion of contextual features has a positive effect on land use classification of urban environments, producing an increase of the overall accuracy of 4%, compared to the one obtained using only the other type of features: spectral, texture, three-
a.
b.
c.
Legend: Croplands & bare/arable lands Orchards Historical Urban Open urban Detached housing Terraced/semidetached housing
Figure 6.Cartographic compositions details of the automatic classification.
dimensional and geometrical. The classification efficiency is particularly increased in some classes, such as different typologies of suburban buildings, planned urban areas and historical areas, since a framework for contextualising the differences of these classes is provided. This methodology, based on automated descriptive feature extraction from LiDAR data, images and context information using an object-based approach, provides new tools to increase the frequency and efficiency of urban studies, being applicable for mapping cities, urban landscape characterisation and management, and updating geospatial databases.
ACKNOWLEDGEMENTS
The authors appreciate the financial support provided by the Spanish Ministry of Science and Innovation and FEDER in the framework of the projects CGL2009-14220 and CGL2010-19591/BTE, and the Spanish Instituto Geográfico Nacional.
REFERENCES
Alberti, M., Waddell, P., 2000. An integrated urban development and ecological simulation model. Integrated Assessment, 1, pp.215–227.
Anders, K.-H., Sester, M., Fritsch, D. 1999. Analysis of settlement structures by graph-based clustering. Semantische Modellierung, SMATI 99, Munich, Germany, pp. 41–49.
Balaguer, A., Ruiz, L.A., Hermosilla, T., Recio, J.A., 2010. Definition of a comprehensive set of texture semivariogram features and their evaluation for object-oriented image classification. Computers & Geosciences, 36(2), pp.231-240.
Barnsley, M., Barr, S., 1997. A graph-based structural pattern recognition system to infer land use from fine spatial resolution land cover data. Computers, Environment and Urban Systems, 21, pp.209-225.
Bauer, T., Steinnocher, K., 2001. Per-parcel land use classification in urban areas applying a rule-based technique. GeoBIT/GIS, 6, pp.24-27.
Estornell, J., Ruiz, L.A., Velázquez-Martí, B., Hermosilla, T., In press. Analysis of the factors affecting LiDAR DTM accuracy in a steep shrub area. International Journal of Digital Earth. http://dx.doi.org/10.1080/17538947.2010.533201
Haralick, R.M., Shanmugan, K., Dinstein, I., 1973. Texture features for image classification. IEEE Transactions on Systems, Man and Cibernetics, 3, pp.610-621.
Hermosilla, T., Ruiz, L.A., 2009. Detección automática de edificios combinando imágenes de satélite y datos lidar. In: Semana Geomática, 2-4 February, Barcelona, Spain.
Hussain, M., Davies, C., Barr, R., 2007. Classifying buildings automatically: a methodology. In: Proceedings of the Geographical Information Science Research UK Conference, GISUK, 11-13 April, County Kildare, Ireland.
Laurini, R., Thompson, D. (1992). Fundamentals of spatial information (Vol. 5). London, UK: Academic Press.
Laskari, S., Hanna, S., Derix, C., 2008. Urban identity through quantifiable spatial attributes: coherence and dispersion of local identity through the automated comparative analysis of building block plans. In: Proceedings of the Third International Conference on Design Computing and Cognition, Dordrecht, The Netherlands, 615-634.
McGarigal, K., Marks, B.J., 1995. FRAGSTATS: Spatial pattern analysis program for quantifying landscape structure. Gen. Tech. Rep. PNW-GTR-351; Pacific Northwest Research Station, USDA-Forest Service, Portland.
Ruiz, L.A., Recio, J.A., Fernández-Sarría, A., Hermosilla, T., In press. A feature extraction software tool for agricultural object-based image analysis. Computers and Electronics in Agriculture. http://dx.doi.org/10.1016/j.compag.2011.02.007
Sutton, R.N., Hall, E.L., 1972. Texture measures for automatic classification of pulmonary disease. IEEE Transactions on Computers, 21(7), pp. 667-676.
Thomson, M. K., Béra, R., 2008. A methodology for inferring higher level semantic information from spatial databases. Proceedings of the Geographical Information Science Research UK Conference, 268–274.
United Nations, Department of Economic and Social Affairs, Population Division: World Urbanization Prospects, the 2009 Revision: Press Release. New York, 2010
Van de Voorde, T., Van der Kwast, J., Engelen, G., Binard, M., Cornet, Y., Canters, F., 2009. Quantifying intra-urban morphology of the Greater Dublin area with spatial metrics derived from medium resolution remote sensing data. Proceedings of the 7th International Urban Remote Sensing Conference, IEEE Geoscience and Remote Sensing Society, 20-22 May, Shanghai, China.
Vanderhaegen, S., Canters, F., 2010. Developing urban metrics to describe the morphology of urban areas at block level. The International Archives of the Photogrammetry, Remote Sensing and Spatial Information Sciences, XXXVIII, Part 4/C7, 6p.
Yoshida, H., Omae, M., 2005. An approach for analysis of urban morphology: methods to derive morphological properties of city blocks by using an urban landscape model and their interpretations. Computers, Environment and Urban Systems, 29 (2), pp.223-247.
Yu, B., Liu, H., Wu, J., Hu, Y., Zhang, L., 2010. Automated derivation of urban building density information using airborne LiDAR data and object-based method. Landscape and Urban Planning, 98 (3-4), pp.210-219.
Zhan, Q., Molenaar, M., Gorte, B., 2000. Urban land use classes with fuzzy membership and classification based on integration of remote sensing and GIS. The International Archives of Photogrammetry and Remote Sensing, XXXIII, Part B7, pp.1751-1759.