Estimation of the spectral sensitivity functions of un-modified and modified commercial
off-the-shelf digital cameras to enable their use as a multispectral imaging system for UAVs
E. Berra1, S. Gibson-Poole2, A. MacArthur3, R. Gaulton1, A. Hamilton2
1School of Civil Engineering and Geosciences, Cassie Building, Newcastle University, Newcastle upon Tyne, NE1 7RU, UK.
2Scotland’s Rural College, Peter Wilson Building, Kings Buildings, West Mains Road, Edinburgh, EH9 3JG, UK. *[email protected]; *[email protected]
3NERC Field Spectroscopy Facility, Grant Institute, The King's Buildings, James Hutton Road, Edinburgh EH9 3FE, UK
KEYWORDs: UAV, Remote Sensing, Multispectral, COTS, Spectral Sensitivity, Open Source, CHDK
ABSTRACT:
Commercial off-the-shelf (COTS) digital cameras on-board unmanned aerial vehicles (UAVs) have the potential to be used as multispectral imaging systems; however, their spectral sensitivity is usually unknown and needs to be either measured or estimated. This paper details a step by step methodology for identifying the spectral sensitivity of modified (to be response to near infra-red wavelengths) and un-modified COTS digital cameras, showing the results of its application for three different models of camera. Six digital still cameras, which are being used as imaging systems on-board different UAVs, were selected to have their spectral sensitivities measured by a monochromator. Each camera was exposed to monochromatic light ranging from 370 nm to 1100 nm in 10 nm steps, with images of each step recorded in RAW format. The RAW images were converted linearly into TIFF images using DCRaw, an open-source program, before being batch processed through ImageJ (also open-source), which calculated the mean and standard deviation values from each of the red-green-blue (RGB) channels over a fixed central region within each image. These mean values were then related to the relative spectral radiance from the monochromator and its integrating sphere, in order to obtain the relative spectral response (RSR) for each of the cameras colour channels. It was found that different un-modified camera models present very different RSR in some channels, and one of the modified cameras showed a response that was unexpected. This highlights the need to determine the RSR of a camera before using it for any quantitative studies.
1INTRODUCTION
A new era of fine-scale remote sensing has emerged with the arrival of unmanned aerial vehicles (UAVs), which have the advantage of being lightweight, low-cost and operationally easy to deploy as safe remote sensing acquisition platforms (Berni et al., 2009; Zhang & Kovacs, 2012).
Commercial off-the-shelf (COTS) digital cameras are typically used as imaging systems on-board UAVs due to their low-cost and researchers often want to make further use of them as multispectral imaging systems due to their ability to detect near infra-red light (Darrodi et al., 2015; Suzuki et al., 2009; Lebourgeois et al., 2008), once modified by removing the hot mirror filter (Rabatel et al., 2014; Verhoeven et al., 2009).
However, this is hampered by a lack of knowledge of the spectral sensitivity of the camera, as COTS camera manufacturers typically do not publish this information. Also when cameras have been modified (with the addition of a long pass or notch filter) by an external party, the wavelengths that could be transmitted through that filter are also not always known (as is the case with two of the modified cameras in this study). Therefore, users need to either measure or estimate their cameras sensitivity (Darrodi et al., 2015; Jiang et al., 2013).
A standard and accurate methodology for measuring the sensor sensitivities is to take photographs of monochromatic light produced by a monochromator (Darrodi et al,. 2015), where the digital numbers (DN) recorded on the images are expected to have a linear response to the radiation output of the monochromator (Verhoeven et al., 2009).
Even though previous studies have measured the spectral function of different digital still cameras using monochromators (Darrodi et al., 2015; Jiang et al., 2013; Suzuki et al., 2009; Verhoeven et al., 2009), there is a lack of a detailed methodology in how to do so, which has motivated us to present an open-source workflow to process the images after image acquisition. In this paper, we aim to identify and to present a step-by-step methodology for identifying the spectral sensitivity of modified and un-modified low-cost digital cameras using open source software, in order for them to be used as multispectral cameras for UAV systems and compare the results for a range of COTS and modified cameras.
2METHODOLOGY
2.1Camera types and settings
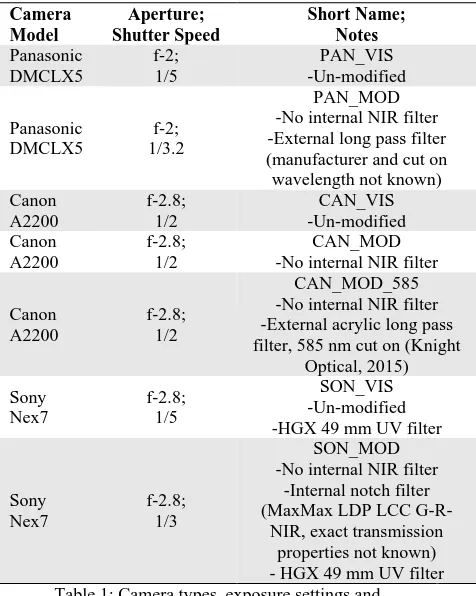
Six physical cameras (two of each model), which have been used as imaging systems on-board different UAVs, were selected for spectral sensitivity estimation. The cameras were either un-modified and therefore only sensitive to visible light (VIS), or modified (MOD) to also be sensitive to near infra-red (NIR) wavelengths. The modified cameras have had their internal NIR filter removed, thereby turning them into a full spectrum (FS) camera, which was then replaced with either an internal or external long pass or notch filter to alter the cameras spectral sensitivities.
camera, as presented in Table 1. For each of the cameras, the ISO was set to 100 in order to gain a high signal to noise ratio, and the aperture and shutter speed were altered to ensure that the image was not overexposed. The optimal exposure settings were chosen when the monochromatic light with the highest signal intensity (~540 nm for VIS and between 600~700 nm for NIR) came close too (but not actually) saturating the images digital numbers (DN).
The defined settings (Table 1) were then kept unchanged throughout the acquisition period and the images were recorded in both JPG and RAW formats. RAW format is necessary as it assumes that the cameras sensor detects and stores radiance without applying any processing or compression to it, i.e. the original signal reaching the sensor is not modified (Verhoeven, 2010). filter, 585 nm cut on (Knight
Optical, 2015) Table 1: Camera types, exposure settings and modifications. Each camera used an ISO of 100
throughout the experiment.
Both the Panasonic and Sony cameras were able to record JPG and RAW files natively; however, the Canon camera could not. Therefore modified firmware (CHDK v1.2; CHDK, 2015) was used to allow JPG and RAW (Adobe DNG v1.3 format) images to be produced, as well as to allow the shutter speed to be set at a constant value.
2.2Monochromatic light image acquisition
The spectral sensitivities of each camera were measured by recording their response to monochromatic light produced by a
double monochromator (OL 750-M-D Double Grating Monochromator (Additive), Optronic Laboratories, Inc., Orlando, Florida, USA) and reflected by an integrating sphere attached at the monochromators exit slit. The light beam is reflected by the spheres interior surface from where images were acquired through a detection port in the integrating sphere (Figure 1).
Figure 1: The monochromator and camera setup and three example images of the inside of the integrating sphere at
different wavelengths.
The monochromator was located in a temperature-controlled dark room and the lens of each camera was positioned touching the integrating spheres detection port. The sphere and camera were also covered by a low reflectance black cloth in order to avoid any external light contaminating the result.
Each camera was exposed to monochromatic light ranging from 370 nm to 1100 nm in 10 nm steps, with two images being settings selected on the monochromator and the wavelength interval from which images were acquired to measure the cameras spectral response, are presented in Table 2.
Lamp Voltage (v) 19 17 17
Filter (nm) 345 345 599
Wavelengths
sampled (nm) 370-500 510-620 630-1100 Table 2: Monochromator lamp voltage and internal filter
settings used for specific wavelengths being sampled.
2.3Imaging processing
Each camera recorded its RAW image file using a different format dependant on the camera manufacturer, so the open source software DCRaw (v9.25; DCraw, 2015a) was used to convert the RAW files into TIFF images that maintained a linear relationship with the original RAW data (Gehrke & Greiwe, 2014; Verhoeven et al., 2009). During this step, the Panasonic images were also corrected for the effects of the dark current signal as DCRaw can utilise the dark image taken at the same time as the images of monochromatic light, generating dark-corrected linear TIFF images. The script command used with explanation is present in Appendix 1.
The TIFF image DNs were averaged within a 9 x 9 pixel area in the centre of each image, in order to avoid issues related with the variance of the radiance within the integrating sphere and any differences in the individual pixel response across each camera’s image sensor (Darrodi et al., 2015).
To obtain the mean and standard deviation values from the 9x9 pixel window of each image, a macro was created using the open source software ImageJ (v1.49k, Fiji distribution; ImageJ, 2015). Figure 2 details the workflow used to capture these values and a detailed step-by-step guide is presented in Appendix 2 and the ImageJ macro script used is presented in Appendix 3.
RAW and JPG images converted to TIFF using DCRAW
TIFF images split into three channels using an ImageJ macro
TIFF images cropped to a 9x9 pixel window (at the centre of each image) using an ImageJ macro
TIFF images analysed using ImageJ measure function to obtain mean pixel value and standard deviation
Figure 2: Post processing steps to convert RAW and JPG images and to obtain mean and standard deviation digital
number values for further analysis.
2.4Retrieving RSR from the cameras
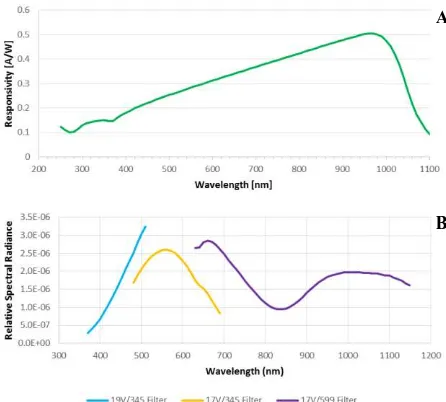
The light intensity from the monochromator and its integrating sphere were independently measured using a reference silicon
photodiode (OL DH-300C S/N: 12101253, Optronic
Laboratories, Inc., Orlando, Florida, USA) in order to identify the relative spectral radiance at each measured wavelength (Figure 3). The settings used mirrored those used at the image acquisition phase (Table 2).
Two lamps voltages were used (Figure 3B), with the 17 V lamp was used in combination with the 345 nm and 599 nm filter, however for the lower wavelengths (<500 nm) the lamp voltage was increased to 19 V in order to generate monochromatic light with an intensity that would be strong enough to be detected by the cameras sensors on wavelengths ~400 nm. This is because the CCD (charge coupled device) or CMOS (complimentary metal oxide semiconductor) sensors which are usually fitted in
COTS cameras are likely to sense wavelengths lower than 400 nm (Nijland et al., 2014).
The RSR of the RGB channels for a given wavelength λ were calculated as per Eq. 1 (Suzuki et al,. 2009) and a linear relationship between the input radiance and the output signal is assumed (Darrodi et al. 2015).
� � = �� �� �, � � = �� �
� �, � � = � � � � � (1)
Where r, g, and b = the mean spectral response from each camera channel (red, green and blue channels, respectively) given in DN values and calculated from the 9x9 window (output signal);
I = the light intensity (monochromator and sphere) given in relative spectral radiance units (input radiance);
η = the normalized coefficient.
Instead of using absolute physical units, the η coefficient is applied to generate a relative spectral response, as it results in lower calibration uncertainties (Darrodi et al., 2015). For each camera, the mean spectral response over all of the wavelengths were normalized (η) by the maximum signal detected among the RGB channels, yielding dimensionless units with a peak equal to 1.
Figure 3: The responsivity of the silicon photodiode (A); The relative spectral radiance of the monochromator at given
voltages using specific filters (B).
3RESULTS
All of the un-modified cameras showed similar ranges within the visual spectrum as would be expected (400~700 nm; Figure 4), with almost all of the RGB channels covering this range but with varying degrees of sensitivity. The green channel for each camera showed the highest peak response due likely to all cameras being using a Bayer colour filter array, which has twice as many green filters compared to red or blue, as this more closely resembles how the human eye sees the world A
(Lebourgeois et al., 2008; Verhoeven, 2010) and improves luminance sampling and image sharpness (Verhoeven et al., 2009; Verhoeven, 2010).
However a closer analysis on both shape and intensity of the RSR curves reveals differences among the camera models, and most noticeable are the differences of the Sony cameras compared to the other two models (Figure 4).
The red channel of the Sony camera (Figure 4C) has a much lower peak response (0.58) compared to Panasonic (Figure 4A) and Canon (Figure 4B) red channels, which both peak with a response of ~0.8. The green channel curve of the Sony also shows a narrower shape than both Panasonic and Canon. For the blue channel, the Canon and Sony tend to have very low sensitivity after around ~560 nm; however the Panasonic keeps on sensing until around 680 nm.
Figure 4: Spectral responses from the un-modified Panasonic (A), Canon (B) and Sony (C) cameras, normailised to the peak
value of each cameras green channel.
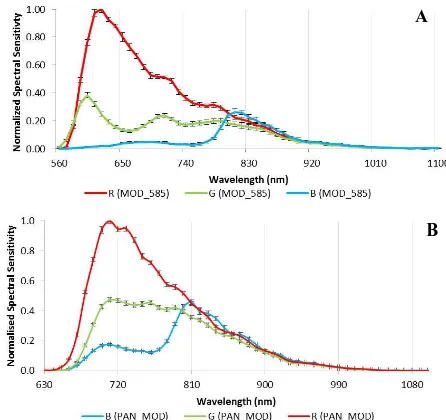
The FS Canon camera (Figure 5) shows the full spectral sensitivity of the Canon sensor, with responses from 370~1020 nm for all of the channels, revealing the expected COTS cameras sensitivity to NIR wavelengths when the internal NIR blocking filter is removed (Verhoeven et al., 2009). The blue channel has a very low response from 560~770 nm with a peak at 820 nm (well within the NIR band), which is accordance with what could be expected from a Bayer filter (Nijland et al., 2014).
Figure 5: Spectral response for the modified to full spectrum Canon camera normalised to the peak of the green channel
With a 585 nm long pass filter attached to the FS Canon camera (Figure 6A), the NIR peak in the blue channel could potentially be exploited as the blue channel is now the only channel that is predominately sensitive to NIR wavelengths and is beyond the red edge feature of 700~720 nm (Hunt et al., 2010).
This same characteristic is not observed with the blue channel of the modified Panasonic (Figure 6B), as its sensitivity increases rapidly after 670 nm, detecting some wavelengths within the red region of the spectrum and across the red-edge feature. It is noticeable for both cameras (Figure 6) that their blue channels have a much lower intensity than the red channels.
Both modified Panasonic and modified Canon cameras have the red channel as the most sensitive to NIR light, however the Panasonic peaks at 710 nm, within the red-edge feature, meanwhile the Canon peaks at 620 nm, within the red region of the spectrum (Figure 6). The green channels have an intermediate sensitivity between blue and red channels (Figure 6).
Figure 6: Spectral response for the modified to full spectrum Canon with with a 585 nm long pass filter (A) and for the
modified Panansonic camera (B), both normailised to the peak of the red channel.
A
B
C
A
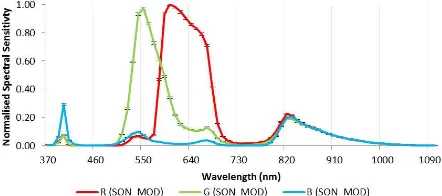
The red and green channels of the modified Sony camera (Figure 7) have well characterized curves peaking in the green and red wavelengths respectively, that are narrower and of a more equal intensity compared to the same channels in the un-modified Sony camera (Figure 4C) . The blue channel however has a much lower sensitivity than the green and red, with two main peaks at 400 nm and 830 nm, meaning that this channel may not be suitable to be used as the source of a NIR signal.
Figure 7: Spectral response for the modified Sony camera, normailised to the peak of the red channel.
4DISCUSSION AND CONCLUSIONS
The image acquisition method employed is a relatively standard technique, variations of which have been employed by numerous studies (Darrodi et al., 2015; Jiang et al., 2013; Suzuki et al., 2009; Verhoeven et al., 2009) and is known to give accurate results but it does require expensive and specialised laboratory facilities and equipment (Bongiorno et al., 2013; Darrodi et al., 2015). Other methods could be employed instead, such as those indicated by Bongiorno et al. (2013), who themselves used a linear variable edge filter to characterise the spectral response of several COTS cameras; However they may not be able to cover the entire range of wavelengths sampled in this study.
In the image processing stage, the use of DCraw (or a distribution/modification of) as a tool to convert RAW images into linear TIFF files is also widely acknowledged in the literature (Lebourgeois et al., 2008; Rabatel et al., 2014; Verhoeven et al., 2009), but often we see the further processing of these converted images using proprietary software such as ENVI (Hunt et al., 2010) or MATLAB (Verhoeven et al., 2009).
Using an open source program such as ImageJ to process the images means that this technique can be used by anyone, and the macro and batch processing options available meant that processing a large volume of images (over 200 for FS Canon camera alone) is both quick and simple.
The data presented here has not gone through any corrections to account for extra noise that may be present, as some of the cameras did not have dark images taken. So the results are representing the response of the sensor to the photons hitting it, plus any dark current signal and bias signal (Verhoeven et al., 2009). The bias signal is likely to be small but the dark current signal could be quite large depending on the temperature at the time of taking the image and the ISO and exposure settings used (Verhoeven et al.,2009).
This unwanted noise reduces the signal to noise ratio (SNR), and can be corrected for by taking dark images at the same time as momochromatic light image acquisition and using DCraw to subtract a dark frame as indicated in Appendix 1.
Other points of possible error that would need to be corrected for are the identification and interpolation of bad pixels within the image (pixels that fail to sense light levels), which can also be corrected though the use of DCraw, and vigenetting. Vignetting is where the brightness of an image reduces away from the centre of the image and can be caused due to physical effects of the cameras lens as well as the angle of the light source in relation to the lens (Lebourgeois et al., 2008). The reasoning behind having a small and central 9 x 9 pixel sampling window in the image processing phase was partly due to this phenomenon and for imagery that is to be used for remote sensing this would need to be corrected by following a method similar to that of Lebourgeois et al. (2008).
A final source of error that was overlooked at the time of image acquisition is that of reflections off of the camera lenses themselves (and any external filters), back into the integrating sphere (as the lens was positioned so close to the detection port of the integrating sphere). The properties of any anti-reflective coating of the camera lenses or filters used is not known, however it is likely that its effect would be small in the visual region of the spectrum and perhaps more pronounced towards the NIR region, as the cameras were principally designed to detect visual wavelengths of light.
With these potential sources of error acknowledged, the results of the experiment can be investigated and they reveal that the RSR differs between the un-modified camera models and therefore we cannot assume that all COTS digital cameras have a standard Bayer array response or internal NIR filter response, which echoes that of other studies (Darrodi et al., 2015; Jiang et al.; 2013). Once the spectral sensitivity of a camera is known, judgments can be made on what the camera could be used for (e.g. vegetation monitoring), how it can be used (e.g. singularly or in combination with another camera) and what filters could be applied in order to capture desired wavelengths of light.
For instance monitoring vegetation with COTS digital cameras usually requires the combination of visible and NIR wavelengths in order to exploit the well-known spectral characteristics of healthy plant leaves, namely the low reflectance of visible wavelengths due to chlorophyll absorption and high reflectance in the NIR wavelengths due to plant cell structure. This behaviour results in a spectral contrast which is the basis for many vegetation indices (VI), such as the Normalized Difference Vegetation Index (NDVI) (Rouse et al., 1973).
In contrast to Hunt et al. (2010), a study by Rabatel et al. (2014) used a single COTS camera with all channels sensitive to NIR (as is the case with the cameras of this study) and investigated the use this camera as a multispectral sensor to estimate NDVI. A blue light blocking filter was used to allow NIR wavelengths to be captured in the blue channel and red+NIR wavelengths in the red channel. It utilised an orthogonal projection method to simulate the separation of the red and NIR wavelengths to allow NDVI estimates to be made of agricultural crops.
Alternatively two cameras could be combined, one un-modified and the other modified to capture NIR, so that separate red and NIR bands can be acquired and registered together to allow NDVI estimation (Dare, 2008). This approach can have issues with the geometric alignment of the bands as they come from two separate instruments (Dare, 2008), which of course would not be an issue with a single camera approach (Rabatel et al,. 2014), however the dual camera method has other advantages such as more control of the shape of the NIR band, reduced concerns about SNR and the fact that standard RGB colour images can be produced at the same time and (Rabatel et al., 2014).
From the results displayed we can say that our three models of camera are sensitive to NIR wavelengths of light, and this confirms the common knowledge that COTS digital cameras in general are responsive to NIR and could potentially be used as a remote sensing tool (Lebourgeois et al., 2008; Rabatel et al., 2014; Suzuki et al., 2009; Verhoeven et al., 2009). However, the comparison of the spectral responses shows that there might be some implications for combining different cameras or combining channels from the same camera.
For the Panasonic cameras in this study, the dual camera method could be applied as the red channel from the unmodified Panasonic (Figure 4A) could be used as the red band and the red channel from modified Panasonic as the NIR band (Figure 6B), as it has the highest SNR. However there is some overlap between these bands, in the region of 650-690 nm, which might cause some band correlation (Nijland et al., 2014). Also the red channel from the modified Panasonic peaks within the red-edge feature (710 nm) and so may not show as strong a NIR response compared to longer wavelengths, as green leaves present their maximum reflectance after 740 nm (Brandelero et al., 2012).
Likewise for the Canon cameras, the dual camera method could also be applied as the modified camera with a 585 nm filter shows a peak NIR response at ~820 nm (Figure 6A), which could prove more useful than that of the Panasonic camera if used for vegetation monitoring; however it has a considerably reduced sensitivity (~20% compared to the red channel of the same camera) which could lead to issues with SNR. Interestingly the single camera method employed by Rabatel et al. (2014) could also be attempted with this modified camera, and in conjunction with a dual camera setup, allowing comparisons between the two methods to be made.
The modified Sony camera has the most interesting spectral response due to the internal notch filter employed, that appears to block wavelengths between 410~510 nm and 690~790 nm. It was expected that this camera would be responsive to red and
green wavelengths (in their respective channels) with NIR wavelengths only available in the blue channel. However the blue channel also has a peak response at 400 nm, meaning that it does not have a predominately NIR response and so may not be effective if used with a dual camera or single camera setup. An alternative method will likely have to be devised to make use of this cameras spectral sensitivity.
In conclusion, although this paper made use of expensive and sophisticated laboratory equipment in order to capture spectral images of known spectral radiances, it does also demonstrate a quick and cheap method of processing images using open source software in order to identify a cameras spectral sensitivity. Our results showed that different COTS cameras might have very different sensitivities, which highlights the importance of determining the spectral response function if using COTS cameras for quantitative applications.
ACKNOWLEDGEMENTS
Thanks to the Natural Environment Research Council Field Spectroscopy Facility (NERC FSF) for allowing us to use their laboratory facilities and equipment and especially to Christopher MacLellan (NERC FSF) for his advice and help with setting up monochromator and identifying its relative spectral radiance per wavelength
E. Berra would also to thanks Science without Borders Brazil (grant 1121/13-8) for funding his PhD.
REFERENCES
Berni, J. A. J., Zarco-Tejada, P. J., Suárez, L., González-Dugo, V., & Fereres, E. (2009). Remote sensing of vegetation from UAV platforms using lightweight multispectral and thermal imaging sensors. Int. Arch. Photogramm. Remote Sens. Spatial Inform. Sci, 38, 6
Bongiorno, D. L., Bryson, M., Dansereau, D. G., & Williams, S. B. (2013, January). Spectral characterization of COTS RGB cameras using a linear variable edge filter. In Proc. SPIE 8660, Digital Photography IX, pp. 86600N
Brandelero, C., Berra, E.F., Backes, K.S., Pereira, R.S., & Brun, E.J. (2012). Espectrorradiometria na região do visível e do infravermelho próximo em povoamento de Eucalyptus grandis Hill ex Maiden. Ciência Florestal, 22, pp. 215-222
CHDK (2015). CHDK RAW: Unleash the Power in your Canon Powershot. Available at:
http://chdk.wikia.com/wiki/CHDK (accessed: 03/11/2014)
Dare, P. M. (2008). Small format digital sensors for aerial imaging applications. In The international archives of the photogrammetry, remote sensing and spatial information sciences, Vol. XXXVII. Part B1. Beijing.
estimation. Journal of the Optical Society of America A, 32(3), pp. 381-391
DCraw (2015a). DCraw. Available at: http://www.cybercom.net/~dcoffin/dcraw/ (accessed 01/06/2015)
DCraw (2015b). DCraw User Commands. Available at: https://www.cybercom.net/~dcoffin/dcraw/dcraw.1.html (accessed 01/06/2015)
Gehrke, R., & Greiwe, A. (2014). RGBI images with UAV and off-the-shelf compact cameras: an investigation of linear sensor characteristics. EARSeL eProceedings, 13(S1), pp. 53-58
Hunt, E. R., Hively, W. D., Fujikawa, S. J., Linden, D. S., Daughtry, C. S., & McCarty, G. W. (2010). Acquisition of NIR-green-blue digital photographs from unmanned aircraft for crop monitoring. Remote Sensing, 2(1), pp. 290-305
ImageJ (2015). Image Processing and Analysis in Java. Available at: http://imagej.nih.gov/ij/index.html (accessed 01/06/2015)
Jiang, J., Liu, D., Gu, J., & Susstrunk, S. (2013). What is the space of spectral sensitivity functions for digital color cameras? In, Applications of Computer Vision (WACV), 2013 IEEE Workshop on, pp. 168-179
Knight Optical (2015). Optical Filters: 585FAP. Available at: https://www.knightoptical.com/_public/documents/1372681789 _585nmlongpassfilteracryliccolour585fap.pdf (accessed 01/06/2015)
Lebourgeois, V., Bégué, A., Labbé, S., Mallavan, B., Prévot, L., & Roux, B. (2008). Can commercial digital cameras be used as multispectral sensors? A crop monitoring test. Sensors, 8(11), pp. 7300-7322
Luijk (2007). What is DCraw. Avaialble at:
http://www.guillermoluijk.com/tutorial/dcraw/index_en.htm (accessed 01/06/2015)
Nijland, W., de Jong, R., de Jong, S.M., Wulder, M.A., Bater, C.W., & Coops, N.C. (2014). Monitoring plant condition and phenology using infrared sensitive consumer grade digital cameras. Agricultural and forest meteorology, 184, pp. 98-106
Optronic (2002). OL Series 750 Automated Spectroradiometric Measurement System. In, Optronics Lab., Inc., Manual
Rabatel, G., Gorretta, N., & Labbé, S. (2014). Getting simultaneous red and near-infrared band data from a single digital camera for plant monitoring applications: Theoretical and practical study. Biosystems Engineering, 117, pp. 2-14
Rouse, J. W., Haas, R. H., Schell, J. A., & Deering D. W. (1973). Monitoring vegetation systems in the great plains with ERTS. In Proceedings of the 3rd ERTS symposium, pp. 309-317): Vol. 1.
Suzuki, T., Amano, Y., Takiguchi, J., Hashizume, T., Suzuki, S., & Yamaba, A. (2009). Development of low-cost and flexible vegetation monitoring system using small unmanned aerial vehicle. In, ICCAS-SICE, 2009, pp. 4808-4812
Verhoeven, G.J., Smet, P.F., Poelman, D., & Vermeulen, F. (2009). Spectral Characterization of a Digital Still Camera's NIR Modification to Enhance Archaeological Observation. Geoscience and Remote Sensing, IEEE Transactions on, 47(10), pp. 3456-3468
Verhoeven, G.J.J. (2010). It's all about the format-unleashing the power of RAW aerial photography. Int. J. Remote Sens., 31(8), pp. 2009-2042
Zhang, C., & Kovacs, J. M. (2012). The application of small unmanned aerial systems for precision agriculture: a review. Precision agriculture, 13(6), pp. 693-712
APPENDIX
Appendix 1: Script for dark-corrected images generation
1) To generate a dark frame using the dark image (RAW format), execute the command “dcraw -v -D -4 -j -t 0 darkimagefilename.rawfileextension” (Figure 10).
2) Afterwards, the dark frame can be subtracted from the RAW images being processed by using the script command “dcraw -v -r 1 1 1 1 -q 0 -o 0 -4 -j -t 0 –T –K darkimagefilename.pgm *.rawfileextension” (Figure 10), which it will generate linear dark-corrected 16-bit tiff images.
-v Provides textual information about the RAW conversion process.
-D Returns raw data with the original unscaled pixel values.
-4 Generates a linear 16-bit file as its output. -j Does not stretch the image.
-t 0 Disables flipping the output images.
-r 1 1 1 1
Custom white balance for the four channels (1 red, 1 blue, 2 green) by choosing the individual multiplying factors. Using 1 as factor assures that no white balance will be performed.
-q 0 Sets the Bayer demosaicing algorithm to be bilinear.
-o 0 Sets the output colour profile to be none (no colour management).
-T Specifies a TIFF image file as the output file type -K Subtracts a dark frame from the raw data.
Appendix 2: Image Processing using Fiji (ImageJ)
1) Installation: Download the latest stable version (http://fiji.sc/Downloads#Fiji) and then unpack the zip (there is no install).
2) Setup directories: Create an input and an output directory, making sure that there is a RED, GREEN and BLUE subdirectory, and copy the images you want to analyse into the input directory.
3) Execute the script: Execute ImageJ-win64.exe to start Fiji, and from the main menu bar select Plugins->Macros->Edit. Copy the custom script (Appendix 2) into the edit window. On the macro window select Language -> IJ1 Macro and alter the input and output variables to match the input and output directories that you have created. Click on the Run button and the script will process the images showing a log that will say “—PROCESSING COMPLETE—“ when finished.
4) Batch analysis: Return to the Fiji main menu and select Analyze->Set Measurements and ensure that mean grey value and standard deviation value are selected. Go back to the Fiji main menu and selecting Process->Batch->Measure and select your output directory for the relevant colour channel. It should show a results window detailing all of the cropped images and each ones accompanying data.
Appendix 3: ImageJ macro script
// NOTE this should work for any image file size, both tiff (16 bit) and jpg (24 bit)
// input and output directories
// NOTE ensure only image files are present in input and output directory contains RED, GREEN and BLUE folders that are empty!
Input = “C:\\??\\??\\”; output = “C:\\??\\??\\”;
// run in batch mode to speed things up (does not open files etc to the GUI
setBatchMode(true);
// get the file list from the input directory file = getFileList(input);
// loop the file list and process the function for (i = 0; i < file.length; i++)
SplitAndCrop(input, output, file[i]);
setBatchMode(false);
print ("--PROCESSING COMPLETE--");
// this function will open a file, split it into RGB channels,
// crop each channel to a central 9x9 pixel window and the save the crop as a tiff
// select the newely created RGB image (8 bit) and split it into three channels
// set the scale to pixels
run("Set Scale...", "distance=0 known=0 pixel=1 unit=pixel");
print ("Set Scale Done");
// Identify the height and width and set the centre point to use Cwidth = (getWidth()/2)-5;
print ("Width = " + getWidth() + "; Cwidth = " + Cwidth); Cheight = (getHeight()/2)-5;
print ("Height = " + getHeight() + "; Cheight = " + Cheight); // identify bit depth (effects the active window names)
Bdepth = bitDepth();
// select the blue channel image, crop it and save it as tiff if (Bdepth == 16) {
print ("Cropped " + filename + " BLUE");
saveAs("Tiff", output + "BLUE\\" + filename + "_BLUE.tif");
print ("Saved " + filename + " BLUE"); close();
print ("Closed BLUE Channel");
// select the green channel image, crop it and save it as tiff if (Bdepth == 16) {
print ("Cropped " + filename + " GREEN");
saveAs("Tiff", output + "GREEN\\" + filename + "_GREEN.tif");
print ("Saved " + filename + " GREEN"); close();
print ("Closed GREEN Channel");
// select the red channel image, crop it and save it as tiff if (Bdepth == 16) {
print ("Cropped " + filename + " RED");
saveAs("Tiff", output + "RED\\" + filename + "_RED.tif"); print ("Saved " + filename + " RED");
close();