Flow and entrapment of dense nonaqueous phase
liquids in physically and chemically
heterogeneous aquifer formations
Scott A. Bradford*, Linda M. Abriola & Klaus M. Rathfelder
University of Michigan, Department of Civil and Environmental Engineering, 181 EWRE, 1351 Beal Avenue, Ann Arbor, MI 48109-2125, USA
(Received 17 September 1997; accepted 3 March 1998)
The migration and entrapment of dense nonaqueous phase liquids (DNAPLs) in aquifer formations is typically believed to be controlled by physical heterogeneities. This belief is based upon the assumption that permeability and capillary properties are determined by the soil texture. Capillarity and relative permeability, however, will also depend on porous medium wettability characteristics. This wettability may vary spatially in a formation due to variations in aqueous phase chemistry, contaminant aging, and/or variations in mineralogy and organic matter distributions. In this work, a two-dimensional multiphase flow simulator is modified to simulate coupled physical and chemical formation heterogeneity. To model physical heterogeneity, a spatially correlated permeability field is generated, and then related to the capillary pressure-saturation function according to Leverett scaling. Spatial variability of porous medium wettability is assumed to be correlated with the natural logarithm of the intrinsic permeability. The influence of wettability on the hysteretic hydraulic property relations is also modeled. The simulator is then employed to investigate the potential influence of coupled physical and chemical heterogeneity on DNAPL flow and entrapment. For reasonable ranges of wettability characteristics, simulations demonstrate that spatial variations in wettability can have a dramatic impact on DNAPL distributions. Higher organic saturations, increased lateral spreading, and decreased depth of infiltration were predicted when the contact angle was varied spatially. When chemical heterogeneity was defined by spatial variation of organic-wet solid fractions (fractional organic-wettability porous media), however, the resultant organic saturation distributions were more similar to those for perfectly water-wet media, due to saturation dependent wettability effects on the hydraulic property relations.q1998 Elsevier Science Limited. All rights reserved
Keywords: multiphase flow, NAPL, wettability, heterogeneity, numerical model.
NOMENCLATURE D denotes drainage
f weighting function
Fo organic wet mass fraction
g acceleration due to gravity (m/s2)
I denotes imbibition
k intrinsic permeability (m2)
kavg average intrinsic permeability (m2)
kro relative permeability of organic
krw relative permeability of water
m parameter equal to 1¹2/n
Printed in Great Britain. All rights reserved 0309-1708/98/$ - see front matter PII: S 0 3 0 9 - 1 7 0 8 ( 9 8 ) 0 0 0 0 5 - 0
117
n pore size distribution parameter of van Genuchten72capillary pressure model
o organic liquid
Pc capillary pressure (N/m2, cm water)
Pcref capillary pressure at reference location (N/m2, cm water)
P*c capillary pressure that accounts for wettability (N/m2, cm water)
Po pressure of organic phase (N/m2, cm water)
Pw pressure of water phase (N/m2, cm water)
Q source/sink term (g/cm3s)
R pore radius (cm)
s solid
S saturation (cm3/cm3)
Sio ‘immobile’ organic saturation (cm3/cm3)
Siw ‘immobile’ water saturation (cm3/cm3)
Sot entrapped organic saturation (cm3/cm3)
Somax maximum organic saturation (cm3/cm3)
Somin minimum organic saturation (cm3/cm3)
Smot maximum entrapped organic saturation (cm 3
/ cm3)
Smwt maximum entrapped water saturation (cm3/ cm3)
Sro residual organic saturation (cm3/cm3)
S*ro residual organic saturation that accounts for wettability (cm3/cm3)
Srw residual water saturation (cm3/cm3)
S*rw residual water saturation that accounts for wett-ability (cm3/cm3)
Swt entrapped water saturation (cm3/cm3)
Swmax maximum water saturation (cm3/cm3)
Swmin minimum water saturation (cm3/cm3)
SWmin minimum wetting fluid saturation (cm3/cm3)
¯
Seff effective saturation
¯
Sapp apparent saturation
w water
x two-dimensional spatial coordinate vector (m,m)
z vertical direction (m)
a parameter for reciprocal of entry pressure (1/ cm)
b correlation coefficient
« porosity (cm3/cm3)
lref shifting parameter at reference location (cm)
lhysref hysteretic shifting parameter at reference loca-tion (cm)
m viscosity of the fluid (g/cms)
y chemical heterogeneity (Foorfsow)
yavg average chemical heterogeneity (Foorfsow)
yn normalizing factor for chemical heterogeneity (1808or 1)
r density of the fluid (g/cm3)
jow interfacial tension (N/m)
fsow equilibrium contact angle (degree)
1 INTRODUCTION
pore-scale processes such as snap-off,18 or larger scale processes such as aqueous phase by-passing of NAPL filled coarse texture layers,73 and NAPL pooling above low permeability layers. With their focus on soil texture variations, the aforementioned studies have failed to consider the potential influence of chemical heterogeneities, i.e. spatially varying wettability, on NAPL transport and capillary retention.
Wettability, the pore-scale distribution of immiscible fluids near solid surfaces, significantly influences the capil-lary pressure6and relative permeability27relations. Further-more, residual NAPL saturation is known to be sensitive to medium wettability.56In natural porous media the wettabil-ity can vary spatially due to contaminant aging,62 and/or variations in aqueous chemistry,23 mineralogy,4 organic matter distributions,21and surface roughness.54Wettability effects on hydraulic property relations have been reported to be saturation independent25,55 or saturation depen-dent.12,13,15,28,66The latter can occur in fractional wettabil-ity porous media due to the presence of water (w) and organic (o) wet solids. In the petroleum literature, fractional wettability has been recognized as a ubiquitous condition.4–7 The manipulation of soil wettability has been proposed for use in remediation or contaminant migration control through the emplacement of organic-wet zones or the creation of in situ chemical reactions.17,35,36,75For example, Hayworth and Burris35 proposed the use of cationic surfactants to created an enhanced sorption zone for misci-ble organic contaminants. Remediation options such as the use of nonionic surfactants or biodegradation could subse-quently be employed within this enhanced sorbent zone to remove the retained organic contaminants from the aquifer. Note that such remediation approaches are not limited to sorption of soluble organic contaminants, these methods could equally be applied to separate phase organic liquids which are retained by capillary forces in organic-wet zones. The use of organic-wet capillary barriers near landfills and/ or underground storage tanks is an unexplored protective measure for NAPL spill containment.
Multiphase flow simulators are commonly employed to predict the spatial and temporal distributions of organic liquids at hazardous waste sites. Early modeling studies were restricted to homogeneous systems. More recently, studies have explored the role of physical heterogeneities on NAPL migration and entrapment.20,33,44–46 Simulations presented by Kueper and Frind45 and Essaid and Hess33 demonstrate that even relatively minor degrees of physical heterogeneity, can significantly affect the degree of lateral organic spreading. The correlation of intrinsic permeability and capillary pressure relations was also shown to affect the degree of lateral spreading. Kueper and Gerhard46 investi-gated the influence of source size and strength on the infiltration rate and structure of a NAPL spill. Infiltration rates were found to strongly depend on the source size and permeability field correlation structure. Dekker and Abriola20observed increased sensitivity to the permeability distribution statistics and the capillary pressure-intrinsic
permeability correlation for increasing formation heteroge-neity. These authors also demonstrated that the spill release rate, natural hydraulic gradient, and cross-correlation of residual saturations had only minor influence on NAPL distributions in heterogeneous formations. In general, appli-cation of multiphase flow models to laboratory and field data has demonstrated that inclusion of capillary entrapment and hysteresis is essential for accurate description of observed behavior.32,47,60,71Numerical studies further indi-cate that immiscible flow pathways are extremely sensitive to small-scale heterogeneities in permeability and capillary characteristics.20,45All reviewed numerical multiphase stu-dies, however, have assumed that the porous media were strongly water-wet. Based upon predicted sensitivity to capillary behavior, this suggests that large errors may be introduced into numerical simulations when the water-wet assumption does not hold.
In natural subsurface systems highly irregular distribu-tions of NAPLs have been observed.32,60The superposition of physical and chemical heterogeneities in such environ-ments will determine the flow and entrapment behavior of NAPLs. At present, very little research has investigated the influence of wettability on multiphase flow and entrapment. An improved understanding of NAPL migration and entrap-ment in physically and chemically heterogeneous systems should aid in the characterization of contaminant sources in the field and facilitate the development and assessment of remediation strategies. This work presents modifications to a multiphase flow simulator to account for subsurface che-mical and physical heterogeneities. The numerical model is subsequently employed to explore the potential impact that wettability can have on the flow and entrapment of NAPLs in aquifer formations.
2 MODEL DESCRIPTION
The equations for the flow of two immiscible fluids in a porous medium may be written as (e.g. Abriola1):
] where Piis the pressure, Siis the saturation,« is the por-osity of the medium, miis the viscosity, k is the intrinsic permeability, kriis the relative permeability, riis the den-sity, g is the acceleration due to gravity, Qiis a source/sink term, z is the positive downward vertical direction,=is the two-dimensional (cross-sectional) gradient operator, and the subscript i denotes the fluid phases (i.e., i ¼ o,w for organic and water, respectively). The set of partial differ-ential equations given by eqn (1) are coupled through the hydraulic property relations which are discussed in Sections 2.1 and 2.2 of this paper. Mass conservation requires that the following constraint is met:
SoþSw¼1 (2)
of the VALOR model2 known as M-VALOR is used to solve the set of coupled partial differential equations given by eqn (1). M-VALOR is a finite difference code which uses an iterative implicit pressure–explicit saturation (IMPES) scheme to solve the resulting set of algebraic equations. The IMPES scheme solves a set of weakly non-linear equations in Pw using a sparse unsymmetric linear solver employing a variant of Gauss elimination.29,30 Following the solution of the pressure equations, the expli-cit solution for the saturations is obtained using the mass balance expressions. The saturations are then updated in the pressure equation and the process is repeated until conver-gence is achieved. The M-VALOR model has been shown to be a robust, computationally efficient code for the simulation of a wide variety of multiphase flow problems.20,24,63,64
The solution of eqn (1) requires knowledge of the fluid/ matrix flow properties. The generation of spatial distribu-tions of permeability and capillary parameters is discussed below, followed by a description of the modeling of wettability effects on these parameters. Terminology employed in this work pertaining to residual, effective, and apparent saturations under various porous medium wettability conditions is defined in Appendix A. A discus-sion of the influence of wettability on fluid entrapment is also provided in Appendix A. For the reader’s convenience, a notation section is included at the beginning of the paper.
2.1 Spatial variability of parameters
In physically heterogeneous porous media the intrinsic per-meability varies spatially with changes in soil texture. The turning bands method69 was used in this work to generate spatially correlated heterogeneous permeability distribu-tions for model input. This method assumes a log normal distribution of the intrinsic permeability68,74with a specified mean and covariance structure. The spatial correlation structure of intrinsic permeability is described using an exponentially decaying covariance function.68
Two methods for describing formation chemical hetero-geneity are considered herein: specification of the contact angle (fsow) or of the organic-wet solid mass fraction (Fo). The contact angle is an index of wettability that is typically measured by placing a drop of the organic liquid on a flat solid that is immersed in water. The contact angle is then defined as the angle between the solid–water and
water–organic contact lines. Contact angles measured in this manner, however, are only a crude approximation to those governing behavior in natural porous media due to spatial variability in the local solid surface wetting charac-teristics. Alternatively, capillary pressure data may be used to infer an effective or ‘macroscopic’ contact angle of the porous medium (cf. Eqn (15)).12,55Subsequent references to
fsowin this work refer to such a macroscopic concept of the contact angle. When fsow , 908 water is classified as the wetting fluid, whereas, forfsow. 908the water is the nonwetting fluid (neutral wettability occurs forfsow¼908). Values of Foare used herein to quantify the wettability of systems in which both water- and organic-wet solids occur at the pore-scale. Under conditions of fractional wettability, macroscopic wettability behavior has been found to depend on the saturation history.13
At present, there is a paucity of data on subsurface varia-tions in wetting properties. Treiber et al.70and Chilingar and Yen19 measured contact angles for various polished core samples and petroleum reservoir fluids; however, no systematic study of contact angle variations for a single reservoir or aquifer has been reported. Some information, however, is available pertaining to the spatial variability of adsorption parameters at the field scale.34,65 In these and related theoretical investigations, adsorption parameters have been assumed to be correlated with subsurface physi-cal heterogeneity.9,10,34,40,53,76 In this work the contact angle or organic-wet fraction is similarly considered to be correlated with the intrinsic permeability. To account for the correlation between chemical (contact angle or organic-wet fraction) and physical (intrinsic permeability) heterogeneity, the following exponential relationship is employed:
Here y denotes the porous medium wettability parameter (fsow or Fo), x is the two-dimensional spatial coordinate vector, b is the correlation coefficient, and yavg and kavg are the geometric mean of the wettability parameter and intrinsic permeability, respectively. Note that ln(k(x)) and ln(y(x)) are positively correlated for 0,b#1, and nega-tively correlated for ¹1 # b, 0. Values ofbcloser to zero indicate a weaker correlation.
In this work, the capillary pressure (Pc)–saturation rela-tions are directly correlated with the intrinsic permeability
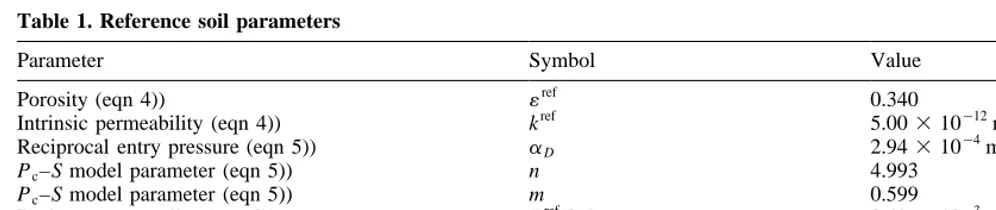
Table 1. Reference soil parameters
Parameter Symbol Value
Porosity (eqn 4)) «ref
0.340
Intrinsic permeability (eqn 4)) kref 5.00310¹12
m2
Reciprocal entry pressure (eqn 5)) aD 2.94310¹4m2/N
Pc–S model parameter (eqn 5)) n 4.993
Pc–S model parameter (eqn 5)) m 0.599
field according to Leverett scaling:50 as the wetting phase,S¯appw is the apparent water saturation
which is defined in Appendix A, and the superscript ‘ref’ denotes the indicated parameters for the reference soil. Researchers have found that Leverett scaling yields reason-able predictions of Pc–S relations for unconsolidated sands45,50 and sandstones.31 Table 1 provides values of the reference parameters employed herein. In this work the porosity is assumed to be constant («(x)¼«ref) through-out the simulation domain.
The reference Pc–S relation in eqn (4), denoted with superscript ‘ref’, is described with the van Genuchten72
Pc–S model:
where n is related to the slope at the inflection point of the
Pc–S curve,aD,Iis the reciprocal of the entry pressure that depends on whether water is draining (D) or imbibing (I), and m was chosen to be equal to 1¹2/n to facilitate the implementation of the relative permeability model (eqns (12) and (13)). The reference soil was chosen such that water perfectly wets the solid surface (fsow ¼ 08). Consequently, the Pc–S relations generated for other loca-tions according to eqn (4) are also for perfectly wetted media.
2.2 Wettability effects on hysteretic hydraulic properties
The procedure for incorporating the influence of wettability on the hydraulic property relations, at a given spatial loca-tion, is discussed below. When fsow is independent of saturation, wettability effects on the Pc–S relations are obtained by scaling the perfectly wetted capillary pressure relation (cf. Eqn (4)) with the macroscopic contact angle at that spatial location:
HereS¯appW is the apparent wetting fluid saturation which is defined in Appendix A, and Pp
c denotes the wettability
dependent capillary pressure (Po–Pw). Note that Ppc and Pc are functions of S¯
app
W , since Pc (cf. Eqn (4)) is also written in terms of the wetting fluid saturation. Conse-quently,S¯appW equalsS¯ accounted for herein by makingaI(cf. Eqn (5)) a function of the effective minimum wetting fluid saturation (S¯effWmin),
which determines the maximum amount of entrapped
nonwetting fluid (cf. Appendix eqn (A7)), as:
aI¼(2¹S¯
eff
Wmin)aD (7)
Recall that S¯effWmin equals the effective minimum water
saturation (S¯effwmin)for fsow , 908, and the effective mini-mum organic saturation(S¯effomin)forfsow.908. The value of
aDis assumed to be constant in time. Note thataI ¼2aD whenS¯effWmin¼0 as suggested by the data presented by Kool
and Parker.42At saturation reversal points (a change from imbibition to drainage, or drainage to imbibition) the value ofawas empirically transitioned fromaIto/fromaDover a saturation range of 0.05 to insure a smooth change in capil-lary pressure.
For fractional wettability soil (saturation dependent wettability) the Pc(S¯
app
w )relation (eqn (4)) is ‘shifted’:
14
wherelD,Irefis the shifting parameter that depends on Foand whether water is draining or imbibing. Here jow is the interfacial tension, and RD,I(0.5) is the value of the pore radius that empties during main drainage and imbibition at an apparent water saturation equal to 0.5 (RD,I(0.5) ¼ 2jow/Pc(0.5)). Table 1 provides values for the correspond-ing reference soil parametersjowrefand RD,Iref(0.5). Note in eqn (8) that lD,Iref is scaled by the ratios R
ref
D;Ið0:5Þ=RD;Ið0:5Þand
jow/jowref to account for differences in the pore size and interfacial tension, respectively, of the reference system and other fluid-porous medium systems. Bradford and Leij14 derived the following regression relations, which are employed herein, from fitted values of lD,Iref (units in cm of water) to fractional wettability main drainage and imbibition Pc–S data:
lrefD(Fo)¼11:35pFoþ1:81 (r Hysteresis in the fractional wettability Pc–S curve is also modeled by makingaIa function of the effective minimum water saturation as in eqn (7). In addition, the dependence of lD,Iref onS¯
eff
wmin must also be considered since the porous
medium is initially water saturated. In this case it is assumed thatlD,Irefdepends onS¯
eff shift parameter modified for hysteresis. Note that according to eqn (11) the value of lhysref is zero at complete water saturation, and maximum at the residual water saturation (lhysref ¼0 forS¯
eff
wmin¼1, andlhysref ¼lD,IrefforS¯
eff wmin¼0).
Bradford et al.:11
HereS¯effw, S¯ eff o , S¯
eff wt, andS¯
eff
ot are the effective water, organic,
entrapped water, and entrapped organic saturations, respec-tively, which are discussed in more detail in Appendix A,
R(S) is the pore radius distribution (R(Sw)¼Pc(Sw)/2jow), and S is a dummy saturation variable of integration. The empirical weighting function in eqn (12) and eqn (13),
f(fsow), is defined as:
f(fsow)¼
1
2 1¹cos(fsow)
(14)
Eqn (12) and eqn (13) are based upon the division of pores into two wettability classes. The first and second
expressions on the right-hand side of eqn (12) and eqn
(13) are determined by the pore class of the wetting and nonwetting fluid, respectively. The wettability of the porous medium is used to determine the contributions of the pore classes to kraccording to eqn (14). Tortuosity of the flow path is empirically accounted for in eqn (12) and eqn (13) with (S¯effw ¹S¯
eff wt)
2
and (S¯effo ¹S¯ eff ot)
2
, respectively. Eqn (12) and eqn (13) predict that an increase in the contact angle (measured through water) will be accompanied by an increase in the water kr and a decrease in the organic kr. Such behavior is consistent with experimental observations of Donaldson and Dean,26 Owens and Archer58 and McCaffery and Bennion.52
krw(S app
w )¼ S
eff w ¹S¯
eff wt
2 1¹f(fsow)
Z
¯
Sappw
0 R(S) 2dS
þf(fsow) Z1
1¹S¯appw R(S)
2dS
Z1
0R(S) 2dS
(12)
kro(S¯ app o )¼(S¯
eff o ¹S¯
eff ot)2
f(fsow) Z¯Sappo
0 R(S) 2dS
þ 1¹f(fsow)
Z
1
1¹¯Sappo R(S)
2dS
Z1
0R(S) 2dS
(13)
The above relative permeability relationships also depend on saturation history as a result of nonwetting fluid entrap-ment. Similar to the procedure of Lenhard and Parker,49eqn (12) and eqn (13) account for nonwetting fluid entrapment through the dependence of the relative permeabilities on apparent saturations. Additionally, the reduction in pore space accessible for fluid flow due to nonwetting fluid entrapment must be considered. This is accomplished ana-logous to the procedure employed by Lenhard and Parker.49 The details of this additional modification are not given in eqn (12) and eqn (13) for simplicity.
The calculation of relative permeability relations accord-ing to eqn (12) and eqn (13) is straightforward when wett-ability effects are independent of saturation, i.e. when there is a constant contact angle at a given location. For the case of fractional wettability the contact angle at a given location is saturation dependent. This saturation dependence can be estimated from Pc–S data according to scaling arguments as:12
fsow(S¯appw )¼cos
¹1 Ppc(S¯ app w ) Pc(S¯
app w )
(15)
where Pp c(S¯
app
w )is given by eqn (8) and Pc(S¯ app
w )is given by
eqn (4). The calculated value offsow(S¯ app
w )is subsequently
used in eqns (12)–(14) to estimate the relative permeability relations.
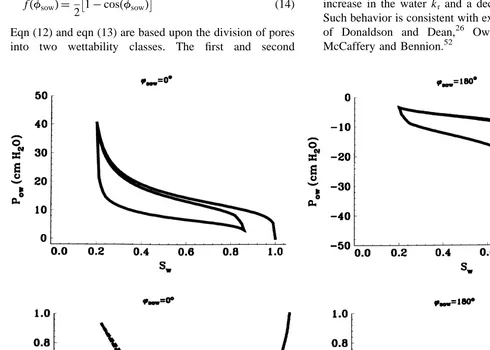
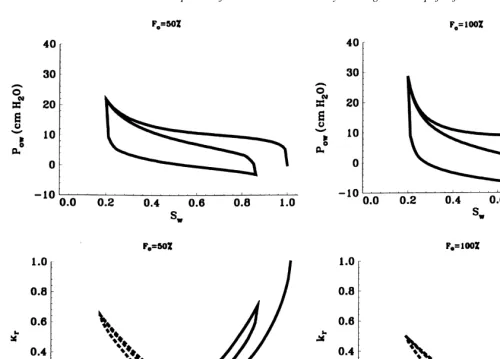
Eqns (3)–(15) comprise the hydraulic property model that was implemented in M-VALOR to account for physical and chemical heterogeneity. To illustrate results from this constitutive model, Figs 1 and 2 show predicted hysteretic
Pc–S–krrelations whenfsow¼0 and 180 degrees, and when
Fo¼50 and 100%, respectively (cf. Table 1 for reference soil characteristics). Note in Figs 1 and 2 that very different hydraulic property relations can be obtained for a given porous medium simply by assuming different wettability characteristics. The capillary pressure curves can have exclusively positive or negative values of capillary pressure (Pow¼Po¹Pw) as shown in Fig. 1, or can exhibit satura-tion dependent wettability effects as demonstrated in Fig. 2. Porous media with saturation dependent wettability have distinct differences in hydraulic property relations for the various drainage and imbibition cycles; i.e., positive and negative Pc which depends on the saturation history. The relative permeability relations are also dramatically influenced by wettability effects due to differences in the pore-scale fluid configuration and entrapment.
3 SIMULATIONS
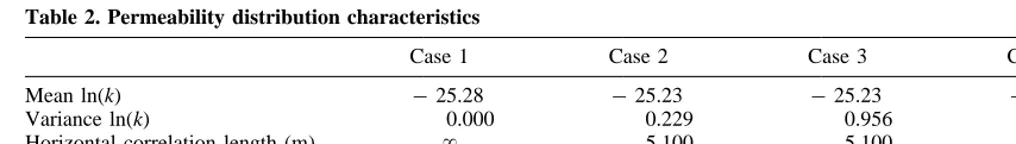
The simulated release and redistribution of tetrachloroethy-lene (PCE) in one- and two-dimensional subsurface systems is presented below. The relevant physical properties of PCE that were employed in simulations are: density equal to 1625.0 kg/m3, viscosity equal to 0.00089 kg/ms, and inter-facial tension equal to 0.045 N/m. Table 2 contains a summary of the simulated permeability distribution charac-teristics. Other parameters employed in the simulations are given in Table 1. Case #1 is for a physically homogeneous soil column, case #2 employs formation statistics of the Borden aquifer,74case #3 utilizes formation statistics simi-lar to an aquifer characterized by Jussel et al.,39and case #4 is for a highly variable hypothetical aquifer. Dekker and Abriola20recently conducted a systematic investigation of the effects of physical heterogeneity on PCE infiltration and redistribution for cases #2 and #3. The influence of porous medium wettability on PCE migration and entrapment is investigated in the physically homogeneous soil column simulations (Case #1). The coupling of physical and chemi-cal heterogeneity is explored with cases #2–#4. Note in Table 2 that physical heterogeneity increases with the variance of the natural logarithm of the intrinsic permeabil-ity. Specific information on the nodal spacing, and boundary and initial conditions is given below.
3.1 Physically homogeneous soil column
In this section results from one-dimensional simulations of PCE infiltration and redistribution into a physically homo-geneous soil column (cf. Table 2 case #1) having various chemical characteristics will be presented. The model
domain consists of an initially water saturated domain that extends 5 m in the vertical direction. Nodal spacing in the vertical direction was 0.1 m. A no flow boundary condition for water was enforced at the top of the model domain, while constant hydrostatic pressure boundary conditions (referenced to atmospheric pressure at the domain surface) were employed at the bottom boundary. A constant infiltra-tion velocity of 1.5 cm/day of PCE was initially introduced at the top node over a period of 5 days, after which a no flow boundary condition was set at the top node while PCE was allowed to redistribute.
Fig. 3 shows the predicted PCE saturation distribution with depth (cf. Table 2 case #1) after 10 days for contact angles equal to 08, 458, 908, 1358, and 1808. Demond22 reported that the contact angle for PCE measured through water was 308on calcite, 668on glass, and 1278on Teflon. Note in Fig. 3 that a lower depth of PCE infiltration and, hence, higher organic saturation are predicted as fsow increases. The observed trends in Fig. 3 occur due to decreasing kro and Pc with increasing contact angles. Hence, the mobility of the organic decreases and the porous medium retains the organic more effectively.
Fig. 4 shows the PCE saturation distribution with depth after 10 days (cf. Table 2 case #1) for porous media having organic-wet mass fractions equal to 0, 25, 50, 75, and 100%. Similar to Fig. 3, observe in Fig. 4 that a lower depth of PCE infiltration and higher organic saturation are also achieved as the organic-wet fraction increases. Comparison of Figs 3 and 4 reveals that wettability effects on the predicted satura-tion distribusatura-tion were much more pronounced for systems having a constant contact angle (Fig. 3) than for fractional wettability media (Fig. 4). To explain these trends the dependence of lhysref on S¯
eff
wmin (cf. Eqn (11)) must be
Table 2. Permeability distribution characteristics
Case 1 Case 2 Case 3 Case 4
Mean ln(k) ¹25.28 ¹25.23 ¹25.23 ¹25.19
Variance ln(k) 0.000 0.229 0.956 1.912
Horizontal correlation length (m) ` 5.100 5.100 5.100
Vertical correlation length (m) ` 0.210 0.210 0.210
Anisotropy factor 1.000 0.500 0.500 0.500
Fig. 3. PCE saturation distribution with depth after 10 days for
contact angles equal to 08, 458, 908, 1358, and 1808.
Fig. 4. PCE saturation distribution with depth after 10 days for
considered. For the systems shown in Fig. 4 the value of
¯
Seffwminwas greater than 90% and, hence, only a small portion
of the potentially organic-wet sites were exposed to organic liquid. Increasing the infiltration rate would lead to lower values of S¯effwmin and, consequently, the predicted organic
liquid distribution would become more similar to that shown in Fig. 3.
Capillary barrier effects on organic liquid migration are known to occur at soil textural interfaces, due to abrupt changes in the pore size distribution (i.e., Wilson et al.73). Barrier effects can also occur at interfaces denoting a change in soil surface wetting characteristics. Fig. 5 shows the distribution of PCE with depth after 10 days (cf. Table 2 case #1) when the top 0.5 m of soil is organic-wet and the bottom 4.5 m are water-wet. Note that very high organic saturations are achieved at the interface separating organic-and water-wet soils. Before PCE can displace water from the water-wet layer, the PCE entry pressure in this layer must be exceeded. This can only occur after the capillary pressure in the organic-wet layer approaches zero (high PCE saturations). A maximum organic saturation of 85%
occurred in Fig. 5 compared with 25% in the chemically homogeneous systems (cf., Fig. 3). Fig. 5 demonstrates that organic-wet zones can create regions of high organic liquid saturation in physically homogeneous subsurface systems. This result is consistent with field observations, Atwater8
Fig. 5. PCE saturation distribution with depth after 10 days when
the top 0.5 m of soil is organic-wet and the bottom 4.5 m are water-wet.
Fig. 6. Permeability distribution employed for case #2 simulations.
Fig. 7. PCE saturation distribution after 10 days for case #2 when
fsow¼08.
Fig. 8. Spatial distribution offsowaccording to eqn (3) for case #2 whenbis equal to 1 (a) and ¹0.5 (b) and the geometric mean of
reported the presence of high DNAPL (a dielectric fluid containing PCBs and TCB) saturations in an organic-wet clay immediately above a water-wet silt at a hazardous waste site in Regina, Canada.
3.2 Physically heterogeneous aquifers
This section presents results from two-dimensional simula-tions of PCE infiltration and redistribution for cases #2, #3, and #4 (cf. Table 2) having various chemical characteristics. The model domain consists of a 5 m310 m vertical cross-section of an initially water saturated aquifer. Nodal spacing in the vertical and horizontal directions was 0.1 m and 0.5 m, respectively. No flow boundary conditions were enforced at the top and bottom of the model domain, while hydrostatic pressure boundary conditions were employed at the left and right boundaries (referenced to atmospheric pressure at the domain surface). A constant infiltration velocity of 3 cm/day of PCE was introduced at the top center node for a period of 5 days, after which a no flow boundary condition was maintained at this node while PCE was allowed to redistribute.
Fig. 6 shows the generated permeability distribution for case #2. The mean intrinsic permeability, and correlation lengths in the horizontal and vertical directions for this aquifer are given in Table 2. Fig. 7 shows the simulated
distribution of organic liquid saturation after 10 days for case #2 when a constant value of fsow equal to 08 is assumed. Note that the PCE saturation is rather symmetri-cally distributed below the injection point. Increased lateral spreading occurs at textural interfaces due to capillary bar-rier effects, even for the relatively low degrees of physical heterogeneity present in this scenario.
Simulations were subsequently conducted to examine the effects of coupled physical and chemical heterogeneity on the infiltration and redistribution of the PCE for case #2. Spatial distributions of fsow were first generated from the intrinsic permeability distribution according to eqn (3) with
bequal to 1.0, 0.5, ¹0.5, and ¹1.0. As an illustration, Fig. 8a,b shows the spatial distribution offsowwithb equal to 1.0, and ¹0.5, respectively. In all cases, the mean value of
fsow was set equal to 668; the reported value of the PCE contact angle measured through water on glass.22Note that locations of higher contact angles are correlated with the coarser textured soils whenb. 0, and with finer soils for
b , 0. Values ofb closer to zero (0.5 and ¹0.5) led to decreased variability in the contact angle distribution than whenb¼1 or ¹1.
Fig. 9a–d presents the spatial distribution of organic liquid saturation after 10 days when the contact angle distributions were determined with b ¼ 1.0, 0.5, ¹0:5, and ¹1:0, respectively. Observe in Fig. 8a,b and Fig. 9a,c that
Fig. 9. Spatial distribution of PCE saturation after 10 days for case #2 when the contact angle distribution was determined according to
higher organic liquid saturations occur in regions having higher contact angles. Note that the depth of PCE infiltration increases and lateral spreading decreases when b ¼ 1 in comparison with the case b ¼ ¹ 1 (Fig. 9a,d). Recall that, for a given contact angle, stronger capillary forces and lower intrinsic permeability occur in finer than in coarser textured soils, which will cause the organic liquid to be more forcefully retained. In Fig. 9a,d the organic liquid is primarily retained/found in the coarser and finer textured soils, respectively, due to the spatial distribution of contact angles and, consequently, the mobility of the organic is greater in Fig. 9a (b ¼ 1) than in Fig. 9d (b ¼ ¹ 1). Comparison of Fig. 9b (b¼0.5) and Fig. 9c (b¼ ¹0.5) reveal similar tends. In this case, however, the decreased variability in the contact angle distribution (cf. Fig. 8a,b) diminishes the potential capillary barrier effects that can occur at soil chemical property interfaces.
Comparison of Figs 7, and 9a–d demonstrate the poten-tial importance of chemical heterogeneity on the migration of organic liquids in the subsurface. In chemically hetero-geneous systems much higher organic saturations are achieved, lateral spreading is increased, and the depth of organic liquid penetration is decreased compared with the water-wet case. Similar to Fig. 5, this result can be explained by capillary barrier effects; i.e., the PCE entry
pressure of the more water-wet layer is not exceeded until the PCE saturation in the more organic-wet layer increases. Sharp contrasts in soil texture can yield similar capillary barrier effects on organic liquid migration (e.g., Kueper et al.43).
Spatial distributions of Fowere also generated from the intrinsic permeability shown in Fig. 6 according to eqn (3) withbequal to 1 and ¹1. In this case, the mean value of Fo was chosen to be equal to 36.6%, based upon the previously employed mean value of fsow ¼ 668 and the maximum contact angle of 1808; i.e., 66/180 ¼ 0.366. Fig. 10a,b shows the spatial distribution of organic liquid saturation after 10 days whenb¼1 and ¹1, respectively. Observe that whenb¼ ¹1 (Fig. 10b) the saturation distribution is almost identical to the strongly water-wet case (Fig. 7). For
b ¼ 1 (Fig. 10a) wettability effects are more pronounced than whenb¼ ¹1, but still much less significant than those shown in Fig. 9d, where contact angles were independent of saturation. Similar to Fig. 4, the observed PCE saturation distribution can be explained by considering the dependence of the hydraulic properties onS¯effwmin. For a given Fo, water is retained more strongly by the finer soils than the coarser soils. Consequently, lower values ofS¯effwmin(higher organic
saturation) are possible in the coarser textured soils. Hence, fractional wettability effects on the organic saturation distribution are more apparent when Fois positively corre-lated with intrinsic permeability (the coarser textured media). In contrast to Fig. 10a,b, when wettability is inde-pendent of S¯effwmin (constant contact angle) the influence on
the spatial distribution of organic liquid (Fig. 9a,d) was more pronounced whenb¼ ¹1 than forb¼1.
Fig. 11a,b shows the organic liquid distribution after 10 days for cases #3 and #4, respectively, when fsow ¼ 08. Comparison of Figs 7, and 11a,b reveals that increasing the variance in ln(k) leads to increased lateral spreading, and a decrease in the depth of penetration of PCE as has been previously reported.20,33,45 Note that higher organic saturations occur in regions of higher intrinsic permeability since finer textured soils act as a capillary barrier to organic liquid entry.
Coupled chemical and physical heterogeneity scenarios similar to those performed for case #2 were carried out for cases #3 and #4. Fig. 12a,b shows the organic liquid dis-tribution after 10 days for cases #3 and #4, respectively, when the contact angle is perfectly correlated with the intrinsic permeability (b ¼1) and the mean value offsow was again set equal to 668. Note that as the variance of the permeability increases (cf. Fig. 11a and Fig. 12a, and Fig. 11b and Fig. 12b), the influence of wettability on the organic saturation distribution becomes less apparent. Similar results were obtained when the contact angle was negatively correlated with the intrinsic permeability. This observation suggests that spatial variations in contact angles can poten-tially be a controlling factor of organic liquid distribution in systems with lower degrees of physical heterogeneity such as many sandy aquifer formations.37,39,67,68,74
Fig. 13 shows the organic saturation distribution after 10 days for case #3 when the organic-wet fraction is perfectly
Fig. 10. Spatial distribution of PCE saturation after 10 days for
case #2 when the organic-wet fraction distribution was determined according to eqn (3) withb¼1 (a) and ¹1 (b), and the geometric
correlated with the intrinsic permeability (b ¼ 1) and the mean value of Fois again set equal to 36.6%. Comparison of the organic saturation distributions for completely water-wet and fractional water-wettability (b ¼ 1) aquifers for cases #2 (Figs 7, and 10a) and #3 (Fig. 11a and Fig. 13) reveals an increased impact of fractional wettability on the distribu-tions with increasing physical heterogeneity. This result occurs due to the dependence of the fractional wettability hydraulic property relations on the historic minimum water saturation. Increases in the permeability variance leads to sharper contrasts in soil texture (capillary barriers) which result in higher organic saturations (cf. Fig. 7, Fig. 11a, and Fig. 11b). The presence of fractional wettability further accentuates such capillary barrier effects due to its impact on the hydraulic property relations (i.e., decreasing kroand
Pc at a given saturation) as S¯
eff
wmin decreases. In contrast,
when ln(Fo) and ln(k) are inversely related (b ¼ ¹ 1) increasing the physical heterogeneity will not greatly affectS¯effwminin the finer textured soils and, hence, fractional
wettability has little impact on the predicted organic satura-tion distribusatura-tions.
4 SUMMARY AND CONCLUSIONS
This work represents the first attempt to simulate the influence of wettability on organic liquid migration and
entrapment. Modifications to a multiphase flow simulator are given to account for chemical, as well as, physical heterogeneities. Physical heterogeneity was simulated with a spatially variable distribution of intrinsic permeability having specified statistics and correlation structure accord-ing to the turnaccord-ing bands method. Soil chemical heterogene-ity was assumed to alter the wettabilheterogene-ity properties of the
Fig. 11. Spatial distribution of PCE saturation after 10 days for
cases #3 (a) and #4 (b), whenfsow¼08.
Fig. 12. Spatial distribution of PCE saturation after 10 days for
cases #3 (a) and #4 (b), respectively, when the contact angle distribution was determined according to eqn (3) with b ¼ 1
and the geometric mean offsow¼668.
Fig. 13. Spatial distribution of PCE saturation after 10 days for
case #3 when the organic-wet fraction distribution was determined according to eqn 3) withb¼1 and the geometric mean of Fo¼
subsurface through variations in contact angle or organic-wet mass fraction. Spatial distributions of chemical hetero-geneity were generated by correlation with the intrinsic permeability. Capillary properties were obtained from the intrinsic permeability according to Leverett scaling. Wett-ability effects on the capillary pressure-saturation relations were modeled by contact angle scaling or curve ‘shifting’ (fractional wettability systems), according to a previously developed correlation. Wettability effects on relative per-meability relations were modeled with a Burdine model, modified to weight contributions of wetting and nonwetting fluid pore classes.11
One-dimensional simulations in physically homogeneous porous media demonstrated that as the contact angle or organic-wet fraction increased, the maximum organic liquid saturation increased and the depth of infiltration decreased. Wettability effects on the predicted organic saturation dis-tribution were found to be more pronounced for increasing contact angles than for increasing organic-wet fractions (fractional wettability). This result was attributed to the dependence of the fractional wettability hydraulic proper-ties on the historic minimum water saturation. Simulations also demonstrated that capillary barrier effects can occur at soil chemical property interfaces. The presence of such bar-riers can lead to dramatically higher organic liquid saturations. Two-dimensional simulations for coupled physically and chemically heterogeneous aquifers revealed that the presence of chemical heterogeneities can dramatically influence the predicted distribution of organic saturation in aquifer formations. Higher organic saturations, increased lateral spreading, and decreased infiltration depth of the organic plume were predicted when the contact angle was negatively correlated with the intrinsic permeability. Simi-lar effects were observed when the contact angle was posi-tively correlated with the intrinsic permeability, but to a lesser extent due to decreased capillary forces and increased permeability of coarser textured soils. Spatial distributions of contact angles had a greater influence on the predicted organic saturation distribution for systems having a lower variance in permeability, i.e., lower degrees of physical heterogeneity. When chemical heterogeneity was repre-sented with spatial distributions of organic-wet solid fractions, the predicted organic saturation distributions were much more similar to those for the perfectly water-wet scenarios. In general, fractional water-wettability effects on organic saturation distributions were found to be more pronounced for systems which achieved lower water satura-tions; i.e., when the organic-wet fraction was positively correlated with the intrinsic permeability, and for systems having a larger variance in permeability. As in the one-dimensional case, these observations were attributed to the dependence of the fractional wettability hydraulic proper-ties on the historic minimum water saturation.
There is presently a need to quantify the spatial distribu-tion of wettability properties in natural aquifer formadistribu-tions. Results presented herein indicate that knowledge of the wettability distribution may be of at least equal importance
as the intrinsic permeability distribution in some systems. The evolution of wettability as a function of saturation and concentration history is another area which should be addressed in future studies. Work is ongoing to test and refine the modeling of wettability effects on hydraulic prop-erty relations. A more complete understanding of the influ-ence of wettability on entrapment and capillary behavior may also lead to improved methods for aquifer remediation and control of organic liquid migration.
ACKNOWLEDGEMENTS
Funding for this research was provided by the Depart-ment of Energy under Grant # DE-FG07-96ER14702. The research described in this article has not been subject to Agency review and no official endorsement should be inferred.
REFERENCES
1. Abriola, L. M. Modeling multiphase migration of organic chemicals in groundwater systems—A review and assess-ment. Environ. Health Perspect., 1989, 83, 117–143. 2. Abriola, L. M., Rathfelder, K., Maiza, M. and Yadav, S.,
VALOR code version 1.0: A PC code for simulating immis-cible contaminant transport in subsurface systems, EPRI TR-101018, Project 2879-08, Final Report, September, 1992. 3. Al-Fossail, K. and Handy, L. L. Correlation between
capil-lary number and residual saturation. J. Colloid Interface Sci., 1990, 134, 256–263.
4. Anderson, W. G. Wettability literature survey—Part 1: Rock/oil/brine interactions and the effects of core handling on wettability. J. Petrol. Technol., 1986, 38, 1125–1144. 5. Anderson, W. G. Wettability literature survey—Part 2:
Wett-ability measurement. J. Petrol. Technol., 1986, 38, 1246– 1261.
6. Anderson, W. G. Wettability literature survey—Part 4: Effects of wettability on capillary pressure. J. Petrol. Tech-nol., 1987, 39, 1283–1300.
7. Anderson, W. G. Wettability literature survey—Part 5: The effects of wettability on relative permeability. J. Petrol. Technol., 1987, 39, 1453–1467.
8. Atwater, J. W. A case study of a chemical spill: Polychlori-nated biphenyls (PCBs) revisited. Water Resour. Res., 1984,
20, 317–319.
9. Bellin, A., Rinaldo, A., Bosma, W. J. P., van der Zee, S. E. A. T. M. and Rubin, Y. Linear equilibrium adsorbing solute transport in physically and chemically heterogeneous porous formations, 1. Analytical solutions. Water Resour. Res., 1993, 29, 4019–4031.
10. Bosma, W. J. P., Bellin, A., van der Zee, S. E. A. T. M. and Rinaldo, A. Linear equilibrium adsorbing solute transport in physically and chemically heterogeneous porous formations, 2. Numerical results. Water Resour. Res., 1993, 29, 4031– 4043.
11. Bradford, S. A., Abriola, L. M. and Leij, F. J. Wettability effects on two- and three-fluid relative permeabilities. J. Contam. Hydrol., 1997, 28, 171–191.
13. Bradford, S. A. and Leij, F. J. Fractional wettability effects on two- and three-fluid capillary pressure–saturation rela-tions. J. Contam. Hydrol., 1995, 20, 89–109.
14. Bradford, S. A. and Leij, F. J. Predicting two- and three-fluid capillary pressure–saturation relationships in fractional wett-ability media. Water Resour. Res., 1996, 32, 251–260. 15. Brown, R. J. S. and Fatt, I. Measurements of fractional
wett-ability of oilfield rocks by the nuclear magnetic relaxation method. Trans. Am. Inst. Min. Metall. Pet. Eng., 1956, 207, 262–264.
16. Burdine, N. T. Relative permeability calculations from pore-size distribution data. Trans. Am. Inst. Min. Metall. Pet. Eng., 1953, 198, 71–77.
17. Burris, D. R. and Antworth, C. P. In situ modification of an aquifer material by a cationic surfactant to enhance retarda-tion of organic contaminants. J. Contam. Hydrol., 1992, 10, 325–337.
18. Chatzis, I., Morrow, N. R. and Lim, H. T. Magnitude and detailed structure of residual oil saturation. Soc. Petrol. Eng. J., 1983, 23, 311–326.
19. Chilingar, G. V. and Yen, T. F. Some notes on wettability and relative permeabilities of carbonate reservoir rocks, II. Energy Sources, 1983, 7, 67–75.
20. Dekker, T. J. and Abriola, L. M., The influence of field-scale heterogeneity on the infiltration and entrapment of dense nonaqueous phase liquids in saturated formations. J. Contam. Hydrol., submitted.
21. Dekker, L. W. and Ritsema, C. J. How water moves in a water repellent sandy soil, 1, potential and actual water repel-lency. Water Resour. Res., 1994, 30, 2507–2519.
22. Demond, A. H., Capillarity in two-phase liquid flow of organic contaminants in groundwater. Ph.D. thesis. Stanford University, Stanford, CA, 211 pp., 1988.
23. Demond, A. H., Desai, F. N. and Hayes, K. F. Effect of cationic surfactants on organic liquid–water capillary pres-sure–saturation relationships. Water Resour. Res., 1994, 30, 333–342.
24. Demond, A. H., Rathfelder, K. and Abriola, L. M. Simulation of organic liquid flow in porous media using estimated and measured transport properties. J. Contam. Hydrol., 1996, 22, 223–240.
25. Demond, A. H. and Roberts, P. V. Effect of interfacial forces on two-phase capillary pressure–saturation relationships. Water Resour. Res., 1991, 27, 423–437.
26. Donaldson, E. C. and Dean, G. W., Two- and Three-phase Relative Permeability Studies. U.S. Bureau of Mines, Report #6826, Washington, DC, 1966.
27. Donaldson, E. C. and Thomas, R. D., Microscopic observa-tions of oil displacement in water-wet and oil-wet systems, SPE paper # 3555, SPE Annual Meetings, New Orleans, LA, 1971.
28. Donaldson, E. C., Thomas, R. D. and Lorenz, P. B. Wett-ability determination and its effect on recovery efficiency. Soc. Petrol. Eng. J., 1969, 9, 13–20.
29. Duff, I. S., MA28—A set of fortran subroutines for sparse unsymmetric linear equations, Report No. AERE-R.8730, AERE Harwell Laboratories, Oxford, UK, 1979.
30. Duff, I. S., Enhancements to the MA32 package for solving sparse unsymmetric equations, Report No. AERE-R.11009, AERE Harwell Laboratories, Oxford, UK, 1989.
31. Dumore, J. M. and Schols, R. S. Drainage capillary-pressure functions and the influence of connate water. Soc. Petrol. Eng. J., 1974, 14, 437–444.
32. Essaid, H. I., Herkelrath, W. N. and Hess, K. M. Simulation of fluid distributions observed at a crude oil spill site incor-porating hysteresis, oil entrapment, and spatial variability of hydraulic properties. Water Resour. Res., 1993, 29, 1753– 1770.
33. Essaid, H. I. and Hess, K. M. Monte Carlo simulations of multiphase flow incorporating spatial variability of hydraulic properties. Ground Water, 1993, 31, 123–134.
34. Garabedian, S. P., LeBlanc, D. R., Gelhar, L. W. and Celia, M. A. Large-scale natural gradient tracer test in sand and gravel, Cape Cod, Massachusetts, 2, Analysis of spatial moments for a nonreactive tracer. Water Resour. Res., 1991, 27, 911–924.
35. Hayworth, J. S. and Burris, D. R. Nonionic surfactant-enhanced solubilization and recovery of organic contami-nants from within cationic surfactant-enhanced sorbent zones. 1. Experiments. Environ. Sci. Technol., 1997, 31, 1277–1283.
36. Hayworth, J. S. and Burris, D. R. Nonionic surfactant-enhanced solubilization and recovery of organic contami-nants from within cationic surfactant-enhanced sorbent zones. 2. Numerical Simulations. Environ. Sci. Technol., 1997, 31, 1284–1289.
37. Hess, K. M., Wolf, S. H. and Celia, M. A. Large-scale natural gradient tracer test in sand and gravel, Cape Cod, Massachusetts. 3. Hydraulic conductivity variability and cal-culated macrodispersivities. Water Resour. Res., 1992, 28, 2011–2027.
38. Hoag, G. E. and Marley, M. C. Gasoline residual saturation in unsaturated uniform aquifer materials. J. Environ. Eng., 1986, 112, 586–604.
39. Jussel, P., Stauffer, F. and Dracos, T. Transport modeling in heterogeneous aquifers: 1. Statistical description and numer-ical generation of gravel deposits. Water Resour. Res., 1994,
30, 1803–1817.
40. Kabala, Z. J. and Sposito, G. A stochastic model of reactive solute transport with time-varying velocity in a heteroge-neous aquifer. Water Resour. Res., 1991, 27, 341–350. 41. Kia, S. F. and Abdul, A. S. Retention of diesel fuel in aquifer
material. ASCE J. Hydrol. Eng., 1990, 116, 881–894. 42. Kool, J. B. and Parker, J. C. Development and evaluation of
closed-form expressions for hysteretic soil hydraulic proper-ties. Water Resour. Res., 1987, 23, 105–114.
43. Kueper, B. H., Abbott, W. and Farquhar, G. Experimental observations of multiphase flow in heterogeneous porous media. J. Contam. Hydrol., 1989, 5, 83–95.
44. Kueper, B. H. and Frind, E. O. Two-phase flow in hetero-geneous porous media 1. Model development. Water Resour. Res., 1991, 27, 1049–1057.
45. Kueper, B. H. and Frind, E. O. Two-phase flow in hetero-geneous porous media 2. Model application. Water Resour. Res., 1991, 27, 1059–1070.
46. Kueper, B. H. and Gerhard, J. I. Variability of point source infiltration rates for two-phase flow in heterogeneous porous media. Water Resour. Res., 1995, 31, 2971–2980.
47. Kueper, B. H., Redman, D., Starr, R. C., Reitsma, S. and Mah, M. A field experiment to study the behavior of tetra-chloroethylene below the water table: Spatial distribution of residual and pooled DNAPL. Ground Water, 1993, 31, 756– 766.
48. Land, C. S. Calculation of imbibition relative permeability for two- and three-phase flow from rock properties. Soc. Petrol. Eng. J., 1968, 8, 149–156.
49. Lenhard, R. J. and Parker, J. C. A model for hysteretic constitutive relations governing multiphase flow 2. Perme-ability–saturation relations. Water Resour. Res., 1987, 23, 2197–2206.
50. Leverett, M. C. Capillary behavior in porous solids. Trans. Am. Inst. Min. Metall. Pet. Eng., 1941, 142, 152–169. 51. Lorenz, P. B., Donaldson, E. C. and Thomas, R. D., Use of
52. McCaffery, F. G. and Bennion, D. W. The effect of wett-ability on two-phase relative permeabilities. J. Can. Petrol. Technol., 1974, 13, 42–53.
53. Miralles-Wilhelm, F. and Gelhar, L. W. Stochastic analysis of sorption macrokinetics in heterogeneous aquifers. Water Resour. Res., 1996, 32, 1541–1549.
54. Morrow, N. R. The effects of surface roughness on contact angle with special reference to petroleum recovery. J. Can. Petrol. Technol., 1975, 14, 42–53.
55. Morrow, N. R. Capillary pressure correlations for uniformly wetted porous media. J. Can. Petrol. Technol., 1976, 15, 49– 69.
56. Morrow, N. R. Wettability and its effect on oil recovery. J. Petrol. Technol., 1990, 42, 1476–1484.
57. Morrow, N. R. and Mungan, N., Wettability and Capillarity in Porous Media, Report RR-7, Petroleum Reservoir Research Inst., Calgary, Canada, January, 1971.
58. Owens, W. W. and Archer, D. L. The effect of rock wett-ability on oil–water relative permewett-ability relationships. J. Petrol. Technol., 1971, 23, 873–878.
59. Parker, J. C. and Lenhard, R. J. A model for hysteretic con-stitutive relations governing multiphase flow. 1. Saturation– pressure relations. Water Resour. Res., 1987, 23, 2187–2196. 60. Poulsen, M. and Kueper, B. H. A field experiment to study the behavior of tetrachloroethylene in unsaturated porous media. Environ. Sci. Technol., 1992, 26, 889–895.
61. Powers, S. E., Dissolution of nonaqueous phase liquids in saturated subsurface systems. Doctoral Thesis, The Univer-sity of Michigan, 1992.
62. Powers, S. E. and Tamblin, M. E. Wettability of porous media after exposure to synthetic gasolines. J. Contam. Hydrol., 1995, 19, 105–125.
63. Rathfelder, K. and Abriola, L. M. Mass conservative numer-ical solutions of the head-based Richards equation. Water Resour. Res., 1994, 30, 2579–2586.
64. Rathfelder, K. and Abriola, L. M., On the influence of capillarity in the modeling of organic liquid redistribution in two-phase systems. Advances in Water Resources, 1988, 21, 159–170. 65. Roberts, P. V., Goltz, M. N. and Mackay, D. M. A natural
gradient experiment on solute transport in a sand aquifer. 3. Retardation estimates and mass balances for organic solutes. Water Resour. Res., 1986, 22, 2047–2058.
66. Salathiel, R. A. Oil recovery by surface film drainage in mixed-wettability rocks. J. Petrol. Technol., 1973, 255, 1212–1224.
67. Smith, L. Spatial variability of flow parameters in a stratified sand. Mathematical Geology, 1981, 13, 1–21.
68. Sudicky, E. A. A natural gradient experiment on solute trans-port in a sand aquifer: Spatial variability of hydraulic con-ductivity and its role in the dispersion process. Water Resour. Res., 1986, 22, 2069–2082.
69. Tompson, A. F. B., Ababou, R. and Gelhar, L. W. Imple-mentation of the three-dimensional turning bands random field generator. Water Resour. Res., 1989, 25, 2227–2243. 70. Treiber, L. E., Archer, D. L. and Owens, W. W. Laboratory
evaluation of the wettability of fifty-five oil producing reser-voirs. Soc. Petrol. Eng. J., 1972, 12, 531.
71. van Geel, P. J. and Sykes, J. F. Laboratory and model simu-lations of a LNAPL spill in a variably-saturated sand, 2. Comparison of laboratory and model results. J. Contam. Hydrol., 1994, 17, 27–53.
72. van Genuchten, M. Th. A closed form equation for predicting the hydraulic conductivity of unsaturated soils. Soil Sci. Soc. Am. J., 1980, 44, 892–898.
73. Wilson, J. L., Conrad, S. H., Mason, W. R., Peplinski, W. and Hagan, E., Laboratory investigation of residual liquid organics from spills, leaks and the disposal of hazardous wastes in groundwater, EPA/600/6-90/004, 1990.
74. Woodbury, A. D. and Sudicky, E. A. The geostatistical char-acteristics of the Borden aquifer. Water Resour. Res., 1991,
27, 533–546.
75. Xu, S. and Boyd, S. A. Cationic surfactant sorption to a vermiculitic subsoil via hydrophobic bonding. Environ. Sci. Technol., 1995, 29, 312–320.
76. Yang, J., Zhang, R. and Wu, J. Stochastic analysis of adsorb-ing solute transport in two-dimensional unsaturated soils. Water Resour. Res., 1996, 32, 2747–2756.
APPENDIX A
It is anticipated that soil texture will have an influence on residual saturations. Following Dekker and Abriola,20 to account for this effect, the following regression relation-ships were employed herein:
Srw¼ ¹0:62329¹0:06404 log(k) r These relations were developed from consideration of pub-lished data for measured residuals in unconsolidated media.3,38,41,61eqn (A1) and eqn (A1) indicate a negative correlation between residual saturation and the log of permeability. It is assumed herein that the values of Srw and Srocalculated from eqn (A2) and eqn (A2) correspond to the residual saturations for perfectly water-wet porous media. Wettability effects on residual saturations are dis-cussed below.
Researchers in the petroleum industry have investigated the effects of wettability on residual saturations.51,55,57 Results of Morrow and Mungan57 and Morrow55 suggest that the residual wetting fluid saturation decreases when
fsowincreases from 08to 908. The dependence of residual nonwetting fluid saturation on contact angle is not as clear. Morrow55 found that residual nonwetting fluid saturation increased when fsow increases from 08 to 908, whereas results from Lorenz et al.51 suggest the opposite trend. It is generally accepted, however, that Srois lowest in media with neutral wettability.56 For this work the following expressions are employed to describe wettability effects on the residual water saturation:
Sp
where S*rwis the residual water saturation that now accounts for wettability effects, andynis a normalizing factor for the selected wettability parameter. The value ofynis equal to 1808wheny¼fsow, and equal to 1 wheny¼Fo. Note that
To account for hysteretic wettability effects on the hydraulic property relations it is necessary to distinguish between ‘immobile’ and ‘entrapped’ residual saturations. An ‘immobile’ wetting fluid residual occurs due to the pre-sence of thin films coating solid surfaces, whereas ‘entrapped’ nonwetting fluid residual occurs in larger portions of the pore space as wetting fluid invades due to capillary instabilities. Immobile and entrapped residual saturations will be denoted below with subscripts ‘i’ and ‘t’, respectively. It is assumed herein that only water is immobile whenfsow , 908 and, hence, Swi¼S*rwand Soi
¼0. Forfsow.908, only the organic liquid is assumed to be immobile, but in this case Soialso depends on the portion of the pore space that has been exposed to organic liquid. Hence, it is assumed that Soi¼S*roSomax(Somaxis the historic maximum organic saturation), while Swi¼0. For fractional wettability media S*rwand S*roare the sum of residual wetting and nonwetting water and organic saturations, respectively. Hence, it is assumed that Swi¼(1¹Fo)3S*rwand Soi¼Fo 3 S*ro 3 Somax/(1 ¹ Swi). A discussion of the entrapped residual saturations is given below.
Throughout this paper the hydraulic property relations were written in terms of effective and apparent saturations. Effective saturation reflects the ‘mobile’ liquid saturation, whereas apparent saturation reflects the ‘mobile þ
entrapped’ liquid saturation. Effective and apparent satura-tions are defined herein as:
¯
o are the apparent water and organic
saturation, respectively, S¯effw and S¯ eff
o are the effective
mobile water and organic saturation, respectively, S¯effwt and ¯
Seffot are the effective entrapped water and organic
satura-tion, respectively. The determination of S¯effwt and S¯ eff ot is
discussed below.
When the porous medium is water-wet (fsow,908), the maximum effective entrapped organic saturation (S¯effmot) is
determined with the procedure of Land48as
¯ Seffmot¼
1¹S¯effwmin
1þC 1 ¹S¯effwmin
(A7)
whereS¯effwminis the historic minimum effective water satura-tion and C is given as:
C¼1¹Swi
Sp ro
¹1 (A8)
The effective entrapped organic liquid saturation(S¯effot)as a
function of effective water saturation is subsequently deter-mined by linear interpolation as:59
¯
mot. For a porous medium that is organic-wet
(fsow . 908), eqn (A7), eqn (A8), and eqn (A9) can also be used to determine the effective entrapped water satura-tion (S¯effwt)by reversing the roles of water and the organic
liquid. For a fractional wettability medium both entrapped organic and water occur due to the presence of water- and organic-wet solids, respectively. In this case, eqn (A7) and eqn (A9) are again used to determineS¯effmot andS¯
eff
ot,
respec-tively, but this time S*roin eqn (A8) is replaced by (1¹Fo) 3 S*ro since S*ro is now the sum of residual wetting and nonwetting organic saturation. A similar procedure is employed to obtain S¯effmwt and S¯
eff
wt after writing eqns (A7),