Organic inputs for soil fertility management in tropical
agroecosystems: application of an organic resource database
Cheryl A. Palm
a,∗, Catherine N. Gachengo
a, Robert J. Delve
a,b,
Georg Cadisch
c, Ken E. Giller
c,daTropical Soil Biology and Fertility Programme, TSBF/UNESCO, UN Complex, PO Box 30592, Gigiri, Nairobi, Kenya bCIAT, PO Box 6247, Kampala, Uganda
cImperial College at Wye, University of London, Wye, Ashford, Kent, TN 25 5AH UK
dDepartment of Soil Science and Agricultural Engineering, University of Zimbabwe, PO Box MP 167, Harare, Zimbabwe
Received 30 June 2000; received in revised form 25 September 2000; accepted 25 September 2000
Abstract
Organic resources play a critical role in both short-term nutrient availability and longer-term maintenance of soil organic matter in most smaller holder farming systems in the tropics. Despite this importance, there is little predictive understanding for the management of organic inputs in tropical agroecosystems. In this paper, an organic resource database (ORD) is introduced that contains information on organic resource quality parameters including macronutrient, lignin and polyphenol contents of fresh leaves, litter, stems and/or roots from almost 300 species found in tropical agroecosystems. Data on the soil and climate from where the material was collected are also included, as are decomposition and nutrient release rates of many of the organic inputs. Examples of uses of ORD are provided in the paper: (1) nutrient contents (including median values and ranges) and other resource quality parameters of farmyard manure and crop residues are compared to that of alternative nutrient sources such as different plant parts and plant types; (2) nutrient stocks found in farm boundary hedges are estimated and evaluated as a source of nutrients for soil fertility management; (3) hypotheses regarding the indices and critical values of N, lignin, and polyphenol contents for predicting N release rates are tested; (4) organic materials for soil fertility management experiments are selected. This database, when coupled with models and decision support tools, will help advance organic matter management for soil fertility improvement from an empirical to a predictive practice. © 2001 Elsevier Science B.V. All rights reserved.
Keywords: N mineralization; Lignin; Organic resource quality; Nutrient budgets; Polyphenol
1. Introduction
Organic resources play a dominant role in soil fertil-ity management in the tropics through their short-term effects on nutrient supply and longer-term contribu-tion to soil organic matter (SOM) formacontribu-tion. Although
∗Corresponding author. Tel.:+254-2-622-319; fax:+254-2-622-733.
E-mail address: [email protected] (C.A. Palm).
organic resources used alone offer insufficient nutri-ents to sustain crop yields and build soil fertility (Giller et al., 1997; Palm et al., 1997), they will continue to be a critical nutrient source as smallholder farmers in the tropics are unable to access adequate quantities of mineral fertilizers. Despite these critical services that organic inputs provide to agricultural productivity, the use of organic materials for soil fertility management is based primarily on trial and error. Ten years ago, Sanchez et al. (1989) stressed the need for a predictive
understanding for the management of organic inputs in tropical agroecosystems. Two of the six research im-peratives that emerged included the need to (1) quan-tify the biomass and nutrient content of aboveground organic inputs and (2) develop predictive (resource quality) parameters for nutrient release patterns of organic inputs.
Resource quality parameters and indices that gov-ern decomposition and nutrient release in natural ecosystems were identified by Swift et al. (1979), Melillo et al. (1982) and Schlesinger and Hasey (1981). Numerous studies have since reported nutrient contents, resource quality, decomposition, and nutri-ent release patterns for a variety of organic materials from tropical agroecosystems (Palm, 1995; Cadisch and Giller, 1997; Heal et al., 1997; Mafongoya et al., 1998). From those studies, a predictive understanding of decomposition and nutrient release patterns and the resource quality parameters that influence those re-lease patterns is emerging (Giller and Cadisch, 1997; Palm et al., 1997, 2000). A variety of multi-variable equations all indicate a hierarchical set of N, lignin and polyphenol content for predicting N release pat-terns from organic materials (Fox et al., 1990; Palm and Sanchez, 1991; Constantinides and Fownes, 1994a; Tian et al., 1995; Mafongoya et al., 1997; Palm et al., 1997). Other resource quality parameters such as condensed tannins, soluble C, and fiber-bound N have also been highlighted as important modifiers of N release patterns (Handayanto et al., 1997; Palm and Rowland, 1997). A minimum data set of resource quality parameters aimed at identifying robust plant quality indices that provide improved prediction of decomposition, nutrient release and SOM factors which can be coupled with decomposition models has been proposed (Palm and Rowland, 1997; Palm et al., 1997). The aim was to produce comparable data across sites to allow synthesis and refinement of the indicators for predicting decomposition, nutrient release and synchrony of nutrient supply with crop demands.
As the quantity of traditional organic inputs, such as crop residues and animal manures, declines in many farming systems as a result of reduced yields and other uses for animal feed, fuel and fiber, farmers are now faced with finding alternative or supplemen-tary sources of nutrients. The variety of tropical agro-ecosystems and the diversity of organic inputs used
in those systems, including trees, shrubs, cover crops, and composts present a challenge for research and ex-tension activities in soil fertility management. In this paper, an organic resource database (ORD) is pre-sented that contains information on organic resource quality, decomposition, and nutrient release patterns of many organic inputs found in tropical agroecosys-tems. This database, when coupled with rules and tools for selecting organic resources, may help the advance from empirical to predictive practices of organic mat-ter management for soil fertility improvement.
2. Development of ORD
2.1. Database structure
The database is written in Microsoft Access and contains six linked tables, one each for taxonomic classification, resource quality data, decomposition data, soil data, climate data, and reference data. More specifically, for each entry these tables contain data on plant species and plant part; resource quality pa-rameters; decomposition rates, N release rates, and digestibility indices; site characteristics, including location, climate and soil; and the source of infor-mation. Not all the information or data fields are available for each record. Only available data were entered, which at a minimum include plant species, plant part analyzed and N, P and K concentrations. Detailed descriptions or definitions of some of the data fields are included below.
Data contained in the different tables can be retrie-ved through customized searches using the Microsoft Access feature ‘Query’ to search for specific data. By linking the tables, any data combination, e.g., plant species, macronutrient content, soil data and the bibliographic reference or source can be retrieved.
2.2. Types of organic resources
or stover and whether the material is fresh or litter. Fresh material is defined as those parts that have not senesced or fallen from the plant and where retranslo-cation of nutrients and carbon has been minimal. Litter is defined as material in which senescence and retranslocation of nutrients has occurred and is usu-ally represented by leaves or stems that have dehisced and fallen from the plant. In grass species dead leaves that are still attached to the plant are also classified as litter. The definition for crop residues falls between that of fresh materials and litter. Crop residues are materials where some senescence has occurred and is usually represented by dead leaves or stems which are still part of the dead upright plant left in the field after harvest. In cases where plants are harvested before plants have senesced (e.g., groundnuts), crop residues include fresh green materials. Other sources of organic materials, for instance, manures and com-posts are characterized by the animal that produced them, the management and storage of the manures and whether they were composted prior to collection.
2.3. Resource quality parameters
To allow valid comparisons regarding the qual-ity characteristic of organic materials they should be sampled, prepared, and analyzed by comparable methods (Mafongoya et al., 1997; Vanlauwe et al., 1997). A minimum set of organic resource quality parameters that influence decomposition and nutrient release, and standard methodologies for measuring these parameters was recommended by Palm and Rowland (1997). The minimum data set includes macronutrients, total C, lignin, soluble C, soluble polyphenolics, a-cellulose, and ash. Whenever pos-sible, this information and the methodology used for analysis is included in ORD.
2.4. Site characteristics
Organic resource quality of a given material may be influenced by the environmental conditions under which the plants grew; therefore, information on the climate and soil from where the material was collected may assist with interpretation. In addition, site char-acteristics, such as, soil texture (% sand, silt and clay) and climate variables (monthly maxima, minima and annual average temperature and rainfall) are needed
for most decomposition and crop simulation models that can be linked to ORD.
2.5. Decomposition, nitrogen release rates and digestibility indices
Many of the organic resource entries include in-formation on dry matter decomposition, and N and phosphorus release from soil incubation or litter bag experiments reported in the literature. The method-ologies used include field litterbag studies and labo-ratory incubations, including those with leaching or non-leaching conditions. Decomposition and nutri-ent release rates are reported by a variety of means and units such as decomposition constants on a per day, week, or yearly basis and N mineralization or immobilization based on the amount or percent of N released are used. To allow for comparisons among these studies, the data have been entered in ORD in a standard format and include cumulative mass or nu-trient lost (or immobilized) at each sampling time as a percent of the initial amount. In addition to the time series data, a single exponential decay model was fit to the data,y =100 exp(−kt), where y is the percent remaining, k the rate constant per week, and t the time in weeks. Where data were available, k values were calculated for the different sampling times; the k val-ues are entered in ORD and thus allow comparisons of the derived rate constants over the same number of weeks for different species and experiments.
Degradation, or digestion, of plant material in the animal rumen is often compared to decomposition and thus measures of digestibility that are used to assess forage quality could serve as a quick means of assess-ing the quality of organic resources (Chesson, 1997). Some entries in ORD contain digestibility indices in-cluding in vitro dry matter digestibility (IVDMD), neutral detergent fiber (NDF), and crude protein.
3. Contents of ORD
information is indicated as a literature citation or the name of the scientist or institution who submitted samples that were analyzed by TSBF. All informa-tion included from unpublished results was done so with the permission of the individual scientists. Quality control and standardization of the informa-tion in ORD is important to allow cross-comparisons. Whereas plant total macronutrient concentrations may not differ substantially between alternative methods or laboratories, lignin and particularly polyphenol concentrations depend substantially on the method of analysis. As an example, total soluble polyphenol concentrations depend on the plant material to extrac-tant ratio and type of extracextrac-tant used (Consextrac-tantinides and Fownes, 1994b). The method used for analysis is documented in ORD to allow users to compare data obtained using the same method.
To date, entries in ORD are biased towards plant materials from the tropics that are, or have potential for use in soil fertility management and are therefore of relatively high quality. Literature searches and plant sampling have focused on agroforestry species and leguminous cover crops. The majority of samples an-alyzed by TSBF were collected in East and Southern Africa from sub-humid and semiarid agroecosystems, though the literature entries broaden the geographical scope to include tropical areas in other parts of Africa, Asia, and Latin America.
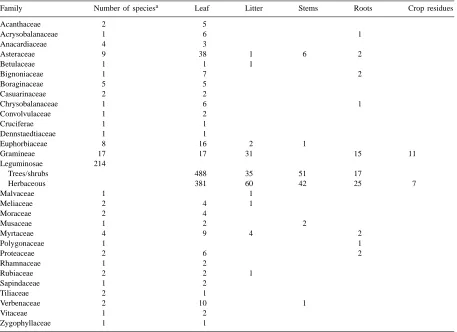
The contents of ORD are continuously being up-dated; at the end of 1999 the database contained 1929 entries. Of these, 1034 of the entries were obtained from the literature or unpublished documents, while the remainder were analyzed by TSBF/KARI. More than half (53%) of the entries are of fresh leaves and the remainder distributed among leaf litter (8%), stems (5%), roots (4%), animal manure (8%), crop residues (1%) and 21% in miscellaneous categories that include stem litter, whole plants, and plant part mixtures (Table 1). Over half of the entries are of species in the Leguminosae with the second most abundant group being species in the family Asteraceae (formerly the Compositae).
4. Applications of ORD
ORD can be used to address a variety of questions for strategic and applied research or for agricultural
extension. Descriptions of some of these uses and ex-amples from ORD are presented below.
4.1. Variation in resource quality
The data set in itself addresses the research imper-ative put forward by Sanchez et al. (1989) to quantify the biomass and nutrient content of aboveground or-ganic inputs in tropical agroecosystems. Queries can be established with Microsoft Access to obtain sum-mary statistics (means, ranges, standard deviations, etc) of the data for different organic resource types, plant parts, or taxonomic categories. Data can also be exported and analyzed using statistical applications to determine differences in resource quality parame-ters among groupings or correlations among resource quality parameters, and soil and climate variables.
Issues that can be addressed include: (1) the vari-ability in resource quality of a particular plant species within and between locations. If there is little variabil-ity in values for a particular species, then it may not be necessary to analyze these materials repeatedly in the future, but values from ORD may be used (Palm and Rowland, 1997), or (2) if there is considerable variability for a particular species, then correlations might be established between resource quality param-eters and climate or soil variables or genotypic prove-nances. Such correlations provide a means of estimat-ing a resource quality parameter for a species grown under specific conditions. Such relationships may also provide insights into the developmental ecology of plants in different environments or the relative effects of genetics or environment on resource quality.
4.1.1. Effect of organic resource type and plant part on nutrient value
Table 1
Current contents of ORD by plant species and plant part
Family Number of speciesa Leaf Litter Stems Roots Crop residues
Acanthaceae 2 5
Acrysobalanaceae 1 6 1
Anacardiaceae 4 3
Asteraceae 9 38 1 6 2
Betulaceae 1 1 1
Bignoniaceae 1 7 2
Boraginaceae 5 5
Casuarinaceae 2 2
Chrysobalanaceae 1 6 1
Convolvulaceae 1 2
Cruciferae 1 1
Dennstaedtiaceae 1 1
Euphorbiaceae 8 16 2 1
Gramineae 17 17 31 15 11
Leguminosae 214
Trees/shrubs 488 35 51 17
Herbaceous 381 60 42 25 7
Malvaceae 1 1
Meliaceae 2 4 1
Moraceae 2 4
Musaceae 1 2 2
Myrtaceae 4 9 4 2
Polygonaceae 1 1
Proteaceae 2 6 2
Rhamnaceae 1 2
Rubiaceae 2 2 1
Sapindaceae 1 2
Tiliaceae 2 1
Verbenaceae 2 10 1
Vitaceae 1 2
Zygophyllaceae 1 1
aNumbers refer to the number of species sampled or the number of samples of a particular plant part.
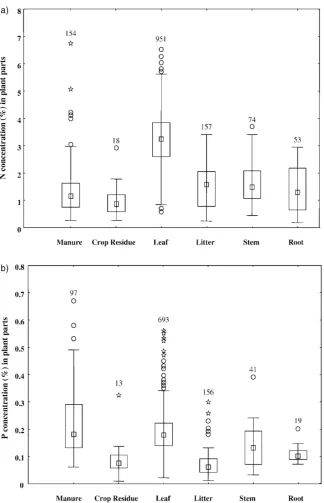
outliers can be used to investigate possible reasons for the outliers, such as taxonomic trends, incorrect data entries, or analytical error. They may also represent unusual plants that might be of particular importance. A comparison of the N contents of the traditional agricultural organic inputs, cattle manure and crop residues, with the different plant parts of trees, shrubs and cover crops indicated that manure, crop residues, and the leaf litter, stems, and roots had median N values less than 2.0%, with few samples of higher concentrations (Fig. 1a). Fresh leaves, in contrast, had a median N concentration greater than 3.0%, ranging from 1 to 5.5% N. The P concentrations in over half of the crop residue, leaf litter, stem, and root samples were less than 0.15% P; few samples had concentra-tions greater than 0.20% P (Fig. 1b). Cattle manure
and fresh leaf samples had median % P values greater than 0.15, ranging as high as 0.50%. These differences in N and P quality between different types of organic resources have direct implications to its potential use for soil management. The short-term plant available N value of many crop residues and manures is poor (Delve et al., 2000) but may provide a longer-term benefit in maintaining SOM (Palm et al., 2000).
4.1.2. Variation among plant families
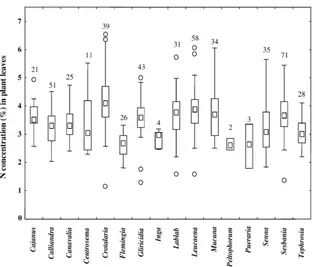
Fig. 3. The median N concentrations, ranges, and outliers of the entries in ORD of the fresh leaves from selected legume genera. Legends are the same as for Fig. 1.
concentrations of 3.5% N and the majority of samples in these two families had concentrations greater than 3.0%. Median N concentrations of legume leaf litter (1.8%) and roots (1.6%) were larger than non-legumes (litter 1.2% N, roots 0.8% N), while the median N in stems (1.5% N) was similar for both plant groups.
The P concentrations of the leaves of legumes tended to be smaller than that in leaves of non-legumi-nous plants; 0.17% compared with an overall mean for non-legumes of 0.21%. This finding is consistent with a recent report from Sprent (1999). There were, however, several outliers or extreme values in the legumes with values above 0.30% P, most of these samples are from species in Sesbania. The leaves of samples from the Asteraceae, on the other hand, had considerably higher values than the other families with a median concentration of 0.30% P (Fig. 2b). Further investigation shows that this large value was due to the large number of samples of Tithonia
di-versifolia compared with other species; tithonia is
noted for high P concentrations that vary with soil P
availability (George et al., 1999). Phosphorus con-centrations of leaf litter, stems and roots were similar between legumes and non-legumes.
4.1.3. Variation among legume genera
Within the Leguminosae, the vast majority of N concentrations in fresh leaf samples fell between 2.5 and 4.5% (Fig. 3). There was considerable overlap of N concentration among the genera though the me-dian values for Crotalaria, Gliricidia, Lablab,
Leu-caena, Mucuna, and Sesbania were greater than 3.5%
N while those of Flemingia, Inga, Peltophorum, and
Pueraria were less than 3.0% N. The non-N-fixing
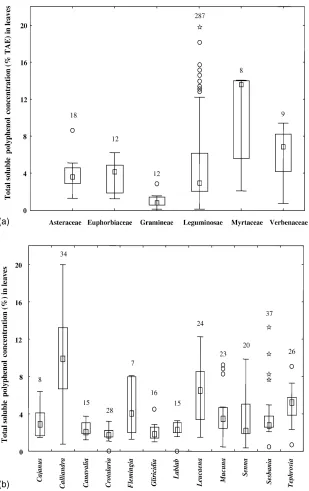
Fig. 4. The median polyphenol concentrations (TAE: tannic acid equivalents), ranges, and outliers of the entries in ORD of the fresh leaves from selected plant families (a) and legume genera (b). Legends are the same as for Fig. 1.
4.1.4. Carbon quality of organic resources
Less than one-third of the entries included the C concentration of the organic material. The values ranged from 29 to 70% C having a mean of 49%.
was due to differences in methods used for analyzing total C or among the laboratories. In fact from over 3000 plant samples, that included different plant parts from trees and crops, analyzed at Wye College on a total C and N analyzer (PDZ/Europa), the majority of samples had values between 40 and 44% C with no values as large as 50%.
Lignin concentrations in manure, crop residues, and fresh leaves, in general, were less than 15% with median values at 10% or less. There were several outliers in the leaf category showing lignin concen-trations greater than 25%; an examination of the outliers shows that more than 75% of the samples were of plants with pinnate leaves with a prominent, lignified central rachis, such as Calliandra
calothry-sus, Spathodea canipulata, Markhamia lutea. This
uneven distribution of C components within the leaf has implications for soil management as the leaflets have smaller lignin concentrations and decomposition patterns than that indicated by the whole leaf sample. Stem samples also had median lignin less than 15%; this value is lower than expected and may indicate the majority of samples were of young, green stems. Median lignin concentration of leaf litter and roots were greater than 15%.
Total soluble polyphenol concentrations deter-mined by the Folin–Denis or Folin–Ciocalteu reagent methods (Constantinides and Fownes, 1994b) were generally lower than 2% TAE (tannic acid equiv-alents) for manure, crop residues, litter, stems and roots. The median value for fresh leaves was 3% but over one-quarter of the samples had concentrations greater than 6%; the majority of these were of the Leguminosae, Myrtaceae, and Verbenaceae (Fig. 4a). The polyphenol concentrations in a few legume genera indicated that Cajanus cajan, Canavalia
ensi-formis, Crotalaria (juncea, ochroleuca, striata, gra-hamiana, capilla), Gliricidia sepium, Lablab (glob-iflora, purpureus), Sesbania sesban all had upper
ranges less than 4% (Fig. 4b). Calliandra
calothry-sus, Flemingia macrophylla, Leucaena leucocephala,
and Tephrosia vogelii had broad ranges in concentra-tions generally greater than 4%. Senna (siamea and
spectabilis) had intermediate values.
The large range of polyphenol concentrations in the leaves of Calliandra and Leucaena could be from a variety of factors. Poor soil N availability can result in higher polyphenol concentrations within a given
species than more fertile soils (Handayanto et al., 1995). Polyphenol concentrations can also vary be-tween provenances of C. calothrysus (P. Mafongoya, personal communication). ORD can be used to iden-tify the relative importance of factors affecting these ranges and for selecting materials for soil fertility and animal fodder.
4.2. Estimating nutrient stocks, flows, and budgets
Nutrient flows and budgets are increasingly being used to diagnose causes of nutrient depletion (or ex-cesses) and to devise alternative nutrient management strategies to alleviate these problems (Smaling, 1998). The standing stock of nutrients on farm, whether in the soil, vegetation, or storage facilities characterizes the nutrient resource capital of the farm. Coupled with nutrient balances or flows this could provide an index or measure of productivity or sustainability (Smaling et al., 1997). The information needed to determine nutrient flows, budgets, and stocks is data intensive and expensive to collect (Lynam et al., 1998; Lauriks et al., 1999). Nutrient data in ORD coupled with in-formation on the stocks and flows of specific organic materials can be used to estimate the quantity of nu-trients, thus reducing the amount of new data needed and cost for these analyses. Whereas nutrient contents of the major crops and their components and animal manures is fairly well known and already used for estimating nutrient budgets (Stoorvogel and Smaling, 1990), ORD contains nutrient data on other compo-nents of the farming system, such as cover crops and agroforestry trees and shrubs that are important to nu-trient management in many tropical agroecosystems.
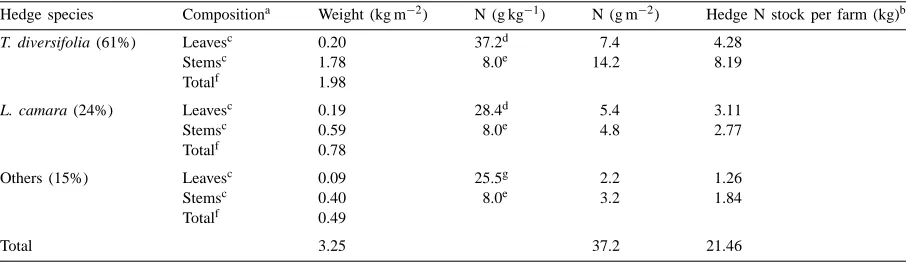
Table 2
Nitrogen stocks in vegetative hedges of smallholder farms in western Kenya as calculated from biomass stocks (Lauriks et al., 1999; Ng’inja et al., 1998) and nutrient contents in ORD
Hedge species Compositiona Weight (kg m−2) N (g kg−1) N (g m−2) Hedge N stock per farm (kg)b
T. diversifolia (61%) Leavesc 0.20 37.2d 7.4 4.28
Stemsc 1.78 8.0e 14.2 8.19
Totalf 1.98
L. camara (24%) Leavesc 0.19 28.4d 5.4 3.11
Stemsc 0.59 8.0e 4.8 2.77
Totalf 0.78
Others (15%) Leavesc 0.09 25.5g 2.2 1.26
Stemsc 0.40 8.0e 3.2 1.84
Totalf 0.49
Total 3.25 37.2 21.46
aLauriks et al. (1999).
bFrom Ng’inja et al. (1998), 275 m of hedge per farm, average hedge width 2.1 m. cPercentage leaves and stems — Ng’inja et al. (1998).
dORD.
eJama et al. (2000) assuming woody tissue similar N.
fEstimated from Lauriks et al. (1999), 10.82 kg m−2 fresh weight, assuming 30% dry matter. gORD average N of all non-legume leaves.
contained in the hedges are not known. The N stock of hedge type 4 as described by Lauriks et al. (1999) was estimated by using the weight of the hedges (kg m−2), the relative proportion of different species (61% T. diversifolia, 24% Lantana camara, and 15% other species), the relative proportions of leaves and stems for the different species (Ng’inja et al., 1998), and the ORD nutrient contents (Table 2). The content of N in the hedge was 37 g N m−2, over half of that was contained in tithonia and one-quarter in lantana. Forty percent of N was in the leaves, the plant part that would be useful for soil fertility management through biomass transfer. Considering that the average width of the hedges was 2.1 m and that farms have an av-erage of 275 m of hedges, N stock in the hedges was 21 kg, with 9 kg in the leafy biomass. Although this is a limited quantity of N, if the hedges are pruned three times a year providing a total of 27 kg of N of leafy biomass, this is equivalent to 90 kg N ha−1yr−1 if applied to an area of one-third hectare.
4.3. Testing hypotheses and models on resource quality and nutrient release patterns, and SOM formation
In response to the plea of Sanchez et al. (1989) for predictive resource quality parameters for nutrient
release patterns and SOM formation, several hypothe-ses, indices, and critical values have been proposed (Myers et al., 1997; Palm et al., 2000). Most of the indices include N, lignin and polyphenol contents for determining relative rates of N immobilization and mineralization from organic materials (Melillo et al., 1982; Constantinides and Fownes, 1994a; Tian et al., 1995; Palm et al., 1997). The ORD can be used for identifying materials with specific resource quality pa-rameters, indices or critical values for testing these hypotheses. As an example, the data from 11 labora-tory incubations studies that followed N release from organic materials for at least 8 weeks was used to test the various criteria and indices that have been proposed to predict N release. Of these indices the initial N concentration of the material serves as the best single criteria to predict N release over the en-tire range of N concentrations and confirms the find-ings of Constantinides and Fownes (1994a). The lignin plus polyphenol-to-N ratio fit the data better than the lignin-to-N or polyphenol-to-N ratios but in all cases with the ratios the N concentration was the determin-ing factor (data not shown).
Fig. 5. Nitrogen mineralized or immobilized after 8 weeks from organic materials from 11 incubation studies as determined by the N concentration of the materials and modified by high lignin or polyphenol concentrations. The regression equation is for all materials. Filled squares or circles represent materials with % N>2.5, open square or circles % N<2.5; squares represent materials with % lignin<15 and % polyphenol<4; circles represent materials with % lignin>15 or % polyphenol>4.
but exhibited net N mineralization at 8 weeks (Fig. 5). If points with N greater than 2.5% are then divided into those with lignin and polyphenol less than 15 and 4%, respectively, and those with either lignin or polyphenol concentrations larger than the critical values, then the mean %N released is reduced from 42% for those with both low lignin and polyphenol concentrations to 18%. Likewise, the degree of immobilization was greater in materials that had less than 2.5% N but also high lignin or polyphenol contents.
Such information on the effects of resource quality on decomposition and N release can then be used to test and modify decomposition and crop models. Most decomposition models, or subroutines within ecosys-tem or crop models, were developed primarily with information from temperate systems and vary in their ability to simulate the effects of additions of organic resources (Parton et al., 1989; Tusji et al., 1994; Mc-Cown et al., 1996). Decomposition and N dynamics in the CERES models are determined by the C-to-N ratio of the organic material (Dimes, 1996), while in the CENTURY model the lignin-to-N ratio is the de-termining parameter (Parton et al., 1989). The effect of polyphenolics and their protein binding capacity was included in a recent model by Whitmore and Handyanto (1997). The data sets in ORD, when cou-pled with the soil and climate conditions of the study, can be used for verifying and, if necessary, modifying
these decomposition models for a wide range of or-ganic resources in tropical agroecosystems. Models capable of simulating nutrient dynamics and crop nu-trient uptake following the addition of organic materi-als then could be linked with ORD. Such links would allow establishing fertilizer equivalency values for or-ganic resources to be estimated and recommendations for the amounts of materials needed for obtaining desired crop yields in a range of soil and climate types.
Another example is to use ORD for selecting materials that fit certain criteria in order to test hypotheses. To test the lignin, polyphenol, or mi-crobial hypotheses of SOM formation (Stevenson, 1982) organic materials with contrasting lignin and polyphenol concentrations are required. A query to identify materials in ORD with (1) lignin < 5% and polyphenol >10% (polyphenol hypothesis), (2) lignin < 5% and polyphenol < 2% (microbial hy-pothesis), and (3) lignin > 15% and polyphenol < 2% (lignin hypothesis) resulted in several materials that could be used for establishing experiments to test these hypotheses (Table 3).
4.4. Selecting materials for soil management
Table 3
Characteristics of the leaves of plants that could be used for testing hypotheses on SOM formationa
Plant species Lignin (%) Total soluble polyphenol (%) Low lignin, low polyphenol <5 <2
Arachis pintoi 4.96 0.50
Low lignin, high polyphenol <5 >10
Calliandra calothyrsus 4.21 13.23
C. calothyrsus 4.57 13.98
C. calothyrsus 3.97 13.48
C. calothyrsus 3.61 14.62 High lignin, low polyphenol >15 <2
C. calothyrsus 34.06 0.77
aSome species have multiple entries and different samples may
fall into separate categories.
The hypothesis and model testing described above will provide explicit guidelines for soil fertility manage-ment, but it will take considerable time to conclude these activities. Such precision may not be necessary to begin making practical recommendations for select-ing organic resources for soil fertility management. A decision tree has been developed for selecting organic
materials as a N source in biomass transfer systems (Palm et al., 1997). The decision tree results in four categories of materials that can be used for (1) apply-ing directly to the soil as an immediate source of N (category 1), (2) mixing with fertilizers (category 2), (3) composting (category 3), or (4) surface mulching for erosion control (category 4) (Fig. 6). The decision tree has been established in ORD as a query and can be used to identify materials that fall into the various cate-gories. A complete listing of the plant species and plant parts that fit into the various categories of the deci-sion tree were obtained via a query. The output of that query has been generalized according to agroecosys-tems, and the plant types and plant parts that occur in those agroecosystems (Table 4). This generalized in-formation can then be used for knowing the quality of the types of organics in those systems or selecting ma-terials for soil management from those systems. Sim-ilar types of decision trees are being developed and can be linked to ORD for selection and management of cattle manures or species for improved fallows.
5. Access to ORD
The database is accessible only using Microsoft Access. The ORD is available for distribution free to interested persons by contacting TSBF or through a Web page: http://www.wye.ac.uk/BioSciences/soil. A manual, including tutorials, has been produced to guide users through the various aspects of ORD. The manual is distributed along with the instructions for downloading the database.
6. Adding data to ORD
Fig. 6. The selection of entries in ORD for testing the four different management categories of organic resources as determined by their N, lignin, and polyphenol contents.
Table 4
Classification of plant types and parts into agroecosystems and soil management categories as defined by the decision tree presented in Fig. 6
Agroecosystem (plant type/part of inputs) Organic resource quality category
1 2 3 4
Continuous cropping
Stover/residues XX X
Crop roots X XX
Biomass transfer
Leafy biomass XX Xa
Crop/herbaceous legume
Stover/residues XX
Crop roots XX
Legume cover crop biomass XX
Legume roots XX
Legume litter XX X
Crop/legume tree fallow
Stover/residues XX
Crop roots X
Legume leafy biomass XX Xa
Legume stems/twigs X XX
Legume roots XX
Legume litter XX X
aIncludes leaves of Azadirachta indica, C. calothyrsus, L. camara, I. edulis with high polyphenol/lignin concentrations. XX denotes
Acknowledgements
ORD was made possible through a grant by DFID to Wye College and TSBF and is continued through further funding by DFID to the Soil Water and Nutri-ent ManagemNutri-ent Program of the CGIAR. The authors especially thank Edward Adams for the initial design and data entry, Muguga (KARI) for use of their labo-ratories, Nicholas K’ungu and Margaret Muthoni for the analysis of several hundred samples, and all the researchers who provided samples and information.
References
Bradley, P.N., Kuyper, J.B.H., 1985. Woody biomass survey of Kakamega district. Kenya Woodfuel Development Programme Working Paper No. 9. The Beijer Institute, Nairobi, Kenya. Cadisch, G., Giller, K.E. (Eds.), 1997. Driven by Nature:
Plant Residue Quality and Decomposition. CAB International, Wallingford, UK, 409 pp.
Chesson, A., 1997. Plant degradation by ruminants: parallels with litter decomposition in soils. In: Cadisch, G., Giller, K.E. (Eds.), Driven by Nature: Plant Litter Quality and Decomposition. CAB International, Wallingford, UK, pp. 47–66.
Constantinides, M., Fownes, J.H., 1994a. Nitrogen mineralization from leaves and litter of tropical plants: relationship to nitrogen, lignin and soluble polyphenol concentrations. Soil Biol. Biochem. 26, 49–55.
Constantinides, M., Fownes, J.H., 1994b. Tissue-to-solvent ratio and other factors affecting determination of soluble phenolics in tropical leaves. Commun. Soil Sci. Plant Anal. 25, 3221–3227. Delve, R.J., Cadisch, G., Tanner, J.C., Thorpe, W., Thorne, P.J., Giller, K.E., 2000. Implications of livestock feeding management on soil fertility in the smallholder farming systems of sub-Saharan Africa. Agric. Ecosyst. Environ., in press. Dimes, J., 1996. Simulation of mineral N supply to no-till
crops in the semiarid tropics. Ph.D. Thesis. Griffith University, Queensland, Australia.
Fox, R.H., Myers, R.J.K., Vallis, I., 1990. The nitrogen mineralization rate of legume residues in soil as influenced by their polyphenol, lignin and nitrogen contents. Plant Soil 129, 251–259.
George, T.S., Gregory, P.J., Robinson, J.S., Buresh, R.J., Jama, B., 1999. Tithonia diversifolia in western Kenya: relationship of tissue phosphorus concentration to soil phosphorus. Agrofor. Forum 9, 33–37.
Giller, K.E., Cadisch, G., 1997. Driven by nature: a sense of arrival or departure. In: Cadisch, G., Giller, K.E. (Eds.), Driven by Nature: Plant Litter Quality and Decomposition. CAB International, Wallingford, UK, pp. 393–399.
Giller, K.E., Cadisch, G., Ehaliotis, C., Adams, E., Sakala, W.D., Mafongoya, P.L., 1997. Building soil nitrogen capital in Africa. In: Buresh, R.J., et al. (Eds.), Replenishing Soil Fertility in
Africa. SSSA Special Publication No. 51. SSSA, Madison, WI, pp. 151–192.
Handayanto, E., Cadisch, G., Giller, K.E., 1995. Manipulation of quality and mineralization of tropical legume tree prunings by varying nitrogen supply. Plant Soil 176, 149–160.
Handayanto, E., Cadisch, G., Giller, K.E., 1997. Regulating N mineralization from plant residues by manipulation of quality. In: Cadisch, G., Giller, K.E. (Eds.), Driven by Nature: Plant Litter Quality and Decomposition. CAB International, Wallingford, UK, pp. 175–185.
Heal, O.W., Anderson, J.M., Swift, M.J., 1997. Plant litter quality and decomposition: an historical overview. In: Cadisch, G., Giller, K.E. (Eds.), Driven by Nature: Plant Litter Quality and Decomposition. CAB International, Wallingford, UK, pp. 3–30. Jama, B., Palm, C.A., Buresh, R.J., Niang, A., Gachengo, C., Nziguheba, G., Amadalo, B., 2000. Tithonia diversifolia as a green manure for soil fertility improvement in western Kenya: a review. Agrofor. Syst. 49, 201–221.
Lauriks, R., De Wulf, R., Carter, S.E., Niang, A., 1999. A methodology for the description of border hedges and the analysis of variables influencing their distribution: a case study in western Kenya. Agrofor. Syst. 44, 69–86.
Lynam, J.K., Nandwa, S.M., Smaling, E.M.A., 1998. Nutrient balances as indicators of productivity and sustainability in sub-Saharan African agriculture: introduction. Agric. Ecosyst. Environ. Special Issue 71, pp. 1–4.
Mafongoya, P.L., Dzowela, B.H., Nair, P.K., 1997. Effect of multipurpose trees, age of cutting and drying method on pruning quality. In: Cadisch, G., Giller, K.E. (Eds.), Driven by Nature: Plant Litter Quality and Decomposition. CAB International, Wallingford, UK, pp. 167–174.
Mafongoya, P.L., Giller, K.E., Palm, C.A., 1998. Decomposition and nitrogen release patterns of tree prunings and litter. Agrofor. Syst. 38, 77–97.
McCown, R.L., Hammer, G.L., Hargreaves, J.N.G., Holzworth, D.P., Freebairn, D.M., 1996. APSIM: a novel software system for model development, model testing and simulation in agricultural systems research. Agric. Syst. 50, 255–271. Melillo, J.M., Aber, J.D., Muratore, J.F., 1982. Nitrogen and
lignin control of hardwood leaf litter decomposition dynamics. Ecology 63, 621–626.
Myers, R.J.K., van Noordwijk, M., Vityakon, P., 1997. Synchrony of nutrient release and plant demand: plant litter quality, soil environment and farmer management options. In: Cadisch, G., Giller, K.E. (Eds.), Driven by Nature: Plant Litter Quality and Decomposition. CAB International, Wallingford, UK, pp. 215–229.
Ng’inja, J.O., Niang, A., Palm, C., Lauriks, R., 1998. Traditional hedges in western Kenya: typology, composition, distribution, uses, productivity and tenure. Pilot Project Report No. 8. Maseno Agroforestry Research Center, Maseno, Kenya, 22 pp. Palm, C.A., 1995. Contribution of agroforestry trees to nutrient requirements in intercropped plants. Agrofor. Syst. 30, 105–124. Palm, C.A., Sanchez, P.A., 1991. Nitrogen release from the leaves of some tropical legumes as affected by their lignin and polyphenolic contents. Soil Biol. Biochem. 23, 83–88. Palm, C.A., Rowland, A.P., 1997. Chemical characterization
Giller, K.E. (Eds.), Driven by Nature: Plant Litter Quality and Decomposition. CAB International, Wallingford, UK, pp. 379–392.
Palm, C.A., Myers, R.J.K., Nandwa, S.M., 1997. Combined use of organic and inorganic nutrient sources for soil fertility maintenance and replenishment. In: Buresh, R.J., Sanchez, P.A., Calhoun, F. (Eds.), Replenishing Soil Fertility in Africa. SSSA, American Society of Agronomy, Madison, WI, pp. 193–217.
Palm, C.A., Giller, K.E., Mafongoya, P.L., Swift, M.J., 2000. Management of organic matter in the tropics: translating theory into practice. Nutr. Cyc. Agroecosyst., in press.
Parton, W.J., Cole, C.V., Stewart, J.W.B., Ojima, D.S., Schimel, D.S., 1989. Simulating regional patterns of soil, C, N, and P dynamics in the US central grasslands region. In: Clarholm, M., Bergstrom, L. (Eds.), Ecology of Arable Land: Perspectives and Challenges. Kluwer Academic Publishers, Dordrecht, The Netherlands, pp. 99–108.
Sanchez, P.A., Palm, C.A., Szott, L.T., Cuevas, E., Lal, R., 1989. Organic input management in tropical agroecosystems. In: Coleman, D.C., Oades, J.M., Uehara, G. (Eds.), Dynamics of Soil Organic Matter in Tropical Ecosystems. NifTAL Project. University of Hawaii, Honolulu, HI, pp. 125–152.
Schlesinger, W.H., Hasey, M.H., 1981. Decomposition of chapa-rral shrub foliage: losses of organic and inorganic constituents from deciduous and evergreen leaves. Ecology 62, 762– 774.
Smaling, E.M.A. (Ed.), 1998. Nutrient Balances as Indicators of Productivity and Substainability in Sub-Saharan African Agriculture. Agric. Ecosyst. Environ. Special Issue 71.
Smaling, E., Nandwa, S.M., Janssen, B.H., 1997. Soil fertility in Africa is at stake. In: Buresh, R.J., Sanchez, P.A., Calhoun, F. (Eds.), Replenishing Soil Fertility in Africa. SSSA, American Society of Agronomy, Madison, WI, pp. 47–61.
Sprent, J.I., 1999. Not all nitrogen-fixing legumes have a high requirement for phosphorus. Agrofor. Forum 9, 17–20. Stevenson, F.J., 1982. Humus Chemistry: Genesis, Composition,
Reactions. Wiley, New York, 380 pp.
Stoorvogel, J.J., Smaling, E.M.A., 1990. Assessment of soil nutrient depletion in sub-Saharan Africa, 1983–2000. Report No. 28. DLO Winand Staring Ctr. for Integrated Land, Soil and Water Research, Wageningen, The Netherlands.
Swift, M.J., Heal, O.W., Anderson, J.M., 1979. Decomposition in Terrestrial Ecosystems. Blackwell Scientific Publications, Oxford, 372 pp.
Tian, G., Brussard, L., Kang, B.T., 1995. An index for assessing the quality of plant residues and evaluating their effects on soil and crop in the (sub-)humid tropics. Appl. Soil Ecol. 2, 25–32. Tusji, G.Y., Uehara, G., Balas, S. (Eds.), 1994. DSSAT V3.
University of Hawaii, Honolulu, HI.
Vanlauwe, B., Diels, J., Sanginga, N., Merckx, R., 1997. Residue quality and decomposition: an unsteady relationship? In: Cadisch, G., Giller, K.E. (Eds.), Driven by Nature: Plant Litter Quality and Decomposition. CAB International, Wallingford, UK, pp. 157–166.