INCREASE OF READABILITY AND ACCURACY OF 3D MODELS USING FUSION OF
CLOSE RANGE PHOTOGRAMMETRY AND LASER SCANNING
M. Gašparović a, *, I. Malarić b
a GEOF, Faculty of Geodesy, University of Zagreb, Kačićeva 26, Zagreb, Croatia
Geofoto ltd., Buzinski prilaz 28, Zagreb, Croatia - [email protected]
Commission V, WG V/2
KEY WORDS: Close Range, Laser scanning, Texture, Fusion, Cultural Heritage
ABSTRACT:
The development of laser scanning technology has opened a new page in geodesy and enabled an entirely new way of presenting data. Products obtained by the method of laser scanning are used in many sciences, as well as in archaeology. It should be noted that 3D models of archaeological artefacts obtained by laser scanning are fully measurable, written in 1:1 scale and have high accuracy. On the other hand, texture and RGB values of the surface of the object obtained by a laser scanner have lower resolution and poorer radiometric characteristics in relation to the textures captured with a digital camera.
Scientific research and the goal of this paper are to increase the accuracy and readability of the 3D model with textures obtained with a digital camera. Laser scanning was performed with triangulation scanner of high accuracy, Vivid 9i (Konica Minolta), while for photogrammetric recording digital camera Nikon D90 with a lens of fixed focal length 20 mm, was used.
It is important to stress that a posteriori accuracy score of the global registration of point clouds in the form of the standard deviation was ± 0.136 mm while the average distance was only ± 0.080 mm. Also research has proven that the quality projection texture model increases readability.
Recording of archaeological artefacts and making their photorealistic 3D model greatly contributes to archaeology as a science, accelerates processing and reconstruction of the findings. It also allows the presentation of findings to the general public, not just to the experts.
* Corresponding author. This is useful to know for communication with the appropriate person in cases with more than one author. International Archives of the Photogrammetry, Remote Sensing and Spatial Information Sciences, Volume XXXIX-B5, 2012
1. INTRODUCTION
Determining the position, size and shape of the scanned object is a necessary part of any project related to the preservation of cultural heritage as an integral part of the overall project documentation and the necessary background for the analysis. The introduction of new methods of collecting 3D data and increasing computer literacy of users increases the demand for 3D data.
While getting familiar with the methodology of archaeological research, treatment and reconstruction of archaeological artefacts, the need for laser scanning and collecting large amounts of graphical and textual information about the artefacts was recognized.
An example of documenting the amphora type "Dressel 2-4 Catalan" by freehand archaeological drawing and a photograph of the same artefact can be found below (Figure 1).
Figure 1. Archaeological drawing and a photograph of Roman Amphorae: “Dressel 2-4 Catalan”.
When artefacts are freehand drawn errors may occur due to human factors. The accuracy of the 3D model obtained by a laser scanner is of high accuracy, much higher than the freehand drawing accuracy of professional artists of archaeological objects.
3D models enable virtual reconstruction of archaeological artefacts, buildings and their architectural specifics, such as the reconstruction of the vaults in which are found only collapsed stone blocks.
In the following of this paper it is stated that the best method for documenting archaeological artefacts is the fusion of terrestrial laser scanning (TLS) and close range photogrammetry (CRP). 3D models obtained with this method are of high accuracy as well as high texture resolution.
El-Hakim (2001) argues that there is no system that can automatically collect data on all types of objects. He proposes a combination of digital images and cloud points and adds the need for using the known geometry shapes. Velios and other (2002) compare and discuss the issues of practicality of laser scanning and digital close range photogrammetry.
While using digital close range photogrammetry for documenting artefacts it is necessary to determine image quality of those images.
Image quality can be measured using different measures. General measures can be divided into subjective and objective measures of image quality, while subjective measures provide observers and objective measures are the result of measurements or measuring instruments or are calculated using mathematical formulas and models.
The simplest and most widely used full-reference quality metric is the mean squared error (MSE) or root mean squared error
(RMSE), computed by averaging the squared intensity difference of distorted and reference image pixels, along with the related quantity of peak signal-to-noise ratio (PSNR). These are appealing because they are simple to calculate, have clear physical meanings, and are mathematically convenient in the context of optimization (Wang and others, 2004).
Wang and Bovik (2004) in their paper state that the goal of research in objective image quality assessment is to develop quantitative measures that can automatically predict perceived image quality.
Sakuldee and Udomhunsakul (2007) propose an objective image quality assessment to measure the quality of gray scale compressed image, which is correlation well with subjective quality measurement.
2. DATA ACQUSITION
Today, quality documentation of cultural heritage is of great importance. One of the best ways to document is the creation of virtual replicas of objects. To create virtual replicas of artefacts two methods of data acquisition were used:
Laser scanning
Close-range photogrammetry.
2.1 Selection of artefact
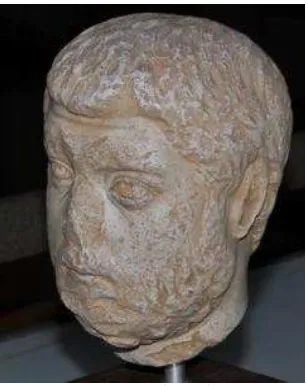
Analysis of accuracy and readability of textures of 3D models requires the recording is carried out under controlled lighting conditions. For this reason, a small archaeological artefact was selected which is easy to handle in such circumstances. Archaeological artefact "Portrait of a bearded man" was selected for the case study. It is made of marble, 13.5 cm in height and 10 cm in width in the height of the mouth (Figure 2). Artefact dates from the second half of the third century.
Figure 2. Archaeological artefact
2.2 Laser scanning
The collection of highly accurate data of the geometry of artefact was performed by laser scanner Konica Minolta VIVID 9i (Figure 3). This is a highly accurate scanner based on the triangulation method, whose work area is <2.5 m. The scanner has the option of registering the RGB values of each recorded point. Before scanning, the calibration of the scanner was performed on the test field and the established a priori accuracy of the measured data was ±50μm.
Figure 3. Close range scanner VIVID 9i
After the scanning it is necessary to carry out processing of measured data, which is consisted of several phases:
Point cloud editing
Manual registration
Global registration
Merging models
In the global registration process (Figure 4) value of a posteriori accuracy of the 3D model was calculated:
Average distance: ±0,080 mm
Standard deviation: ±0,136 mm
Figure 4. Global registration
2.3 Close range photogrammetry
Second, independent survey method was used for documentation of artefact that is close range photogrammetry. Digital camera Nikon D90 with lens Sigma fixed focal length f = 20mm was used for capturing images. Photogrammetric method yielded high-quality textured 3D models.
3. CONCEPT OF FUSION
So far, several approaches have been developed in an effort to data obtained from both sensors register together. The papers listed below have applied various fusion concepts for documenting cultural heritage.
Authors Gonzalez-Aguilera and others in their work from 2009 introduce the method of automatic orientation of digital images and point clouds based on the correlation.
Lambers and others in the paper from 2007 describe a different approach. Projecting textures on 3D model was made based on elements of external orientation of images obtained with photo triangulation.
Authors Akca and others (2007) carried out fusion of TLS and DF by projecting images on a 3D model by the principles of
central projection, based on identical points on the point cloud and digital image.
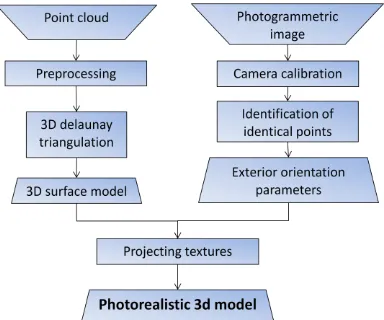
For the research described in this paper it was developed a concept of fusion (Figure 5) which is based on the performance of two independent methods of measurement: TLS and CRP. Identical points on the object and the field points which were located behind the object at the time of recording were used for the orientation of images to the point cloud.
Figure 5. The concept of fusion CRP and TLS
The process of projecting the textures shown in the concept of fusion is based on inverse mathematical model of central projection, which describes the ideal central projection of the content from the image plane in the object area (collinearity equations).
3.1 Hypothesis
This paper analyzes the accuracy and readability of the texture of the 3D model obtained by two independent methods: TLS and CRP. Considering this is a scientific research it is necessary to define hypothesis.
Hypothesis 1: Geometric accuracy of the 3D model obtained by TLS is greater than the accuracy of the model obtained by CRP. Hypothesis 2: Photorealistic model obtained by fusion of CRP and TLS has a higher coefficient of readability of the models obtained only with TLS.
4. OBJECTIVE IMAGE QUALITY MEASURES
During the research of image quality 4 different measures were taken into consideration:
RMSE (Root Mean Squared Error)
PSNR (Peak Signal-to-Noise Ratio)
SNR (Signal-to-Noise Ratio)
MAE (Mean Absolute Error)
IQM (Image Quality Measure)
4.1 Root Mean Squared Error
The goal of a signal fidelity measure is to compare two signals by providing a quantitative score that describes the degree of similarity/fidelity or the level of error/distortion between them. Usually, it is assumed that one of the signals is original, while the other is distorted or contaminated by errors (Wang, Z., 2009).
The small value of MSE means that image is high quality. International Archives of the Photogrammetry, Remote Sensing and Spatial Information Sciences, Volume XXXIX-B5, 2012
Variables r(x,y) and t(x,y) represent two visual images, discrete signals, where nx, ny is the number of pixels (signal samples). The RMSE between the signals is (1):
L is the dynamic range of allowable image pixel intensities. For example, for images that have allocations of 8 b/pixel of gray-scale, L = 28− 1 = 255. Variables r(x,y) and t(x,y) represent two visual images, discrete signals, where nx, ny is the number of pixels (signal samples).
The PSNR is useful if images having different dynamic ranges are being compared, but otherwise contains no new information relative to the MSE (Wang, Z., 2009).
4.3 Signal-to-Noise Ratio
Signal-to-Noise Ratio is defined as the power ratio between a signal or the meaningful information and the background noise or the unwanted signal (4 and 5).
necessarily the most powerful signal possible) and noise. Measuring signal-to-noise ratios requires the selection of a representative or reference signal.
SNR is usually taken to indicate an average signal-to-noise ratio, as it is possible that (near) instantaneous signal-to-noise ratios will be considerably different.
The large value of SNR means that image is high quality.
4.4 Mean Absolute Error
In statistics, the mean absolute error (MAE) is a quantity used to measure how close forecasts or predictions are to the eventual
For the purpose of testing the accuracy of the above mentioned hypothesis, analyses were conducted and their results are shown in the following of the paper.
5.1 Analysis of the increase in accuracy
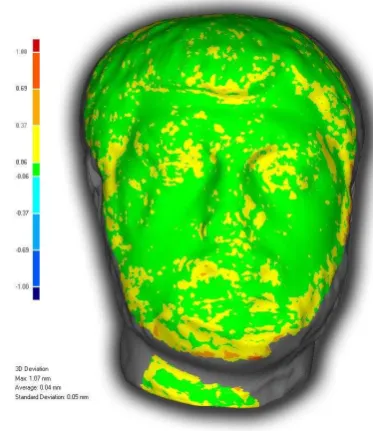
After creating 3D models based on the scans obtained by laser scanner we’ve analyzed the deviation of the initial scan to final 3D model. Spatial variations are shown in Figure 6 with green spatial differences of less than ± 0.06 mm. Numerical indicators of spatial variations of two surfaces are expressed with the following values:
Maximum deviation: 1.07 mm
Average deviation: 0.04 mm
Standard deviation: ±0.05 mm.
Figure 6. Graphical representation of spatial differences in the 3D models
3D model obtained from close range photogrammetry has standard deviation of ±0.722 mm. That it in comparison with the same 3D model obtained with laser scanner much lower accuracy.
5.2 Analysis of readability
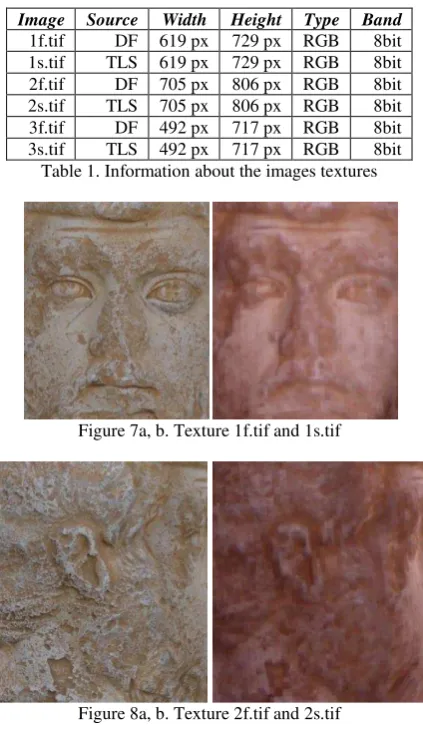
As mentioned before texture of 3D models were collected with scanner and digital camera. To test the second Hypotheses it must be tested whether texture obtained by CRP have a higher degree of readability. The study was conducted on 3 characteristic patterns (Figures 7, 8, 9). Pairs of sample textures are identical areas on the 3D model. Texture with suffix f was obtained by photogrammetry while the texture with the suffix s was obtained from the scanner. Table 1 shows the information about the images that were used in the study.
Image Source Width Height Type Band
Table 1. Information about the images textures
Figure 7a, b. Texture 1f.tif and 1s.tif
Figure 8a, b. Texture 2f.tif and 2s.tif
Figure 9a, b. Texture 3f.tif and 3s.tif
At first glance one can see that the texture produced by laser scanner has lower quality then textures obtained from photogrammetry. Still, it had to be demonstrated with quantified methods. In the previous chapter were shown the formulas under which the values of quality texture were calculated. ImageJ software was used for preparation and image processing. Image Quality Measure (IQM) Mitre software was
used to calculate the value of IQM. SNR, PSNR, RMSE, MAE and IQM values were calculated for each channel (RGB) of Table 2. The values of image quality for its channels (RGB)
Image SNR [dB] PSNR [dB] RMSE MAE IQM
Table 3. The values of quality images in greyscale
6. CONCLUSIONS
The goal of this scientific research was to prove the increase of accuracy and readability of the photorealistic 3D model obtained with a digital camera.
In all samples it is visible that the textures obtained by photogrammetry have higher values of SNR, PSNR, IQM and lower values of RMSE and MAE. From the values of objective image quality measurements shown in the chapter 5 (Tables 2 and 3) it can be concluded that the textures obtained with CRP have higher quality and readability. Based on the findings presented in the previous section we can conclude that Hypothesis 2 is fully accepted.
In comparison between geometric accuracy of 3D models obtained with TLS and CRP it is shown that the model obtained with TLS has much higher accuracy. It is proven that the a posteriori accuracy of the 3D model obtained by a laser scanner is equal to a priori accuracy of laser scanning obtained on the calibration basis. From the result of these tests we can conclude that hypothesis 1 can be accepted.
It should be noted that 3D models of archaeological artefacts obtained by fusion of laser scanning and close range photogrammetry are fully measurable, written in 1:1 scale and have high texture and geometric accuracy.
7. REFERENCES
Akca, D., Grün, A., Breuckmann, B., Lahanier, C. (2007): High definition 3D-scanning of arts objects and paintings, Institute of Geodesy and Photogrammetry, ETH, Zürich, Switzerland.
El-Hakim, S. F. (2001): Three-dimensional modeling of complex environments. In: Videometrics and Optical Methods for three-dimensional Shape Measurement, San Jose, Jan 20-26, SPIE Vol. 4309, pp. 162-173.
González-Aguilera, D., Rodríguez-Gonzálvez, P., Gómez -Lahoz, J. (2009): An automatic procedure for co-registration of terrestrial laser scanners and digital camera, ISPRS Journal of Photogrammetry and Remote Sensing, 64, pp. 308-316.
Lambers, K., Eisenbeiss, H., Sauerbier, M., Kupferschmidt, D., Gaisecker, T., Sotoodeh, S., Hanusch, T. (2007): Combining photogrammetry and laser scanning for the recording and modelling of the Late Intermediate Period site of Pinchango Alto, Palpa, Peru, Journal of Archaeological Science, 34, pp. 1702-1712.
Nill, N., Bouzas, B. 1992. Objective Image Quality Measure Derived from Digital Image Power. Optical engineering, 31(4), pp. 813 – 825.
Sakuldee, R., Udomhunsakul, S., 2007: Objective Performance of Compressed Image Quality Assessments. World Academy of Science, Engineering and Technology 35, pp. 154-163.
Velios, A., Harrison, J.P. (2002): Laser scanning and digital close range photogrammetry for capturing 3D archaeological objects: a comparison of quality and practicality. In: G. Burenhult (ed.), Archaeological Informatics: Pushing the Envelope, CAA 2001, Oxford, str. 205-211.
Wang, Z., Bovik, A., 2004: Image Quality Assessment: From Error Visibility to Structural Similarity. IEEE transactions on image processing, 13(4), pp. 1-14.
Wang, Z., Bovik, A., 2009: Mean Squared Error: Love it or Leave it? IEEE signal processing magazine, 26(1), pp. 98-117.
ImageJ – Image Processing and Analysis in Java. http://rsbweb.nih.gov/ij/ (15. Jan. 2012).
MITRE - Image Quality Evaluation. http://www.mitre.org (11. Jan. 2011).
Roman Amphorae: Dressel 2-4 Catalan, ADS - Archaeology Data Service. http://ads.ahds.ac.uk/catalogue/archive/
amphora_ahrb_2005/details.cfm?id=94 (17. Jan. 2012).