CLASSIFICATION BY USING MULTISPECTRAL POINT CLOUD DATA
Chen-Ting Liao a, *, Hao-Hsiung Huang a
a Department of Land Economics, National Chengchi University,
64, Sec. 2 Zhinan Rd., 11605 Taipei, Taiwan – [email protected], [email protected]
Commission III, WG III/2
KEY WORDS: Classification, Image Matching, Close Range Photogrammetry, Infrared, Point Cloud
ABSTRACT:
Remote sensing images are generally recorded in two-dimensional format containing multispectral information. Also, the semantic information is clearly visualized, which ground features can be better recognized and classified via supervised or unsupervised classification methods easily. Nevertheless, the shortcomings of multispectral images are highly depending on light conditions, and classification results lack of three-dimensional semantic information. On the other hand, LiDAR has become a main technology for acquiring high accuracy point cloud data. The advantages of LiDAR are high data acquisition rate, independent of light conditions and can directly produce three-dimensional coordinates. However, comparing with multispectral images, the disadvantage is multispectral information shortage, which remains a challenge in ground feature classification through massive point cloud data. Consequently, by combining the advantages of both LiDAR and multispectral images, point cloud data with three-dimensional coordinates and multispectral information can produce a integrate solution for point cloud classification. Therefore, this research acquires visible light and near infrared images, via close range photogrammetry, by matching images automatically through free online service for multispectral point cloud generation. Then, one can use three-dimensional affine coordinate transformation to compare the data increment. At last, the given threshold of height and color information is set as threshold in classification.
*
Corresponding author.
1. INTRODUCTION
Passive remote sensing systems record electromagnetic energy reflected or emitted from the surface as two- dimensional multispectral images. The general used bands are blue (0.45∼0.52μm), green (0.52∼0.60μm), red (0.63∼0.69μm), Near Infrared (0.70∼1.3μm), Middle Infrared (1.3∼3μm) and thermal Infrared (3∼14μm). Due to ground features have their own characteristic in different spectrum, while classifying through Multispectral Images, generally, higher divergence between bands, may lead to higher classification accuracy. Therefore, one can interpret ground features effectively by collecting multispectral images, for example, healthy vegetation reflects massive near infrared light, and water body absorbs near infrared light, so one can use near infrared light with other bands for recognizing vegetation and water body.
LIDAR is an active remote sensing system, which can acquire ground feature point cloud data through laser scanning technique; this allows remote sensing data development toward three-dimensional space. Point cloud data includes three dimensional coordinates, intensity and other abundance spatial information, which contains much more potential to interpret ground features than two-dimensional image does. In general, LIDAR scans ground features by single band laser light, for instance, green lasers at 0.532μm has water penetration ability, and vegetation has high sensitive to near infrared laser light region in 1.04μm to 1.06μm (Jensen, 2007). Generally, point cloud data is acquired only through single band laser light, and lack of multispectral information.
Consequently, this research uses close-range photogrammetry method to collect visible light and near infrared images, and
chooses free online service – Photosynth, which is provided by Microsoft, as automatically image matching technique for point cloud generation. After exporting the point cloud data, one can use three-dimensional affine coordinate transformation to merge multispectral point cloud and visible light point cloud data, as a check for the accuracy and precision for multispectral point cloud data. Comparing with point cloud data generated by using visible images, increment of multispectral point cloud data acquired by adding near infrared images were then evaluated. Thereafter, the multispectral point clouds for ground feature were classified. The results of classification have been analysed, for understanding whether the point clouds generated by multispectral information have good potential in classification.
2. BACKGROUND
Ground features have diffuse reflectance properties respectively. Understanding of the spectral reflectance of ground features can assist in distinguishing and recognizing diffuse ground features. Generally, collecting visible light image can only acquire spectral reflectance from 0.4μm to 0.7μm by collecting other band, e.g. near infrared light, the spectrum beyond visible light can be obtained, which can interpret ground feature effectively. By matching multispectral images through free online service, such as Photosynth, one can get point cloud data from image collected in close range; via three-dimensional coordinate transformation, combining it with visible light point cloud data, therefore one can compare and analyze the benefit of multispectral images on increasing point cloud data and classification assisting ability.
The following sections will introduce the advantage in ground feature interpretation by adding near infrared, brief introduction
of Photosynth and three-dimensional affine coordinate transformation used in point cloud generation.
2.1 Near Infrared Light
Near infrared (NIR) light is close to red light in spectrum, its wavelength is in region from 0.7μm to 1.3μm, healthy vegetation and water body has special reflective characteristic in NIR band, so it is beneficial to recognize them from other ground features. As the spectral reflectance plot of vegetation and water body shown in Figure 1, one can find out the high reflectance of vegetation in NIR is at approximately 40%; the reason is that the chlorophyll of healthy vegetation absorbs red light but reflects massive NIR light. On the other hand, the high reflectance in water body is at blue and green band, but the reflectance in NIR band is approximately 0%; the reason is that water is a bad reflector, so it only reflects a few blue and green light, but the electromagnetic energy of other band is absorbed. Therefore, vegetation appears brighter and water body appears darker in NIR images, by this characteristic, it can be interpreted easily. One can recognize even more vegetation and water body when using a color infrared image.
Figure 1. Spectral reflectance of vegetation and water body (Jensen, 2007)
2.2 Photosynth
Photosynth was established by University of Washington and Microsoft Live Labs, as an online virtual reality application, it has been released to the public on August, 2008. Users can upload their images taken in different view angles and distances with overlapping areas to its website, through image matching technology provided by Photosynth, it can stitch panoramas and generate point clouds of photographed area. The image matching algorithm is Scale-Invariant Feature Transform (SIFT), published by David Lowe on 1999 (Lowe, 1999); this computer vision based algorithm detects key points in local images, then compute the invariant key points in different scale space, by describing the invariant image translation, scaling and rotation factors, it can generate point clouds with three-dimensional coordinates and color information (Chen and Hwang, 2010). If one using homogeneous images, then less point clouds will be generated; but one using heterogeneous images, then more point clouds may be generated.
2.3 Three Dimensional Affine Coordinate Transformation
Three-dimensional conformal coordinate transformation is generally used, when combining different three-dimensional coordinate systems, as shown in equation (1), which contains 1 scaling factor s, 3 rotation factors (ω, ϕ, and κ in three matrixes, Mx, My, and Mz) and 3 translation factors (Tx, Ty, Tz), at least two horizontal and three vertical control points are required to
compute seven parameters, thus it is so called seven parameter transformation.
In three-dimensional conformal coordinate transformation, there are only one scaling factor s for xyz axes, since it is suitable for stable coordinate systems; in case of point clouds generated from Photosynth, which contains image matching by different view angles and distances may produce different scaling on x, y and z axes respectively, it can be avoided by using three-dimensional affine coordinate transformation, as shown in equation (2) (Wolf and Dewitt, 2004).
By comparing equations (1) and (2), the later one has added 3 scaling factors on x, y and z axes respectively, which contains 3 scaling factors (sx, sy, sz), 3 rotation factors (Mx, My, Mz) and 3 translation factors (Tx, Ty, Tz), at least three three-dimensional control points are required to compute nine parameters, thus it is so called nine parameter transformation.
3. METHOD
The research area, instrument used, and procedure are described as follows.
3.1 Research Area
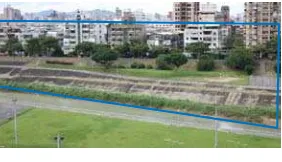
For testing the effect of adding NIR images in image matching, this research chooses rich vegetation growth area as research object, expecting to separate vegetation from manmade structures through NIR band, also, matching visible light images to generate point clouds. The research area is shown in Figure 2, which contains of trees, grasses, buildings and cement dike planes.
Figure 2. Oblique view of research area 3.2 Instrument
By using Canon EOS 5D digital SLR camera with NIR detection ability to collect images, then stabilized the camera on a tripod to photographed visible light images, afterwards, by adding a 0.72μm NIR filter, which allows spectrum wavelength larger than 0.72μm to pass, photographed NIR images in the same view angle. After adding NIR filter, the illumination 0
becomes lower; therefore, longer exposure time had been set to acquire clear NIR images, the detailed camera settings are listed in Table 1.
Image Category Visible Light Near Infrared
Focal Length 50 mm 50 mm
Shutter Speed 1 / 512 sec. 1 sec.
Aperture f / 8 f / 8
Exposure Time 1 / 500 sec. 1 sec. Table 1. Camera settings
3.3 Procedure
The research procedure is as follows. After research area selection, first, by stabling the digital camera on a tripod, photographed images of the research area in both visible light and NIR light from the same view angle, then move on to next stop parallel to the research area.
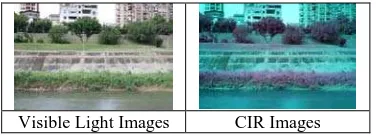
Second, by combining images with different band combinations through digital image processing, one can split blue, green and red band from visible light and NIR images, then, set the red band from NIR image as near infrared band, which creates a color infrared (CIR) composition with band green, red, NIR as channel blue, green and red. The two image categories in this research are visible light and CIR. As shown in Figure 3. Third, by uploading the two categories images to Photosynth website to generate point clouds, then, downloading the .ply file with SynthExport software in ASCII format, next, importing the xyz coordinates and RGB information from .ply file to a shapefile in ArcScene through Arc toolbox; by choosing at least three pairs of feature points as control points for three-dimensional affine coordinate transformation manually, afterward, set the unit weight standard deviation of the coordinate transformation as a threshold. If the unit weight standard deviation is conformed to the threshold, then, one can combine the CIR point cloud data to the visible light point cloud coordinate system; else, the feature point should be chosen and the transformation parameters being computed again, until the unit weight standard deviation is conformed to the threshold.
Fourth, checkpoints were chosen manually, by computing its xyz direction error, positioning error and root mean squared error (RMSE), the accuracy of multispectral point clouds can be checked, and the beneficial of matching multispectral images to increase point cloud data can be analyzed.
At last, by computing the Normalised Difference Vegetation Value (NDVI) from color information contain in CIR point cloud. The data was classified by using height and color information as threshold into several categories, and the results are compared with the manually classify results.
Visible Light Images CIR Images Figure 3. Image categories for point cloud generation
4. RESULTS
The point clouds generated by two categories images are differed in coordinate systems, therefore, control points should be selected and transformed into the same coordinate system, then, the positioning error could be checked to comprehend the accuracy of Photosynth point clouds, therefore, the ratio of multispectral point clouds assisting visible light ones can be computed. Finally, the CIR point cloud can be classified through height and color information threshold. Figure 4 shows the spatial distribution of the 8 control points and 12 check points selected in the research area.
Figure 4. Spatial distribution of control points and check points 4.1 Visible Light Point Cloud
The point cloud generated by visible light images distributed over the whole research area, the inclined dike plane, buildings and trees can be seen clearly in the scene. After filtering out the noise, it remains 124,337 points generated from 92 images. This data has been set as the main data for comparing with the CIR data, so the CIR data was transformed in to the local coordinate system of visible light ones.
4.2 Color Infrared Point Cloud
The point cloud generated by color infrared images, also distributed over the whole research area, the obvious features are interpretable in the scene. After filtering out the noise, it remains 127,103 points generated from 92 images. By comparing it with visible light point cloud, one can find an obvious systematically bias in depth, which is the x axis direction of the local coordinate system. And on the y direction, it also produces a distortion, which made the three-dimensional affine transformation much harder. Therefore the maximum check point positioning error is 6.499 unit, and the RMSE is ±
4.420 unit.
4.3 Assessment of Multispectral Point Cloud Increment
After combining the CIR data and the visible light data, the accuracy can be accessed through check points. One can set visible light point clouds as base data to compare the similarities and dissimilarities between CIR data, by overlapping it on visible light data; one can use RMSE as a distance threshold to calculate similarity points. On the other hand, assume that all the noise has been filtered out, so the unselected points can be considered as dissimilarity points. The increment of the CIR data is shown in Figure 5, green, cyan and red individually represents visible light, similarity and dissimilarity point cloud from CIR data. One can find the increment data focus on the building, and the similar data focus on the trees, grasses and cement planes. By computing the
Check Points Control Points
increment data, it shows that only 0.3% of data amount was increased by using CIR images. The detailed results are shown in Table 2.
Figure 5. Overview of multispectral point cloud data Unit: Points Image Category Visible Light CIR
Photosynth Data 124,377 127,103
Similarity Points -- 126,715
Dissimilarity Points -- 388
Data increment by CIR Point Cloud Data = 388 / (388 + 124,377) = 0.3 %
Table 2. Multispectral point cloud increment information 4.4 Classification
Multispectral image produces more spectral information than visible light images. Therefore, by using the xyz coordinates and color information generated from Photosynth, it is benefit in classification. This subsection focused on using the height and color information as threshold to classify some basic ground features in the research area.
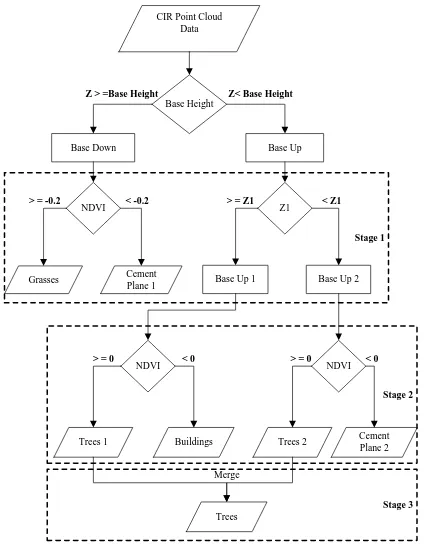
The CIR similarity points were used as input data. First, by choosing one elevation as base height, the data is divided into upper base and lower base. Then, NDVI was computed through the greyscale value of NIR and red band contained in multispectral point cloud. In stage 1, the lower base was classified through NDVI threshold. It was selected by viewing the NDVI histogram, afterward, the grasses and cement plane 1 were classified individually. On the other hand, upper base was divided continually through height into upper base 1 and upper base 2. Later on, the upper base 1 and base 2 were classified respectively by NDVI threshold. Then, one can get trees 1 and buildings from upper base 1, in addition, trees 2 and cement plane 2 from upper base 2. Finally, by merging trees 1 and trees 2, the category of trees can be provided. Figure 6 shows the classification flow chart.
Through these classification thresholds, the CIR point cloud data can be classified into five categories, buildings, cement plane 1, cement plane 2, trees and grasses. Afterward, the threshold classification results were assessed by manually classification results. The illustrations of classification of both methods are shown in Figure 7, and the computed classification results are listed in Table 3. As the result shows, threshold classification has omission error around 36% in trees and grasses; and commission error in buildings and cement planes. Most of the building points and cement plane 2 actually include tree points, as shown in Figure 7. But one interesting point is, when classifying through NDVI, the grasses growing on the cement plane or bare soil within grasses can be detected.
Stage 1 Base Down
Base Height
Base Up CIR Point Cloud
Data
NDVI
Grasses Cement Plane 1
Z1
Base Up 1 Base Up 2
NDVI NDVI
Trees 2
Trees 1 Buildings Cement
Plane 2
Trees
Stage 2 Z > =Base Height Z< Base Height
> = -0.2 < -0.2
> = 0 < 0 > = 0 < 0
Merge
> = Z1 < Z1
Stage 3
Figure 6. Classification flow chart
(a) Manually Classified (b) Threshold Classified Figure 7. Different classification results
Unit: Points Categories Manually Threshol
d Commission Omission Buildings 9,548 15,538 5,990
(38.55%) -- Cement
Plane 1 38,949 60,610
21,661
(35.74%) -- Cement
Plane 2 5,353 12,941
7,588
(58.64%) --
Trees 10,911 6,986 -- 3,925
(35.97%)
Grasses 45,070 30,640 -- 18,718
(37.92%) Table 3. Classification assessment
5. SUMMARY
According to the results, overall accuracy, classification results and the suggestions are described in following sections respectively.
5.1 Overall Accuracy
The CIR point cloud data generated by multispectral images were transformed into the local coordinate system of visible light point cloud, for data increment analyzing. The maximum check point positioning error is 6.499 unit, and the RMSE is ±
4.420 unit. It can be considered that although CIR and visible light point cloud data covers the whole research area, but it is difficult to ensure the control points are the same feature pairs. Therefore, the RMSE seems not so well. Due to high RMSE, the data increment analyzed by point to point distance threshold was influenced. Most of the probable increment data were unable to detect, only 0.3% of data increment was calculated. 5.2 Classification Results
Although it is difficult to tell the benefit by adding NIR band in image matching, but it is sure to improve the ability in classification. By using the xyz coordinate and RGB greyscale value provided in Photosynth, it is possible to compute the NDVI, which can be considered as a criterion to classify ground features. By combining the z coordinate from point cloud, and the RGB greyscale value from multispectral images, the CIR point cloud data is classified into five categories. The result shows approximately 36% of commission and omission error, but when focusing on the category of cement plane 1, one can see grasses being classified out of cement by using the NDVI as threshold. This makes the multispectral point cloud more advance for classification than LiDAR point cloud.
5.3 Suggestions
(1) The three-dimensional affine coordinate transformation used in combining two data still remains some systematic errors, due to the manually selection of effective control points. Other point cloud registration method should be considered for better coordinate transformation results.
(2) Besides of using NDVI and height as classification threshold, other index value or band greyscale value may be adopted. Also, one should avoid illumination difference in the same view angle of visible light and NIR images. Since this may cause wrong NDVI while computing.
(3) The classified point cloud data can be used in visualizing a three-dimensional idea of traditional two-dimensional results. Also, DEM generation and building tree models are available in further studies.
6. REFFERENCE
Chen, Szu-Han and Jin-Tsong Hwang, 2010. Precision Analyses of Photosynth point cloud data. In: The 29th Conference on Surveying and Geomatics, Taipei, CD-ROM, S-205, 8 pages.
Lowe, David G., 1999. Object Recognition from Local Scale-Invariant Features. In: Proceeding of the International Conference on Computer Vision, pp. 1150-1157.
Jensen, John R., 2007. Remote Sensing of the Environment: An Earth Resource Perspective, 2nd Edition. Pearson Education, Inc., pp. 443-506.
Wolf, Paul R. and Bon A. Dewitt, 2004. Elements of Photogrammetry: with Applications in GIS. 3rd Edition. McGraw-Hill, pp. 518-550.