3D MODELLING AND RAPID PROTOTYPING FOR CARDIOVASCULAR SURGICAL
PLANNING
–
TWO CASE STUDIES
E. Nocerino a, *, F. Remondino a, F. Uccheddu b, M. Gallo c, G. Gerosa c
a 3D Optical Metrology (3DOM) unit, Bruno Kessler Foundation (FBK), Trento, Italy -
(nocerino, remondino)@fbk.eu
b DIEF, Dipartimento Ingegneria Industriale, Università di Firenze, Florence, Italy -
c Division of Cardiac Surgery, Department of Cardiac, Thoracic and Vascular Sciences, University of Padua, Padova, Italy - [email protected], [email protected]
Commission V, WG 5
KEY WORDS: Rapid prototyping, 3D modelling, 3D printing, Rapid prototyping, Medical imagery, DICOM, Heart, Cardiovascular diseases, Surgical planning
ABSTRACT:
In the last years, cardiovascular diagnosis, surgical planning and intervention have taken advantages from 3D modelling and rapid prototyping techniques. The starting data for the whole process is represented by medical imagery, in particular, but not exclusively, computed tomography (CT) or multi-slice CT (MCT) and magnetic resonance imaging (MRI). On the medical imagery, regions of interest, i.e. heart chambers, valves, aorta, coronary vessels, etc., are segmented and converted into 3D models, which can be finally converted in physical replicas through 3D printing procedure. In this work, an overview on modern approaches for automatic and semi-automatic segmentation of medical imagery for 3D surface model generation is provided. The issue of accuracy check of surface models is also addressed, together with the critical aspects of converting digital models into physical replicas through 3D printing techniques. A patient-specific 3D modelling and printing procedure (Figure 1), for surgical planning in case of complex heart diseases was developed. The procedure was applied to two case studies, for which MCT scans of the chest are available. In the article, a detailed description on the implemented patient-specific modelling procedure is provided, along with a general discussion on the potentiality and future developments of personalized 3D modelling and printing for surgical planning and surgeons practice.
1. INTRODUCTION
According to the World Health Organization (WHO), cardiovascular diseases (CVDs) are the first cause of human death. They include all the diseases of the heart and circulation including coronary heart disease, angina, heart attack, congenital heart disease (CHD) and stroke. The incidence of CVDs can be reduced through prevention by controlling behavioural risk factors, such are unhealthy diet, physical inactivity, tobacco use and alcohol abuse. Nevertheless, surgery still represents the ultimate solution for defects or abnormality of the heart and blood vessels that can be present from birth (congenital) or arise because of age.
In the meantime, population ageing is generally growing, thanks to the improving life conditions (better nutrition, health care, economic well-being). This translates in a health care system that has to deal with a constantly increasing number of potential patients and, consequently, needs be more efficient.
In the last years, diagnosis, surgical planning and intervention have taken advantages from 3D modelling and rapid prototyping techniques. The procedure starts from the collection of medical imagery, usually in the form of volumetric data that consists in sequentially 2D slices and represents the internal structures of human body. Parts of interest (tissues, organs, etc.) are segmented and transformed in 3D models that can be physically reproduced through rapid prototyping procedures. The paper discusses all the steps of the outlined procedures, presenting a brief introduction on medical imaging and CT technology (Section 2), with a detailed review of the existing methods for medical imagery analysis and processing Sections 3, 4 and 5). An overview about 3D printing technology adopted for medical applications is also provided (Section 6). Moreover, two case studies are presented (Section 7): a patient-specific procedure has been adopted with the aim of producing physical replicas for surgical planning in case of complex heart diseases.
Figure 1. Patient-specific 3D modelling and rapid prototyping workflow.
* Corresponding author
2. MEDICAL IMAGING
Medical imaging includes different imaging modalities and processes that aim at achieving and displaying information about the interior of human body for diagnostic and treatment purposes. Over the years, a plenty of different medical imaging modalities has been developed, using different technology and creating different kinds of images. Common types of medical imaging include: (i) X-ray (radiography, computed tomography – CT, etc.), (ii) magnetic resonance imaging (MRI), (iii) ultrasound and (iv) nuclear medicine (e.g., positron emission tomography - PET). Each of them has its own advantages and disadvantages,
both for potential patient’s health hazard (some of them require exposure to radiation) and information gathered and displayed. For example, CT and MRI are sensitive to different tissues properties, so that soft tissues are poorly visible in CT images, while they are distinctly evident in MRI.
CT, PET, MRI provide 3D information in the form of thin
cross-sectional “slices” of the entire body or parts of interest, and are therefore called tomography imagery. The slices are provided in the form of digital pictures stacked through the measurement volume, where each pixel represents the spatial position of the imaged element and its colour (grey or RGB values) the reaction of the tissue to radiation (X-rays or gamma-rays) or magnetic field, in case of CT, PET and MRI respectively.
Medical imagery usually provide data organised in a Cartesian rectilinear grid, which can be either isotropic or anisotropic, depending whether the intra-slice distance is equal to the in-slice resolution or not.
In CT scan, an X-ray source, a tube, produces an X-ray beam that passes through the patient body. Some photons are then absorbed, other scattered. The attenuated X-rays are collected by X-ray detectors on the opposite side and converted into digital data, collected into square digital images. The value of each pixel in a CT scan represents the attenuation value or reduction of X-ray transmission, which depends on the atomic composition and density of the crossed tissue. The attenuation values are expressed in Hounsfield units (HU) that represent the attenuation measurement relative to water (Equation 1). The Hounsfield scale is a linear scale, ranging from -1024 to +3071 HU. The value of each element of the 2D scan is computed as:
� � � � , = ×�� , − � ����
����− ����
(1)
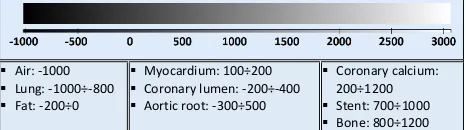
where water and air are respectively the linear attenuation of water and air. The attenuation coefficient of air is nearly zero, so that a change of one Hounsfield unit (HU) can be interpreted as a change of 0.1% of the attenuation coefficient of water. Figure 2 shows typical HU values for different tissues
Air: -1000 Figure 2: Hounsfield map grey scale representation and tissues
densities, used visualization of CT data.
2.1 Cardiac CT
In cardiac CT, there are two imaging procedures: coronary calcium scoring with non-contrast CT and non-invasive imaging of coronary arteries with contrast-enhanced CT.
Typically, non-contrast CT imaging exploits the natural density of tissues. As a result, various densities using different attenuation values such as air, calcium, fat, and soft tissues can be easily distinguished. In comparison, contrast-enhanced CT is used for imaging of coronary arteries with contrast material such as a continuous infusion of a high concentration of iodinated contrast material (Schoepf, 2007). Especially in the recent rapid advances in CT technology, CT can provide detailed anatomical information of chambers, vessels, coronary arteries and coronary calcium scoring. Additionally, CT imaging provides functional as well as anatomical information, which can be used for quantitative assessment for wall tickening and regional wall motion (Kristensen et al., 2009).
2.2 DICOM format
Medical imagery are commonly stored in a standard format file, defined by the National Electrical Manufacturers Association (NEMA) known as “Digital Imaging and Communications in Medicine” (DICOM).
Similarly to the Exif tags for digital photographs, DICOM files consists of a number of attributes that contain: (i) patient related information (name, sex, age, etc.), (ii) modality and imaging procedure information (type of machinery, acquisition parameters, radiation dose, contrast media, etc.) and (iii) image related information (image dimension, in-plane resolution or pixel size, slice thickness, slice distance, etc.).
3. IMAGE ENHANCEMENT AND RESTORATION
Digital medical imagery often suffers from different kinds of degradation effects, such as artefacts due to patient motion or interferences, poor contrast, noise and blur (Figure 3).
To improve the quality and visual appearance of medical images, two main procedures are usually adopted, namely image restoration and image enhancement (Al-Almeen et al., 2013). Image restoration algorithms primarily aim at reducing blur and noise in the processed image, naturally related to and introduced by the data acquisition process. Image enhancement techniques are mainly devoted to contrast enhancement, in order to extract or accentuate certain image features. The aim of the enhancement process is to improve the understanding of information content and obtain an image more suitable than the original for automated image processing, such as, for example in the case of medical imagery, for highlighting structures (tissues, organs, etc.) of interest. Range compression, contrast stretching, histogram equalization with gamma correction are usually adopted to enhance the quality of medical images (Preethi & Rajeswari, 2010). In general, despite the effectiveness of each single approach, usually a combination of different methods allows to achieve the most effective image enhancement result (Maini & Aggarwal, 2010).
4. SEGMENTATION AND CLASSIFICATION
Image segmentation is the process of dividing an image into regions with similar properties such as grey level, colour, texture, brightness and contrast (Sharma & Aggarwal, 2010). In medical imagery, the role of segmentation consists in identifying and subdividing different anatomical structures or regions of interest (ROI) in the images. As result of the segmentation task, the pixels in the image are partitioned in non-overlapping regions, belonging to the same tissue class. Some approaches use texture content to perform image segmentation and classification: the aim of texture based segmentation method is to subdivide the image into region having different texture properties, while in classification the aim is to classify the regions which have already The International Archives of the Photogrammetry, Remote Sensing and Spatial Information Sciences, Volume XLI-B5, 2016
a) b) c)
Figure 3. Examples of medical images affected by motion artefacts (a), interferences due to an implanted pacemaker (b) and poor contrast (c).
a) b)
Figure 4. Example of volume rendering (a) and (b) surface mesh model.
been segmented (Sharma & Aggarwal, 2010). Labelling is the process of assigning a meaningful description or annotation to each segmented region based on its features, for example healthy or tumorous tissue (Pham et al., 2000).
Automatic segmentation of medical images is still a difficult task as medical images are complex in nature and often affect by intrinsic issues:
i. partial volume effects, i.e. artefacts occurring when different tissue types mix up together in a single pixel and resulting in non-sharp boundaries;
ii. intensity inhomogeneity of a single tissue class that varies gradually in the image, producing a shading effect; iii. presence of artefacts (Figure 3a and Figure 3b); iv. similarity of grey values for different tissues.
Classifications of existing segmentation methods have been attempted by several authors (see for example: Pham et al., 2000; Sharma & Aggarwal, 2010; Withey & Koles, 2008).
Similarly to other image analysis fields also in medical image segmentation, automatic methods are classified as supervised and unsupervised, where the main difference resides in the operator interaction required by the first approaches throughout the segmentation process.
The methods that identifies regions of interest by labelling all pixels/voxels in the images/volume are known as volume identification methods. On the contrary, approaches that recognises the boundaries of the different regions are called boundary identification methods (Withey & Koles, 2008). Low-level techniques usually relay on simple criteria based on grey intensity values, such as thresholding, region growing, edge detection, etc. More complex approaches introduce uncertainty
models and optimization methods, like statistical pattern recognition (Markov random field – MRF, Bayesian classifiers, etc.), deformable models, graph search, artificial neural networks, etc. Finally, the most advanced methods may incorporate higher-level knowledge, such as a-priori information, expert-defined rules, and models. Methods like atlas-based segmentation and deformable model belong to this last group. For patient-specific application in surgical planning a fully and accurate automatic segmentation approach would be desirable to make the process fast and reliable. Unfortunately, anatomical variability and intrinsic image issues limit the reliability of fully automatic approaches. At the end of the segmentation process, the operator interaction is still required for error corrections (Olabarriaga & Smeulders, 2001). Interactive segmentation methods, employing for example manual segmentations in a small set of slices and automatic classification of the remaining volume using patch-based approach (Pace et al., 2015), provide promising results.
4.1 Segmentation in cardiac imagery
Various segmentation techniques have been proposed for cardiac CT applications. As pointed out in Kirişli et al. (2012), most of the studies realised in the last years focused on the left ventricle (LV), because functional parameters derived from the diastolic and systolic LV volume are important predictors for heart disease (Adabi et al., 2010). Nevertheless, automatic segmentation and modelling of four cardiac chambers is a fascinating and promising research field (Lorenz & von Berg, 2006). A whole total heart model allows for the diagnosis of diseases also in the
S
other chambers, such as left atrial fibrillation and right ventricle (RV) overload.
Funka-Lea et al. (2006) proposed a method to segment the entire heart using graph-cuts. Segmenting the entire heart was performed for clearer visualization of coronary vessels on the surface of the heart. They attempted to set up an initialization process to find seed regions automatically using a blowing balloon that measures the maximum heart volume and added an extra constraint with a blob energy term to the original graph-cuts formulation. Jolly (2006) prosed a method for extracting the myocardium in 4-D cardiac MR and CT images using the graph-cuts as well as EM-based segmentation. Zheng et al. (2008) presented a segmentation method based on the marginal space learning by searching for the optimal smooth surface. Model-based techniques were also adopted for cardiac CT image segmentation using active shape models with PCA (Ecabert et al., 2006), atlas-based segmentation (Išgum et al, 2008; Kirişli et al., 2012), machine learning (Zheng et al., 2008), methods for region growing (Dey et al., 2008; Mühlenbruch et al., 2006) and volumetric data on a 2D screen. All the methods can be broadly classified into two main approaches, namely 2D and 3D display techniques (Robb, 2003). 3D display methods can be further divided into two branches: (i) 3D visualization and rendering (Figure 4a), (ii) surface (Figure 4b) and volume meshing. The first class of techniques aim at interactively visualizing and rendering volumetric data in 2D displays in an intelligible manner, practically useful in everyday diagnostics (Perandini at el., 2010). On the contrary, the second approaches can produce models that are suitable for computational modelling and 3D printing.
The rendering procedure is composed of two processes, namely viewing or projection and shading (Meißner et al., 2000). The projection process determines, for each screen pixel, which objects are seen by the viewing ray starting from the pixel into the scene. Shading or illumination is the technique to enhance the appearance of a geometric object, modelling effects like shadows, light scattering and absorption.
Classification and segmentation of internal structures (Section 4) can be used to assign to each element properties such as colours, opacity and other material properties, adopted for effective rendering. Similarly, segmentation results are the starting point for surface models generation, using usually marching cube algorithm (Lorensen & Cline, 1987). The resultant surface can be used as the starting point for either generation of higher order computer-aided design (CAD) representation, such as non-uniform rational B-splines NURBS-based surfaces, or for meshing improvement using, for example, advancing front (AF), Delaunay meshing techniques (Young et al., 2008) or Poisson surface reconstruction method (Lobos & Rojas-Moraleda, 2013). Surface meshes usually require some editing to satisfy requirements of water-tightness (no holes) and smoothness. From surface polygonal meshes (Figure 4b), volumetric meshes can be derived. Unlike polygon meshes, which represent only the surface as polygons, volumetric meshes also represent the interior structure of the object and are characterised by hexahedral and tetrahedral polygons. Volumetric meshes are specific for finite element analysis (FEA) and computational fluid dynamics (CFD) studies, such as the case of cardiac computational modelling (Lopez-Perez et al., 2015).
5.1 Surface model editing and preparation for 3D printing
Topological correction, decimation, Laplacian smoothing, and local smoothing are usually needed to make 3D surface model suitable for 3D printing.
Currently, image-processing software applications are not able to generate 3D models directly applicable to 3D printing. Therefore, the post-processing of 3D surface models (i.e., correction of erroneous structures and elimination of artifacts) relies heavily on the expert clinical and anatomic knowledge. Distinguishing between abnormal but real patient structures and image artifact is often difficult and automatic approaches may fail. In efforts to overcome this limitation, a specific image-processing and 3D reconstruction workflow has been proposed by Kim et al. (2008). This approach, to be used during data processing, has the aim of
eliminating much of the subjective “expert driven” workflow in
deciphering between true anatomy and imaging artifact, ultimately resulting in the generation of more anatomically accurate digital 3D surface models, and subsequently physical models, in a shorter amount of time.
6. 3D PRINTING
In the last year, 3D printing is becoming an emerging research field in medicine in general, and in cardiovascular applications in particular (Jacobs et al., 2007; Shiraishi et al., 2010; Schmauss et al., 2014).
The 3D printing technology used in medicine is defined as either subtractive or additive depending on the printing method used. The only subtractive technique used in medical applications is milling, in which the shape of the model is milled from a block of material (either polyurethane or other foam product). The most common additive technologies used in medicine are selective laser sintering, fused deposition modelling, multijet modelling, and stereo lithography.
Selective laser sintering uses a high-power laser to fuse small particles of plastic, metal, or ceramic powders into a 3D object. The laser selectively fuses a pattern into the surface of a thermoplastic powder bed by scanning cross sections generated from the CAD 3D surface model. After a cross section is scanned and laser fused, the powder bed is lowered by one layer of thickness, a new layer of thermoplastic powder is applied on top, and the process is repeated. In fused deposition modelling, a plastic filament is forced through a heated extrusion nozzle that melts the filament, moves in both a horizontal and vertical direction as guided by the CAD software application, and deposits a layer of material that hardens immediately on extrusion. Multijet modelling essentially works like a normal ink-jet printer but in 3D space. In this process, layers of fine powder (plaster or resins) are selectively bonded by printing a water-based adhesive from the ink-jet printhead in the shape of each cross section as determined by the CAD file. Each layer quickly hardens, and the process is repeated until the model is complete. In stereo lithography, models are built through layer-by layer polymerization of a photosensitive resin. A controlled laser generates an UV beam that draws on the surface of a pool of resin stimulating the instantaneous local polymerization of the liquid resin in the outlined pattern. A movable platform lowers the newly formed layer, thereby exposing a new layer of photosensitive resin, and the process is repeated until the model is complete.
Depending on their intended application (i.e., education, catheter navigation, device sizing and testing, and so on), physical models may be printed in multiple materials (e.g., plastic, rubber polymers, etc.).
7. CASE STUDIES
In the present section, two real case studies are presented. The two patients suffer from different heart diseases: an old woman with a vascular prosthesis in the descending part of the aorta and a young man with severe pulmonary regurgitation and right ventricular dilatation. In both the case, a patient-specific modelling procedure was adopted, whose main steps are identified in Figure 1.
7.1 The implemented patient-specific modelling procedure
The multi-slice CT (MCT) data of the chest available for the two patients are processed in the open-source medical image computing software package 3D Slicer (https://www.slicer.org The first step of the followed patient-specific approach entailed a denoising process, involving a Gauss blur filter and histogram stretching procedure applied to the MCT volumetric data. While in the aorta modelling only one class was needed, in the second case study the volumetric data is segmented into three different classes: (1) chest bones, (2) pulmonary root and (3) whole heart including the ascending aorta trunk. In both the examples, the segmentation task was performed employing a semi-automatic procedure consisting in the following steps: (i) grown cut, (ii) thresholding, (ii) region growing and eroding, (iii) disconnected components removal, (iv) holes filling. Binary masks were created, one for each relevant class.
The following step consisted in the generation of the separate surface mesh models using MC and smoothing algorithms. The surface mesh models were exported and the remaining topological errors (small holes, self-intersecting triangles, small tunnels) are corrected in specialized surface modelling tool. In the presented case studies commercial software packages were employed, namely Polyworks by Innovmetric
(http://www.innovmetric.com/) and Geomagic Studio by 3D
Systems (http://www.geomagic.com/en/). Alternatively, similar results are obtainable using free, open-source tool like MeshLab (http://meshlab.sourceforge.net/) and Blender
(https://www.blender.org/). The triangular mesh models were
then optimized, in order to reduce the number of polygons, at the same time keeping the level of details and resolution of the original model. Stereolithographic (STL) models were generated and a procedure for accuracy assessment of the obtained model is devolved. Briefly, sections in the three orthogonal main plane (i.e. axial, sagittal and coronal) were extracted from the mesh models at the same position of the original MCT slices. In the obtained sections several distances were measured and compared to the same measurements taken in the corresponding original sections. With this method, the measurements taken in the three-dimensional models were found to differ by at most 5 mm from the same measurements extrapolated from the original MCT slices. A further verification was performed by re-importing the
STL mesh models in 3D slicer in order to check the overlapping with the volumetric data. The last step of the procedure required the printing of the verified STL mesh model using rapid prototyping procedure. The final products were 3D patient specific physical models used by the surgeons for surgery planning.
7.2 Aorta modelling
The 79 years old female patient suffered for sever aortic regurgitation and presented a quite severe clinical picture, including hypertension, diabetes, epilepsy, etc. She had previously undergone surgery for an aneurism involving the ascending aorta and the brachiocephalic trunk was re-implanted in the ascending aorta (Gallo et al., 2016). The surgery team decided to implant a surgical trans-catheter stent-valve
(CoreValve Evolut R29mm,
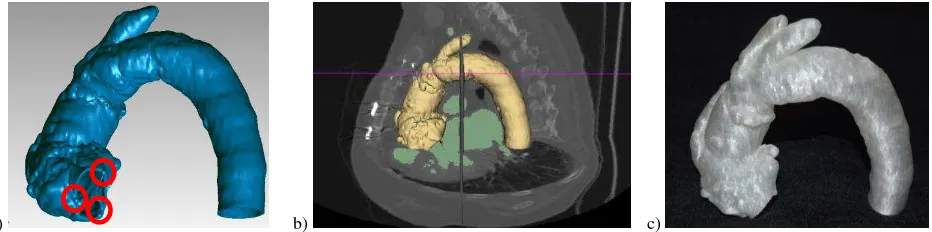
http://www.corevalve.com/us/index.htm), using the trans-femoral route. A MCT was performed to provide high-resolution images of the aorta in order to evaluate the anatomic relationship between the brachiocephalic trunk and the aortic annulus. Following the procedure described in Section 7.1, the internal wall of aorta vessel was segmented in the volumetric data and the surface mesh model generated. A constant thickness was applied outwards and three reference points are represented as 3mm diameter spheres (Figure 5a). The points materialized on the mesh model the nadir (hinge point) of each aortic cusp. Those three reference points, when virtually connected, formed the
“virtual basal ring” of aortic valve, used by the surgeon as repair
for the deployment of the trans-catheter stent-valve. The STL model was re-imported in 3D Slicer for accuracy assessment (Figure 8b) and finally printed in transparent material (polylactic acid – PLA, Figure 8c) by an Italian TalentLab (help3d.it) with a Sharebot NG printer (http://www.sharebot.it/?lang=end).
7.3 Heart, chest bones and pulmonary root
The 42 years old male patient presented a serious CHD, known as pentalogy of Fallot, involving many anatomical abnormalities of the heart. During his life, he had undergone to a number of surgeries, trying to cope with the diseases, but in the last years he had developed severe pulmonary regurgitation with right ventricular dilatation. Consequently, it was planned to replace his right ventricular outflow tract (RVOT), i.e. the extension of the ventricular cavity which connects to the pulmonary artery, with a decellularized cryopreserved homografts (DCHs). DCHs are heart valves from human donor which have been modified via tissue engineering.
As for the previous patient, a MCT was performed to provide high-resolution images of whole heart, chest bones, pulmonary root and valve with clear localization of anatomical relationships.
a) b) c)
Figure 5. Surface mesh model of the aorta with spheres representing the hinge points of aortic cusp (a). The mesh model superimposed on the MCT slices and segmentation (b). Physical replica in PLA (f).
a) b) c)
d) e) f)
Figure 6. Surface mesh model of pulmonary artery (a), chest bones and heart with aorta (b) and their physical replicas (c). Model check trough measurements taken on the original slices (d) and on corresponding sections on the mesh model (e and f).
Three separate surface mesh model were generated from the corresponding binary masks, i.e. chest bones, pulmonary root and whole heart including the ascending aorta trunk (Figure 6 a and b). The accuracy assessment was performed by comparing reference measurements taken on the original MCT slices (Figure 6 d) and on corresponding sections extracted from the mesh models (Figure 6 e and f). The models were printed in PLA using a Sharebot printer and the obtained physical replicas (Figure 6c) are used for the surgery planning.
8. CONCLUSIONS
Medical imagery is a fundamental tool in modern medicine; its quality is constantly improving and, at the same time, methods for analysis, understanding and interpretation are progressing. Moreover, 3D modelling and rapid prototyping are emerging technologies for medical diagnosis, surgical planning and intervention and training. They allow for patient-specific approaches, helping in finding the best solution also in complicate and peculiar cases.
In the present work, an overview on medical imaging techniques, along with the fundamental steps for 3D modelling and printing were presented. A patient-specific approach was developed based on open source tool for medical image computing. The procedure was applied for two patients, suffering from severe heart diseases. In both the cases, physical replicas were realized through 3D printing for surgery planning. The study shows that semi-automatic approaches for medical imaging 3D processing have reached promising results, but intervention of experts is still necessary.
ACKNOWLEDGEMENTS
Part of the presented work was financed by the IRCS
(“Implementazione della Ricerca Clinico-Sanitaria”) project co-financed by the Autonomous Province of Trento, Italy. The authors would like to acknowledge Andrea Pirazzini (help3D.it) for his technical support in providing the 3D printed model of aorta.
REFERENCES
Abadi, S., Roguin, A., Engel, A. and Lessick, J., 2010. Feasibility of automatic assessment of four-chamber cardiac function with MDCT: Initial clinical application and validation. European Journal of Radiology, 74(1), pp. 175-181.
Al-Ameen, Z., Sulong, G., Johar, M. G. M., 2013. Employing a suitable contrast enhancement technique as a pre-restoration adjustment phase for computed tomography medical images. International Journal of Bio-Science and Bio Technology, 5(1).
Dey, D., Suzuki, Y., Suzuki, S., Ohba, M., Slomka, P.J., Polk, D., Shaw, L.J. and Berman, D.S., 2008. Automated quantitation of pericardiac fat from 3noncontrast CT. Investigative radiology, 43(2), pp. 145-153.
Ecabert, O., Peters, J. and Weese, J., 2006. Modeling shape variability for full heart segmentation in cardiac computed-tomography images. In Medical Imaging (pp. 61443R-61443R). International Society for Optics and Photonics.
Funka-Lea, G., Boykov, Y., Florin, C., Jolly, M.P., Moreau-Gobard, R., Ramaraj, R. and Rinck, D., 2006. Automatic heart isolation for CT coronary visualization using graph-cuts. In Biomedical Imaging: Nano to Macro. Proc. 3rd IEEE International Symposium, pp. 614-617).
Gallo, M., D'Onofrio, A., Tarantini, G., Nocerino, E., Remondino, F. and Gerosa, G., 2016. 3D-printing model for complex aortic transcatheter valve treatment. International Journal of Cardiology, 210, p. 139.
Išgum, I., Staring, M., Rutten, A., Prokop, M., Viergever, M.A. and Van Ginneken, B., 2009. Multi-atlas-based segmentation with local decision fusion—application to cardiac and aortic segmentation in CT scans. Medical Imaging, IEEE Transactions on, 28(7), pp. 1000-1010.
Jacobs, S., Grunert, R., Mohr, F.W. and Falk, V., 2008. 3D-Imaging of cardiac structures using 3D heart models for planning in heart surgery: a preliminary study. Interactive Cardiovascular and Thoracic Surgery, 7(1), pp. 6-9.
Jolly, M.P., 2006. Automatic segmentation of the left ventricle in cardiac MR and CT images. International Journal of Computer Vision, 70(2), pp. 151-163.
Juergens, K.U., Seifarth, H., Range, F., Wienbeck, S., Wenker, M., Heindel, W. and Fischbach, R., 2008. Automated threshold-based 3D segmentation versus short-axis planimetry for assessment of global left ventricular function with dual-source MDCT. American Journal of Roentgenology, 190(2), pp. 308-314.
Kim, M.S., Hansgen, A.R., Wink, O., Quaife, R.A. and Carroll, J.D., 2008. Rapid prototyping a new tool in understanding and treating structural heart disease. Circulation, 117(18), pp.2388-2394.
Kirişli, H.A., Gupta, V., Kirschbaum, S.W., Rossi, A., Metz,
C.T., Schaap, M., van Geuns, R.J., Mollet, N., Lelieveldt, B.P., Reiber, J.H. and van Walsum, T., 2012. Comprehensive visualization of multimodal cardiac imaging data for assessment of coronary artery disease: first clinical results of the SMARTVis tool. International journal of computer assisted radiology and surgery, 7(4), pp. 557-571.
Kristensen, T.S., Kofoed, K.F., Møller, D.V., Ersbøll, M., Kühl, T., von der Recke, P., Køber, L., Nielsen, M.B. and Kelbæk, H., 2009. Quantitative assessment of left ventricular systolic wall thickening using multidetector computed tomography. European journal of radiology, 72(1), pp. 92-97.
Lobos, C., Rojas-Moraleda, R., 2013. From segmented medical images to surface and volume meshes, using existing tools and algorithms. In International Conference on Adaptive Modeling and Simulation.
Lopez-Perez, A., Sebastian, R. and Ferrero, J.M., 2015. Three-dimensional cardiac computational modelling: methods, features and applications. Biomedical Engineering online, 14(1), p.35.
Lorensen, W.E., Cline, H.E., 1987, August. Marching cubes: A high resolution 3D surface construction algorithm. In ACM Siggraph Computer Graphics, Vol. 21, No. 4, pp. 163-169.
Lorenz, C., von Berg, J., 2006. A comprehensive shape model of the heart. Medical Image Analysis, 10(4), pp. 657-670.
Maini, R. and Aggarwal, H., 2010. A comprehensive review of image enhancement techniques. arXiv preprint arXiv:1003.4053.
Meißner, M., Pfister, H., Westermann, R. and Wittenbrink, C.M., 2000. Volume visualization and volume rendering techniques. Eurographics tutorial.
Mühlenbruch, G., Das, M., Hohl, C., Wildberger, J.E., Rinck, D., Flohr, T.G., Koos, R., Knackstedt, C., Günther, R.W. and Mahnken, A.H., 2006. Global left ventricular function in cardiac CT. Evaluation of an automated 3D region-growing segmentation algorithm. European Radiology, 16(5), pp. 1117-1123.
Olabarriaga, S.D., Smeulders, A.W., 2001. Interaction in the segmentation of medical images: A survey. Medical Image Analysis, 5(2), pp. 127-142.
Pace, D.F., Dalca, A.V., Geva, T., Powell, A.J., Moghari, M.H. and Golland, P., 2015. Interactive Whole-Heart Segmentation in Congenital Heart Disease. In Medical Image Computing and Computer-Assisted Intervention–MICCAI 2015, pp. 80-88, Springer International Publishing.
Perandini, S., Faccioli, N., Zaccarella, A., Re, T.J. and Mucelli, R.P., 2010. The diagnostic contribution of CT volumetric rendering techniques in routine practice. Indian Journal of Radiology and Imaging, 20(2), p. 92.
Pham, D.L., Xu, C. and Prince, J.L., 2000. Current methods in medical image segmentation 1. Annual review of biomedical engineering, 2(1), pp. 315-337.
Preethi, S.J. and Rajeswari, K., 2010. Image enhancement techniques for improving the quality of colour and gray scale medical images. International Journal on Computer Science and Engineering, 1, pp. 18-23.
Robb, R.A., 2000. 3-Dimensional Visualization in Medicine and Biology. Handbook of Medical Imaging: Processing and Analysis, pp. 685-712.
Schmauss, D., Haeberle, S., Hagl, C. and Sodian, R., 2015. Three-dimensional printing in cardiac surgery and interventional cardiology: a single-centre experience. European Journal of Cardio-Thoracic Surgery, 47(6), pp. 1044-1052.
Schoepf, U.J. ed., 2007. CT of the Heart: Principles and Applications. Springer Science & Business Media.
Sharma, N., Aggarwal, L.M., 2010. Automated medical image segmentation techniques. Journal of Medical Physics, 35(1), p. 3.
Shiraishi, I., Yamagishi, M., Hamaoka, K., Fukuzawa, M. and Yagihara, T., 2010. Simulative operation on congenital heart disease using rubber-like urethane stereolithographic biomodels based on 3D datasets of multislice computed tomography. European Journal of Cardio-Thoracic Surgery, 37(2), pp. 302-306.
WHO, World Health Organization, 2015. Cardiovascular
diseases (CVDs). Fact sheet N°317,
http://www.who.int/mediacentre/factsheets/fs317/en/.
Withey, D.J., Koles, Z.J., 2008. A review of medical image segmentation: methods and available software. International Journal of Bioelectromagnetism, 10(3), pp. 125-148.
Yalamanchili, R., Dey, D., Kukure, U., Nakazato, R., Berman, D.S. and Kakadiaris, I.A., 2010. Knowledge-based quantification of pericardial fat in non-contrast CT data. In SPIE Medical Imaging (pp. 76231X-76231X). International Society for Optics and Photonics.
Young, P.G., Beresford-West, T.B.H., Coward, S.R.L., Notarberardino, B., Walker, B. and Abdul-Aziz, A., 2008. An efficient approach to converting three-dimensional image data into highly accurate computational models. Philosophical Transactions of the Royal Society of London A: Mathematical, Physical and Engineering Sciences, 366(1878), pp. 3155-3173.
Zheng, Y., Barbu, A., Georgescu, B., Scheuering, M. and Comaniciu, D., 2008. Four-chamber heart modeling and automatic segmentation for 3-D cardiac CT volumes using marginal space learning and steerable features. Medical Imaging, IEEE Transactions on, 27(11), pp. 1668-1681.