GEOFENCING-BASED LOCALIZATION FOR 3D DATA ACQUISITION NAVIGATION
M. Nakagawa* , T. Kamio, H. Yasojima, T. Kobayashi
Dept. of Civil Engineering, Shibaura Institute of Technology, Tokyo, Japan - [email protected]
Commission IV / WG 7
KEY WORDS: Indoor mobile mapping, Indoor positioning Geofencing, iBeacon, Time-of-flight camera
ABSTRACT:
Users require navigation for many location-based applications using moving sensors, such as autonomous robot control, mapping route navigation and mobile infrastructure inspection. In indoor environments, indoor positioning systems using GNSSs can provide seamless indoor-outdoor positioning and navigation services. However, instabilities in sensor position data acquisition remain, because the indoor environment is more complex than the outdoor environment. On the other hand, simultaneous localization and mapping processing is better than indoor positioning for measurement accuracy and sensor cost. However, it is not easy to estimate position data from a single viewpoint directly. Based on these technical issues, we focus on geofencing techniques to improve position data acquisition. In this research, we propose a methodology to estimate more stable position or location data using unstable position data based on geofencing in indoor environments. We verify our methodology through experiments in indoor environments.
1. INTRODUCTION
Various location-based data acquisition systems have been proposed for indoor-outdoor applications, such as mobile services, traffic analyses, evacuation planning, autonomous robots, mapping, and infrastructure asset management. In many applications using moving sensors, such as autonomous robot control, mapping route navigation, and mobile infrastructure inspection, users require 2D or 3D navigation with location-based data acquisition. In an outdoor environment, global navigation satellite system (GNSS) receivers, mounted on smartphones and tablet PCs, are generally used to estimate a sensor’s position. In particular, precise position data can be acquired using real-time kinematic GNSS. Acceleration and magnetic direction sensors are mounted in recent smartphones and tablet PCs (Hwang et al. 2012). Therefore, navigation for location-based data acquisition can be conducted easily. On the other hand, in indoor environments, WiFi (Liu et al. 2012), radio-frequency identification (RFID) (Athalye et al. 2015), Bluetooth (Ahmed et al. 2014), and indoor messaging systems (IMESs) (Manandhar et al. 2008) have also been developed for use as indoor positioning and navigation services. These indoor positioning systems when combined with GNSSs can provide seamless indoor-outdoor positioning and navigation services. Mobile hardware development has improved the availability of positioning services, which requires quality improvement of the positioning services themselves. However, the instability in sensor position data acquisition remains, because the indoor environment is more complex than the outdoor environment. In addition, although positioning accuracy is an important issue in location-based services, many other significant issues, such as availability, integrity, and reliability must be considered in the quality improvement of positioning services.
When precise sensor position data are acquired in indoor environments, simultaneous localization and mapping (SLAM) (Durrant-Whyte et al. 2006, Bailey et al. 2006) processing is better than simple indoor positioning in terms of measurement accuracy and sensor cost. SLAM is a methodology to estimate
relative position data from the continuous acquisition of images and point cloud data from multiple viewpoints. Therefore, it is not easy to estimate position data from a single viewpoint directly. In particular, because the indoor environment consists of repetitive features, it is not easy to find corresponding features among images and point clouds. Therefore, indoor positioning is an essential technique for acquiring sensor position data.
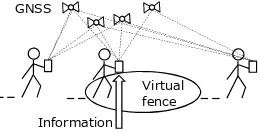
Based on these technical issues, we focus on geofencing techniques (Nakamura et al. 2015) (see Figure 1) to improve of position data acquisition. Geofencing techniques use positioning data and a preset polygon on a map, called a virtual fence or geofence. In this research, we propose a methodology to estimate more stable position or location data using unstable position data based on geofencing in the indoor environment. We verify our methodology through some experiments in the indoor environment.
Figure 1. Geofencing using GNSS
2. METHODOLOGY
A general geofencing technique combines GNSS positioning with a virtual fence or geofence, as shown in Figure 1. The geofencing technique provides active and push-based controls in location-based service for a mobile device with detection when entering the entrance to the virtual fence or exiting from the virtual fence.
Geofencing can be applied to indoor positioning. When discrete beacon-based positioning is applied, a polygon preset can be omitted, as shown in Figure 2. Moreover, it is possible to
Information
Virtual fence GNSS
improve resolution of geofences with fingerprint-based positioning, as shown in Figure 2.
Figure 2. Geofencing using beacons (left image: geofencing using the strongest signal from beacons, right image: fingerprint-based geofencing using beacons)
Our geofencing-based positioning methodology is based on indoor positioning techniques. There are popular indoor positioning algorithms, such as time of arrival (ToA), time difference of arrival (TDoA), angle of arrival (AoA), and received signal-strength indication (RSSI) positioning (Golden et al. 2007). In an actual indoor environment, ToA, TDoA and AoA positioning are deeply affected by multipath transmission. On the other hand, RSSI positioning (Vaidya et al. 2014) is more robust than the other methods. Moreover, RSSI can provide position data without precise synchronization among transmitters. In particular, cheap transmitters, such as iBeacon, have recently been used for RSSI positioning. Therefore, we apply RSSI positioning using the iBeacon to estimate sensor position data in this research. We test two types of geofencing positioning approaches, nearest neighbor-based positioning and fingerprint-based positioning.
2.1 Nearest neighbor-based positioning
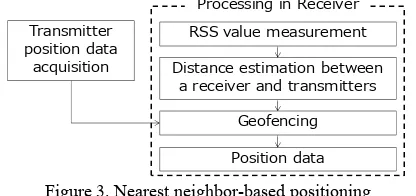
Our first positioning approach is nearest neighbor-based positioning, as shown in Figure 3.
Figure 3. Nearest neighbor-based positioning
First, position data are determined for each transmitter by surveying using a total station or 3D mapping using a 3D scanner. Second, signals from transmitters are received at a point. Received signal-strength (RSS) values from the transmitters are measured. Each signal from an iBeacon transmitter has a unique identifier. Thus, the strongest signal can be distinguished from the other signals. Therefore, we can identify the transmitter nearest to the receiver point. Third, the distance from the nearest beacon transmitter to the receiver is estimated from the measured RSS values. A virtual fence or geofence is assumed as a circle or ball with the transmitter as the center and the distance as the radius of the circle or ball. The distance can be calculated using the following equation based on the Friis transmission formula:
Distance = 10 ((TxPower – RSSI) / 20) ,
where, the TxPower is the RSS value at 1 m point from an iBeacon transmitter.
Finally, geofencing is applied to estimate the receiver point. When the virtual fence or geofence includes the receiver point, the nearest transmitter point data are assigned to the receiver.
2.2 Fingerprint-based positioning
The second positioning approach is fingerprint-based positioning (Jiang et al. 2015). In a general fingerprint localization methodology, the access point with the highest RSS value is denoted as the important access point (IAP). At the localization stage, the fingerprints with the same IAP as the estimated fingerprint are chosen from the database to estimate the location.
In our research, fingerprint-based positioning consists of fingerprint map generation and position data estimation with geofencing, as shown in Figure 4. First, a fingerprint map is generated. Generally, RSS values are measured at 1 m or 2 m pitch in a space to generate the fingerprint map. However, these RSS measurements often require a huge amount of work. Thus, in this research, interpolation using measured values at discrete measurement points is applied to reduce the RSS value measurement work. RSS values from all transmitters are measured, with transmitter positioned at approximately 10 m pitch. Then, RSS values are interpolated into the space with 1 m pitch. In this research, the spline interpolation is applied to estimate the fingerprint map. Second, an adequate position value is estimated by finding a minimum of subtracted values between RSS values from the fingerprint map and RSS values of all signals at the receiver position.
Figure 4. Fingerprint-based positioning
3. EXPERIMENT
We conducted experiments in an indoor space. We selected corridors in our campus, including one 97.2 m long (2.0 m width and 2.8 m height), as shown in Figure 5.
Figure 5. Study area
First, we prepared our 3D data acquisition system, as shown in Figure 6. This system consisted of a time-of-flight (TOF) camera (SR4000, mesa) (May et al. 2009), a front camera (QBiC MS-1, ELMO), a horizontal panorama camera (PIXPRO SP360, Kodak), an attitude and heading reference system (MTi-G, XSENS), and a laptop PC (MacBook Air, Apple) with the
bleacon Node.js library as an iBeacon receiver. These sensors were synchronized within 1 sec with the PC clock. This system mainly measured point cloud data with the SLAM using the TOF camera. This system can receive signals from all iBeacon transmitters within approximately 1 Hz. Figure 7 shows the generated 3D map with our 3D measurement system.
Figure 6. Indoor 3D data acquisition system
Figure 7. Generated 3D map
Second, we prepared six iBeacon transmitters (MyBeacon MB004 Ac, Aplix), as shown in Figure 8.
Figure 8. iBeacon transmitter
All transmitters were set 1.0 m from the floor and every 10.0 m along a wall from points b1 to b6 with the same major id numbers and unique minor numbers, as shown in Figure 9 and Table 1.
Figure 9. Positions of iBeacon transmitters
Table 1. Arrangement of iBeacon transmitters Location Position
[m] Minor ID Measured power [dBm]
b1 0 1 -63
b2 10 2 -63
b3 20 3 -63
b4 30 4 -63
b5 40 5 -63
b6 50 6 -63
After generating the 3D map and positioning the transmitters, we conducted two types of experiments involving pedestrian monitoring, and RSS mapping with a 3D map update in the indoor environment. In the first experiment, we acquired pedestrian data, first at point b5, and then at b4. Pedestrian data were extracted from TOF images based on a background subtraction using intensity values.
In the second experiment, we shuttled once between points b1 and b7 with RSS data acquisition. We acquired RSS values for 60 sec at every transmitter point to generate fingerprints.
4. RESULTS
4.1 Pedestrian extraction
In our experiment, 830 images (over approximately 160 sec) were acquired with the TOF camera. Figure 10 shows a pedestrian extraction result estimated from a TOF camera image.
Figure 10. Pedestrian extraction result (left top: intensity image, right top: depth image, left bottom: segment image, right bottom: point cloud)
4.2 Receiver location data estimation
Figure 11 shows RSS values from the iBeacon transmitters. The vertical axis indicates RSS values and the horizontal axis indicates the minor identifiers of the iBeacon transmitters. Figure 12 shows estimated distances from the iBeacon transmitters to the receiver. The vertical axis indicates estimated distance values, and the horizontal axis indicates the minor identifiers of iBeacon transmitters.
1m
Horizontal panorama camera
Front camera
AHRS
TOF camera
Kodak PIXPRO SP360
ELMO QBiC MS-1
XSENS MTi-G
MESA SR-4000
iBeacon receiver
Apple Macbook
b1 b2 b3 b4 b5 b6
10m 10m 10m 10m 10m
Corridor b7 97.2m
X[m]
Y[m] Z[m]
Figure 11. RSS values
Figure 12. Estimated distances
In Figure 11, minor ID 5 (the 40 m point) produced the highest RSS value. Moreover, in Figure 12, minor ID 5 also indicated the shortest distance from the transmitter to the receiver. Thus, the position of the 3D measurement system was estimated as the 40 m point in this case. After the position estimation, the extracted pedestrian data were overlaid on the 3D map, as shown in Figure 13.
Figure 13. Extracted pedestrian data overlaid with 3D map
5. DISCUSSION
5.1 Sensor location data estimation in the pedestrian extraction experiment
Figure 14 shows measured RSS values from all transmitters in the pedestrian extraction experiment. The vertical axis in each graph indicates RSS values and the horizontal axis in each graph indicates signal-receiving time. Bold points indicate RSS values of more than -63 dBm (TxPower). Figure 14 shows that RSS values were acquired stably at measurement points b5 and b4. Thus, these results show that our geofencing-based positioning can achieve a stable and reliable positioning in indoor environments.
Figure 14. Measured RSS values
Figure 15 shows estimated distances from all transmitters to the receiver in the pedestrian extraction experiment. The vertical axis in each graph indicates distance values and the horizontal axis in each graph indicates the signal-receiving time. Moreover, bold points indicate RSS values more than the TxPower. Although the minor ID 5 at point b5 and the minor ID 4 at point b4 show values less than 1 m stably, actual distances of other data were unstable. Here, there are categories of distance from a transmitter to a receiver, such as “near (less than 1 m),”“far (more than 1 m),” and “unknown” in the specification of iBeacon. In other words, distance values less than 1 m are reliable. Therefore, our geofencing approach can detect the appropriate position.
Figure 15. Estimated distances from iBeacon transmitters to the iBeacon receiver
X[m] Y[m]
Z[m]
Pedestrian
Minor
ID: 1 Minor ID: 2 Minor ID: 3 Minor ID: 4 Minor ID: 5 Minor ID: 6 RSS value [dBm]
-30 -40 -50 -60 -70 -80 -90 -100
Minor ID: 1
Minor ID: 2
Minor ID: 3
Minor ID: 4
Minor ID: 5
Minor ID: 6 Location
-63dBm -63dBm -63dBm -63dBm -63dBm -63dBm
b5 b4
Time [sec] Distance [m]
20 18 16 14 12 10 8 6 4 2 0
Minor
ID: 1 Minor ID: 2 Minor ID: 3 Minor ID: 4 Minor ID: 5 Minor ID: 6
b5 b4
Location
1m 1m 1m 1m 1m 1m Minor
ID: 1
Minor ID: 2
Minor ID: 3
Minor ID: 4
Minor ID: 5
Minor ID: 6
Time [sec]
5.2 Receiver location data estimation
Figure 16 shows measured RSS values from all transmitters in the second experiment. The vertical axis in each graph indicates RSS values, and the horizontal axis in each graph indicates signal-receiving time. Moreover, bold points indicate RSS values of more than -63 dBm (TxPower).
Figure 16. Measured RSS values in the second experiment
Figure 17 shows estimated distances from all transmitters to the receiver in the second experiment. The vertical axis in each graph indicates distance values, and the horizontal axis in each graph indicates signal receiving time. Bold points indicate RSS values more than the TxPower.
Figure 17. Estimated distances from iBeacon transmitters to the iBeacon receiver in the second experiment
Figure 18. Estimated position using iBeacons
Figures 16 and 17 show that the transitions of RSS values were stable and smooth through the RSS mapping, Figure 18 shows a comparison of estimated position data with approximate actual sensor position data. These results show that our geofencing-based positioning can be applied to approximate sensor location data acquisition in 3D mapping in the indoor environment.
5.3 Fingerprint-based sensor location data estimation
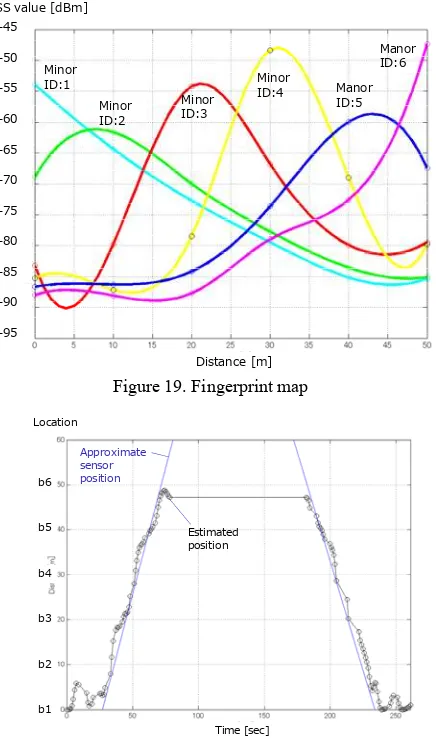
A fingerprint map was generated using RSS values measured at six transmitter points. However, the measured RSS data consisted of discrete points. Therefore, we tried to generate a continuous fingerprint map for geofencing-based positioning, as shown in Figure 19. The vertical axis indicates RSS values and the horizontal axis indicates the sensor position to be estimated. We applied this fingerprint map to our geofencing-based positioning, as shown in Figure 20. The vertical axis indicates the estimated position and the horizontal axis indicates the signal-receiving time. Although estimated results were smooth, the results were unstable at some points.
Figure 19. Fingerprint map
Figure 20. Estimated position based on fingerprinting with the spline function
We expect to improve the positioning accuracy with an approach based on fingerprint positioning in our future works. Height and rotation data, such as roll, pitch, and yaw, have not been estimated using beacons in this experiment. We expect to estimate these parameters in our future work.
b1 b2 b3 b4 b5 b6
6. SUMMARY
We focused on geofencing techniques to improve indoor position data acquisition in for improved integrity and reliability. We proposed a methodology to estimate more stable position or location data using unstable position data based on geofencing in indoor environments. We verified our methodology through some experiments, such as 3D map generation, RSS value mapping, sensor location data estimation in the pedestrian extraction experiment, and fingerprint-based sensor location data estimation in indoor environments.
ACKNOWLEDGEMENT
This work was supported by JSPS KAKENHI Grant Number 26870580.
REFERENCES
Hwang, S., Yu, D., 2012. GPS Localization improvement of smartphones using built-in sensors, International journal of smart home; Jul 2012, Vol. 6 Issue 3, 8 pages.
Liu, H., Gan, Y., Yang, J., Sidhom, S., Wang, Y., Chen, Y., Ye, F., 2012, Push the limit of WiFi based localization for smartphones, Mobicom '12 Proceedings of the 18th annual international conference on Mobile computing and networking, pp. 305-316.
Athalye, A., Savic, V., Bolic, M., Djuric, P. M., 2015. Novel Semi-Passive RFID System for Indoor Localization, IEEE Transactions on Instrumentation and Measurement 11/2015; 64(11):2889-2899.
Ahmed, N., Subhan, F, Haider, S., Ahmed Khan, N., Ahmed, S., Saleem Alimgeer, K., 2014. Positioning in Bluetooth networks using lateration approach – a comparative study, Science International; 2014, Vol. 26 Issue 5, p.2077-2081.
Manandhar, D., Okano, K., Ishii, M., Asako, M., Torimoto, H., 2008, Development of ultimate seamless positioning system for global cellular phone platform based on QZSS IMES, Proceedings of ION GNSS 2008, 5 pages.
Durrant-Whyte, H., Bailey, T., 2006. Simultaneous localization and mapping (SLAM): part I, Robotics & Automation Magazine, IEEE, Vol. 13, Issue: 2, pp. 99-110.
Bailey, T., Durrant-Whyte, H., 2006. Simultaneous localization and mapping (SLAM): part II, Robotics & Automation Magazine, IEEE, Vol. 13, Issue: 3, pp. 108-117.
Nakamura, Y., Ono, M., Sekiya, M., Honda, K., Takahashi, O., 2015. Indoor/outdoor determination method using various sensors for the power saving of terminals in Geo-fencing, Proceedings of the International Workshop on Informatics (IWIN2015), pp.23-29.
Golden, S. A., Bateman, S. S., 2007. Sensor Measurements for Wi-Fi Location with Emphasis on Time-of-Arrival Ranging, IEEE Transactions on Mobile Computing archive, Volume 6 Issue 10, pp.1185-1198.
Vaidya, A., Meshram, A., Sakhare, A., 2014. Position location methodology based on RSSI using RFID, International Journal of Application or Innovation in Engineering & Management (IJAIEM), Volume 3, Issue 1, pp.370-375.
Jiang, P., Zhang, Y., Fu, W., Liu, H., Su, X., 2015. Indoor Mobile Localization Based on Wi-Fi Fingerprint’s Important Access Point, International Journal of Distributed Sensor Networks, Volume 2015, 8 pages.
May, S., Droeschel, D., Fuchs, S., Holz, D., Nuchter, A., 2009, Robust 3D-Mapping with Time-of-Flight Cameras, Intelligent Robots and Systems (IROS) 2009, IEEE/RSJ International Conference on, pp. 1673-1678.