IMPROVED LARGE-SCALE SLOPE ANALYSIS ON MARS BASED ON CORRELATION
OF SLOPES DERIVED WITH DIFFERENT BASELINES
Yiran Wang, Bo Wu *
Dept. of Land Surveying and Geo-Informatics, Hong Kong Polytechnic University, Kowloon, Hong Kong – ([email protected], [email protected])
Commission III, ICWG III/II
KEY WORDS: Mars, MOLA, HiRISE, Slop, DEM, Correlation
ABSTRACT:
The surface slopes of planetary bodies are important factors for exploration missions, such as landing site selection and rover manoeuvre. Generally, high-resolution digital elevation models (DEMs) such as those generated from the HiRISE images on Mars are preferred to generate detailed slopes with a better fidelity of terrain features. Unfortunately, high-resolution datasets normally only cover small area and are not always available. While lower resolution datasets, such as MOLA, provide global coverage of the Martian surface. Slopes generated from the low-resolution DEM will be based on a large baseline and be smoothed from the real situation. In order to carry out slope analysis at large scale on Martian surface based low-resolution data such as MOLA data, while alleviating the smoothness problem of slopes due to its low resolution, this paper presents an amplifying function of slopes derived from low-resolution DEMs based on the relationships between DEM low-resolutions and slopes. First, slope maps are derived from the HiRISE DEM (meter-level resolution DEM generated from HiRISE images) and a series of down-sampled HiRISE DEMs. The latter are used to simulate low-resolution DEMs. Then the high-resolution slope map is down- sampled to the same resolution with the slope map from the resolution DEMs. Thus, a comparison can be conducted pixel-wise. For each pixel on the slope map derived from the lower-resolution DEM, it can reach the same value with the down-sampled HiRISE slope by multiplying an amplifying factor. Seven sets of HiRISE images with representative terrain types are used for correlation analysis. It shows that the relationship between the amplifying factors and the original MOLA slopes can be described by the exponential function. Verifications using other datasets show that after applying the proposed amplifying function, the updated slope maps give better representations of slopes on Martian surface compared with the original slopes.
1. INTRODUCTION
The surface slopes of planetary bodies are important factors for exploration missions. Slope maps have been widely used for scientific research such as landing site selection (Braun and Manning, 2007; Golombek et al., 1997; Golombek et al., 2012) and rover manoeuvre (Lindemann and Voorhees, 2005; Maimone et al., 2007). Thus, the acquisition of an accurate slope map is of great significance. Generally, slope analysis for landing site selection, needs to be done globally or in a large area. However, DEMs globally available normally are those with low-resolutions (e.g., hundred meters). In slope determination, the minimum baseline is twice of the DEM resolution. Therefore, slopes generated from the low-resolution DEM will be based on a large baseline and will be smoothed from the real situation. That is to say, the slopes calculated from low-resolution DEM will be less than their real values. To alleviate the smoothness problem of slopes due to its large baseline, this research attempts to compensate the slope values through slope correlation analysis, by using the Mars datasets as an example.
For Martian surface, there are topographic datasets with different resolutions collected from the past missions. The High-Resolution Imaging Science Experiment (HiRISE) (McEwen et al., 2007) and Context Camera (CTX) (Malin et al., 2007) are two imaging systems on-board the NASA's Mars Reconnaissance
* Corresponding author
Orbiter. The Mars Orbiter Laser Altimeter (MOLA) (Smith et al., 2001) is an instrument on-board the Mars Global Surveyor spacecraft (Albee et al., 2001). The High Resolution Stereo Camera (HRSC) (Neukum and Jaumann, 2004) is the first photogrammetric stereo sensor system on-board the Mars Express mission. In this research, we analyse the data acquired by HiRISE, CTX, HRSC and MOLA jointly. The processing of the HiRISE and CTX images, including calibration and add-on components, were implemented using ISIS version 3 provided by the United States Geological Survey. The EO parameters of the HiRISE and CTX images were retrieved from the SPICE kernels by interpolating the spacecraft's trajectory and pointing vectors based on the observation time. A self-adaptive triangulation-constrained image matching (SATM) method (Wu et al., 2011, 2012; Zhu et al., 2007; Zhu et al., 2010) was used for automatic matching of the stereo images to obtain dense corresponding points in the overlapping region of the stereo images. The 3D coordinates of the matched points were then obtained by photogrammetric intersection based on the image orientation parameters, from which the DEMs were interpolated. The HiRISE images are usually 0.25 - 0.5 m/pixel, therefore the corresponding HiRISE DEM spacing is 1-2 m. The resolution of CTX images is 6 m/pixel and resolutions of the obtained CTX DEMs for the datasets used in this research are 20 m/pixel. The HRSC DEMs were downloaded from the PDS archive
geosciences.wustl.edu/missions/mars_express/hrsc.htm), with a resolution of 50 m. For the MOLA data, the Mars MGS MOLA Elevation Model (MEGDR) is used in this research. The resolution of the MOLA DEM is 463m/pixel.
This paper presents a systematic study of slope analysis on Mars based various resolution DEMs. An amplification function is proposed to calibrate the slopes derived from low-resolution DEMs. The results are verified by multiple-source datasets including the HiRISE, CTX, HRSC and MOLA data. Following the introduction, Section 2 presents the details of slope correlation analysis and an amplifying function has been derived. In Section 3, the verifications of the effectiveness of correlation function are presented. Finally, the summary and conclusions are presented in the last section.
2. SLOPE CORRELATION ANALYSIS
2.1 Dataset Description
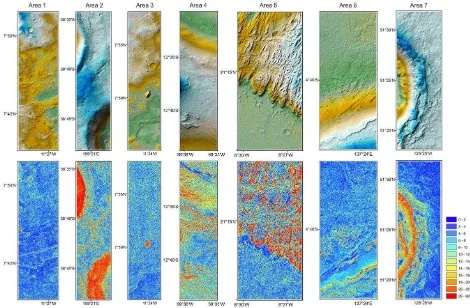
Seven sets of HiRISE DEMs are used for the correlation analysis. They are collected from different regions on Mars and contains different terrain features. As Figure 1 shows, all of the HiRISE DEMs are visualized in the first row and their corresponding slope maps in the second row. It can be seen that the Area 1, Area 3 and Area 6 are relatively flat area; Area 2 and Area 7 are presentative crater area; Area 5 is a dune area affected by some nature interactions; Area 4 is a valley floor. The slopes are calculated as follows: For each cell in the map, the maximum rate of change in value from that cell to its neighbours was calculated. The slope map presents the topographic changes in the form slopes and in units of degrees. In the slope maps, blue presents a relatively flat area and red indicates large slope areas.
Figure 1. DEMs and slope maps of the seven HiRISE datasets used in the analysis.
2.2 Relationship between Average Slope and Baseline
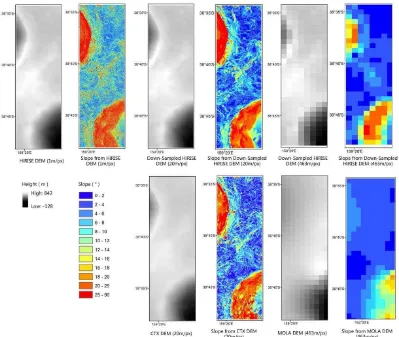
Low-resolution DEMs mean large baselines when calculating the slopes, which usually causes smoothness and they are deviated to present the details of the real terrain. For the same area, as the resolution of DEMs decreases, the average slope will decrease generally. Figure 2 shows an example of the Area 2 mentioned above. In the first row in Figure 2, the 1m/pixel HiRISE DEM is
down-sampled to 20m/pixel and 463m/pixel DEMs (in grey scale), which is the same resolution of CTX DEM and MOLA DEM. In the second row, the real CTX DEM and MOAL DEM of the same place are displayed. The slope maps (in color) derived from these DEMs are also included in Figure 2. It can be seen that the HiRISE simulation is close to real data in terms of slope map. Obvious decrease trend of slope can be seen in both simulated data and real data.
Figure 2. Example of slope smoothness when the resolution of DEM decreases.
The seven sets of data described in section 2.1 are used to investigate the slope correlations. The 1m/pixel HiRISE DEMs are gradually reduced to 2 m/pixel, 4 m/pixel… and 256m/pixel to simulate the DEMs with different resolutions. Then the slope analysis is conducted based on DEMs with different resolutions. The average slope for each dataset is illustrated by Figure 3. It shows a consistent downward trend as the resolutions of DEMs decrease. Kirk et al. (2008; 2003) have also described the similar work on different sources of DEMs on Mars and the results show similar trends.
Figure 3. Relationships between average slopes and DEM resolutions for the seven HiRISE datasets.
2.3 The Slope Amplification Function
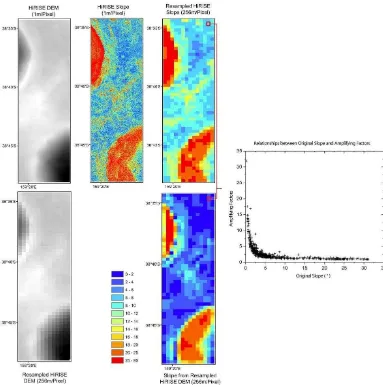
As the slope decreases due to the decrease of the DEM resolutions, it is necessary to find ways to compensate the slopes so that they can better represent the real situation. The main challenge is to find the relationship between the slopes calculated from high-resolution DEMs and that from low-resolution DEMs. Figure 4 shows an example to illustrate the process of slope comparison between the HiRISE DEMs with resolutions of 1 m/pixel and 256 m/pixel.
First, the HiRISE DEM is down-sampled to the resolution of 256 m/pixel. Then the corresponding slope maps are calculated from the DEMs before and after down-sampling. After that, the slope map from 1m/pixel HiRISE DEM is down-sampled to 256 m/pixel. The way of down-sampling the slope map is as follows: we first define a 256 m*256 m local window and moving it with an interval of 256 m; then the average value was used as the slope of current window. This is the way that we try to use a lower-resolution slope map to well present the original one. Now we have the two types of slope map in the same resolution, the comparison can be conducted pixel-wise. By comparing the slope values pixel by pixel, it can be found that the relationship between these two slope maps in each pixel can be modelled by an amplifying function. And the specific amplifying factor of each pixel is related to the original slope value and the ratio of DEM resolution. As Figure 4 (right) shows, the relationship of the amplifying factor and slope value can be described by an exponential function at a certain ratio of DEM resolution.
= − + (1)
Figure 4. Example to illustrate the process of slope comprision
where is the original slope from the low-resolution DEM. is the amplifying factor for the slope. and are the parameters of the exponent function. To extend the amplifying function model to adapt for DEMs with different resolutions, the ratio of the DEM resolutions is taken into consideration. The model can be represented as Equation (2).
= ��� � + − + (2) where � is the ratio of the DEM resolutions (low resolution with respect to high resolution). , , and are the parameters of the function.
The seven sets of HiRISE data described in Section 2.1 are processed. Similar slope comparisons as described in Figure 4 are conducted between different resolution gaps. As Figure 5 shows, there are in total 83474 sets of slope pairs obtained. The slope pairs are used for parameters calculation. The outliers are filtered out using the Bisquare method. This method minimizes a weighted sum of squares, where the weight given to each data point depends on how far the point is from the fitted line. Points near the line obtain higher weights. Points farther from the line obtain reduced weights. The adjustment process is based on the least-squares principle. The parameters a, b and c are iteratively
adjusted and the slope amplifying function related to DEM resolutions can be represented as follows.
Figure 5. Relationship analysis among amplifying factor, resolution gap and slope.
= 0. × ��� � + 0. − + 0.9 (3)
For all the slope pairs form the seven datasets, the slopes from lower resolution DEMs are amplified by the proposed amplifying function and the results are compared with its slope pairs. The Root-Mean-Square Deviation (RMSE) is 2.8º, which shows that the data can be fitted well with the proposed model.
3. EXPERIMENTAL VERIFICATION
HiRISE, CTX, HRSC and MOLA datasets collected in other areas on Mars are used to verify the effectiveness of the derived slope amplifying function. The comparisons have been conducted between HiRISE and CTX, HiRISE and MOLA, HiRISE and HRSC, and HRSC and MOLA, as illustrated in Figure 6, Figure 7, Figure 8 and Figure 9 respectively.
In the verification process, each set of data contains a higher resolution DEM and a lower resolution DEM. The first step is to acquire slope maps from both higher and lower resolution DEMs. Next, slopes from lower resolution DEMs are amplified by the proposed amplifying function. After that, slope maps from higher-resolution DEMs will be down-sampled to be the same resolution with lower-resolution slope map for comparison purpose. Finally, slope differences are calculated before and after amplification for comparison analysis.
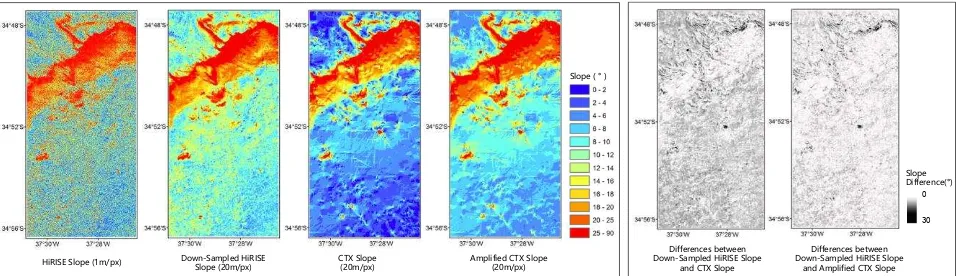
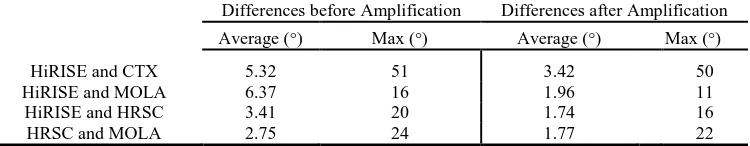
As Figure 6 shows, the first map is the slope maps derived from HiRISE DEM. The resolution of the slope map is same with that of the DEM, which is 1m/pixel. The second map is the down-sampled slope map from HiRISE slope. It has the same resolution with CTX slope map (20m/pixel) and is regarded as a reference in the comparison. The third map shows the slope map directly from the CTX DEM and the fourth map is the amplified CTX slope map after applying the amplifying function as described in the previous section. The last two maps are the difference slop maps between the HiRISE slope map and CTX slope map before and after amplification. The dark colour indicates large slope differences while the lighter colour means a smaller difference. Similarly, Figure 7 shows the verification between the HiRISE data (1 m/pixel) and MOLA data (463 m/pixel); Figure 8 shows the verification between the HiRISE data (1 m/pixel) and HRSC data (50 m/pixel); Figure 9 shows the verification between the HRSC data (50 m/pixel) and MOLA data (463 m/pixel). The difference maps show that the slope differences decreased after amplifying. The absolute average and maximum value of the slope differences are listed in Table 1. It can be seen that the average of the differences has been reduced by a half in most cases. This indicates that the proposed amplifying function works well in different cases.
Figure 6. Verifications between HiRISE data and CTX data
Figure 7. Verifications between HiRISE data and MOLA data.
HiRISE Slope (1m/px) CTX Slope
Figure 8. Verifications between HiRISE data and HRSC data.
Figure 9. Verifications between HRSC data and MOLA data
Differences before Amplification Differences after Amplification
Average (°) Max (°) Average (°) Max (°)
HiRISE and CTX 5.32 51 3.42 50
HiRISE and MOLA 6.37 16 1.96 11
HiRISE and HRSC 3.41 20 1.74 16
HRSC and MOLA 2.75 24 1.77 22
Table 1. Comparison analysis of slope maps before and after amplification.
4. CONCLUSIONS AND DISCUSSION
To carry out slope analysis at large scale on Martian surface based on low-resolution data, this paper presents an amplifying function of slopes derived from low-resolution DEMs based on the relationship between resolutions and slopes. The validity and feasibility of the proposed amplifying function are verified by multiple-source datasets including the HiRISE, CTX, HRSC and MOLA data. The experimental validation conveys the following conclusions:
1. The accuracies of slopes from low-resolution DEMs are improved with the proposed methods, which shows less discrepancies with those from high-resolution DEMs. 2. In most cases, the discrepancies have been reduced by about 50%. For three out of the four datasets evaluated in this study, the differences have been reduced to 2 degrees. 3. The comparison between HiRISE and MOLA data, which has the largest resolution ratio, shows the best result. The average of slope differences has been decreased from over 6 degrees to less than 2 degrees.
This study chooses datasets on Mars as an example, but the principles can be used for similar applications for other planetary bodies, such as the Moon and Mercury. It should be noted that this method will lose the validity in some extreme cases, such as a totally flat surface. However, in most situations, the proposed amplifying function shows good performances. descent, and landing challenges. Journal of spacecraft and rockets 44, 310-323.
HiRISE Slope (1m/px) Down-Sampled HiRISE Slope (50m/px) HRSC Slope (50m/px) Amplified HRSC Slope (50m/px) Slope (°)
Golombek, M., Cook, R., Moore, H., Parker, T., 1997. Selection of the Mars Pathfinder landing site. Journal of Geophysical Research: Planets 102, 3967-3988.
Golombek, M., Grant, J., Kipp, D., Vasavada, A., Kirk, R., Fergason, R., Bellutta, P., Calef, F., Larsen, K., Katayama, Y., 2012. Selection of the Mars Science Laboratory landing site. Space science reviews 170, 641-737.
Kirk, R., Howington‐Kraus, E., Rosiek, M., Anderson, J.,
Archinal, B., Becker, K., Cook, D., Galuszka, D., Geissler, P., Hare, T., 2008. Ultrahigh resolution topographic mapping of
Mars with MRO HiRISE stereo images: Meter‐scale slopes of
candidate Phoenix landing sites. Journal of Geophysical Research: Planets 113.
Kirk, R.L., Howington‐Kraus, E., Redding, B., Galuszka, D.,
Hare, T.M., Archinal, B.A., Soderblom, L.A., Barrett, J.M., 2003.
High‐resolution topomapping of candidate MER landing sites
with Mars Orbiter Camera narrow‐angle images. Journal of
Geophysical Research: Planets 108.
Lindemann, R.A., Voorhees, C.J., 2005. Mars Exploration Rover mobility assembly design, test and performance, Systems, Man and Cybernetics, 2005 IEEE International Conference on. IEEE, pp. 450-455.
Maimone, M., Cheng, Y., Matthies, L., 2007. Two years of visual odometry on the mars exploration rovers. Journal of Field Robotics 24, 169-186.
Malin, M.C., Bell, J.F., Cantor, B.A., Caplinger, M.A., Calvin, W.M., Clancy, R.T., Edgett, K.S., Edwards, L., Haberle, R.M., James, P.B., 2007. Context camera investigation on board the Mars Reconnaissance Orbiter. Journal of Geophysical Research: Planets 112.
McEwen, A.S., Eliason, E.M., Bergstrom, J.W., Bridges, N.T., Hansen, C.J., Delamere, W.A., Grant, J.A., Gulick, V.C., Herkenhoff, K.E., Keszthelyi, L., 2007. Mars reconnaissance orbiter's high resolution imaging science experiment (HiRISE). Journal of Geophysical Research: Planets 112.
Neukum, G., Jaumann, R., 2004. HRSC: The high resolution stereo camera of Mars Express, Mars Express: The Scientific Payload, pp. 17-35.
Smith, D.E., Zuber, M.T., Frey, H.V., Garvin, J.B., Head, J.W., Muhleman, D.O., Pettengill, G.H., Phillips, R.J., Solomon, S.C., Zwally, H.J., 2001. Mars Orbiter Laser Altimeter: Experiment summary after the first year of global mapping of Mars. Journal of Geophysical Research: Planets 106, 23689-23722.
Wu, B., Zhang, Y., Zhu, Q., 2011. A triangulation-based hierarchical image matching method for wide-baseline images. Photogrammetric Engineering & Remote Sensing 77, 695-708.
Wu, B., Zhang, Y., Zhu, Q., 2012. Integrated point and edge matching on poor textural images constrained by self-adaptive triangulations. ISPRS Journal of Photogrammetry and Remote Sensing 68, 40-55.
Zhu, Q., Wu, B., Tian, Y., 2007. Propagation strategies for stereo image matching based on the dynamic triangle constraint. ISPRS Journal of Photogrammetry and Remote Sensing 62, 295-308.
Zhu, Q., Zhang, Y., Wu, B., Zhang, Y., 2010. Multiple close‐
range image matching based on a self‐adaptive triangle
constraint. The Photogrammetric Record 25, 437-453.