TOWARDS THE OPTIMAL PIXEL SIZE OF DEM FOR AUTOMATIC MAPPING OF
LANDSLIDE AREAS
K.Pawłuszeka*, A. Borkowski a, P.Tarolli b
a Institute of Geodesy and Geoinformatics, Wroclaw University of Environmental and Life Sciences, Poland b Department of Land, Environment, Agriculture and Forestry, University of Padova, Italy
[email protected] [email protected]
Commission VIII, WG VIII/1
KEY WORDS: landslide, landslide mapping, DEM resolution, Neural Net classification, Maximum Likelihood classification
ABSTRACT:
Determining appropriate spatial resolution of digital elevation model (DEM) is a key step for effective landslide analysis based on remote sensing data. Several studies demonstrated that choosing the finest DEM resolution is not always the best solution. Various DEM resolutions can be applicable for diverse landslide applications. Thus, this study aims to assess the influence of special resolution on automatic landslide mapping. Pixel-based approach using parametric and non-parametric classification methods, namely feed forward neural network (FFNN) and maximum likelihood classification (ML), were applied in this study. Additionally, this allowed to determine the impact of used classification method for selection of DEM resolution. Landslide affected areas were mapped based on four DEMs generated at 1m, 2m, 5m and 10m spatial resolution from airborne laser scanning (ALS) data. The performance of the landslide mapping was then evaluated by applying landslide inventory map and computation of confusion matrix. The results of this study suggests that the finest scale of DEM is not always the best fit, however working at 1m DEM resolution on micro-topography scale, can show different results. The best performance was found at 5m DEM-resolution for FFNN and 1m DEM resolution for results. The best performance was found to be using 5m DEM-resolution for FFNN and 1m DEM resolution for ML classification.
* Corresponding author
1. INTRODUCTION
A landslide is defined as a mass movement of rock, debris or earth down a slope (Cruden, 1991) and is a common natural hazard that has an effect on economic, environmental and social issues (Leshchinsky et al., 2015). Therefore, mapping of landslides and producing landslide inventory maps are of interest to a wide range of specialists (Moosavi et al., 2014). Identifying landslide areas and producing landslide inventory maps (LIM) are fundamental for hazard assessments and disaster prevention. However, rapid mapping and LIM have different goals.
Rapid mapping needs fast analysis of data to provide maps depicting landslide affected areas. In contrary to rapid mapping, LIM provides detailed information about landslide types, estimated volumes of colluviums, main landslide features, morphometric parameters of landslide etc. The main goal of rapid mapping is to present landslide affected areas and its size immediately after major events to support disaster response (Stumpf, 2013). Rapid mapping typically targets map creation at a regional scale while more detailed characterization and monitoring often require site specific investigations (Stumpf, 2013).
Generally, landslide identification can be performed by applying of different approaches including geomorphological field reconnaissance (Ardizzone et al., 2007), interpretation of
stereoscopic aerial photographs (Li et al., 2016), surface and sub-surface monitoring and innovative remote sensing technologies such as the interpretation of synthetic aperture radar (SAR) images (Zhao et al., 2012, Del Ventisette et al., 2014), the interpretation of high resolution multispectral images (Cheng et al., 2004) or the analysis of high quality digital elevation models (DEMs) obtained from space or airborne sensors (Booth et al., 2009, Ardizzone et al., 2007, Van Den Eeckhaut et al., 2005, Tarolli et al., 2012, Tarolli., 2014). However, many of them are time-consuming (geomorphological field reconnaissance, surface and sub-surface monitoring) or are not applicable in forested regions (e.g. interpretation of high resolution multispectral images). Therefore, the versatile technique of rapid landslide mapping seems to be those, which remains to utilize DEM, especially delivered by Airborne Laser Scanning (ALS) data.
However, information provided by DEM depends on its spatial resolution (Mora et al., 2014, Tarolli, 2014). Spatial resolution of DEM reveals the surface features, patterns and morphology. It is known that inappropriate DEM resolution may entail misjudgment of landslide identification or misinterpretation of landslide features or morphology (Mora et al., 2014). Moreover, different landslide investigations can require various DEM resolutions. For instance, high resolution DEM allows to examine landslide morphology and recognize landslide features. On the contrary landslide susceptibility mapping does not require such high resolution of DEM (Pawłuszek and The International Archives of the Photogrammetry, Remote Sensing and Spatial Information Sciences, Volume XLII-1/W1, 2017
Borkowski, 2016, Pawłuszek and Borkowski, 2017, Mora et al., 2014). Some studies demonstrated that choosing the finest DEM resolution is not always the best choice (Mora et al., 2014, Tarolli and Tarboton, 2006, Penna et al., 2014). Thus, it is an open question, if small divergences in micro-topography scale, which are represented in DEM of a fine resolution increase the performance of landslide mapping process. Therefore, the main objective of this study is to investigate the impact of DEM pixel resolution on landslide mapping using pixel-based approach.
2. GENERAL SETTINGS OF THE STUDY AREA AND DATA USED
2.1 Study area
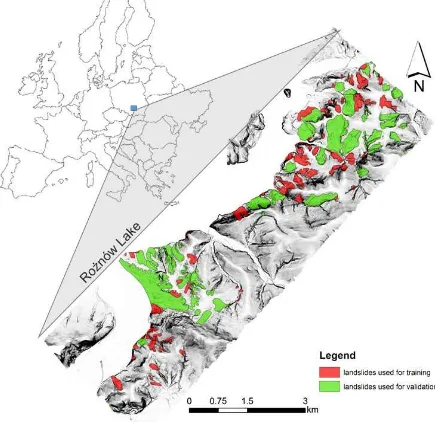
The study area is located in the central part of the Outer West Carpathians in Poland. This 28km2 area is located in the eastern part of Rożnów Lake. The geographical location is 49o44'N to 49o45'N latitude and 20o40′E to 20o43′E longitude.
From the geological point of view, the study area is built on flysch geological units which provides favourable conditions for of landslides development (Borkowski et al., 2011). According to the hydrological data, precipitation occurs frequently in the form of rain and snow throughout the winter. The annual mean precipitation of this area over the period of 1981–2010 is 800 mm (Woźniak, 2014). The main reasons of the landslide occurrence within the study area are sedimentary rocks and rainfalls. Moreover, landslide activity is also mostly associated with the fluctuation of water level in the Rożnów Lake and the flysch type of rocks (Borkowski et al., 2011). Three diverse land uses dominant within the study area: forest, agricultural and urban areas. Landslides mainly occur in forested areas and cropland, which makes them difficult to identify. Figure 1 depicts the location of the study area with existing landslides divided into two groups: training and testing subsets.
Figure 1. Study area with existing landslides (dataset divided for training and testing datasets)
2.2 Airborne laser scanning data
The airborne laser scanning (ALS) data was captured at the southeast edge of Rożnów Lake (Wojciechowski et al., 2012). The ALS data was obtained during the early spring in April 2010, to minimize the negative impact of the vegetation. The
data was obtained using the Lite Mapper 6800 scanning system of Riegl with a nominal resolution of 4 points per square meter (Borkowski et al., 2011). Up to 4 echoes were registered from each pulse. The ALS data filtering was performed using a method proposed by Borkowski and Jóźków (2008) which is based on iterative terrain approximation with two-dimensional active contour model (Borkowski and Keller, 2003).
2.3 Landslide inventory map
Landslide inventory map was obtained from “Landslide Counteracting System” called SOPO. Figure 1 presents existing landslides from SOPO, which were divided into training and validation dataset. SOPO system is created by Polish Geological Institute (Wójcik et al., 2015a, Wójcik et al., 2015b, Borkowski et al., 2011) to mitigate the negative effect of landslide activity. The goal of this system was to create landslide inventory maps and collect them in one database. The online database content is available to the public to browse and is free of charge. The SOPO database provides information about around 250 landslides within the study area (fig. 1). The landslide affected areas cover 6.14 km2, which means that 22% of total area is affected by landslides. Therefore, for training and testing 30% and 70% of randomly selected landslide areas were used, respectively.
3. METHODOLOGY
To examine the influence of DEM-resolution on automatic landslide mapping, four DEM-resolutions were tested. From each DEM, 12 DEM-derivatives were calculated. These derivatives were then utilized for landslide classification by means of two classification methods. The methodology flowchart is presented in Figure 2 and commented in the following subsections.
3.1 Fine to coarse DEM generation
The optimal pixel size of DEM depends on different aspects including the resolution of original data, complexity of the terrain and the purpose of the research. To examine the
Figure 2. Methodology flow diagram
The International Archives of the Photogrammetry, Remote Sensing and Spatial Information Sciences, Volume XLII-1/W1, 2017 ISPRS Hannover Workshop: HRIGI 17 – CMRT 17 – ISA 17 – EuroCOW 17, 6–9 June 2017, Hannover, Germany
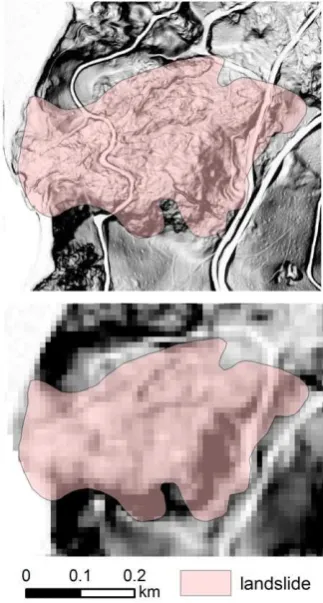
performance of classification with diverse DEM resolutions, DEMs of 1m, 2m, 5m and 10m were generated. However, the 4 pts/m2 data resolution responds to 0.5 by 0.5 m nominal resolution. This resolution was not tested because of computing time processing. Natural neighbor interpolation method was used to prevent from smoothing effect caused by other methods (Tarolli et al., 2012). Figure 3 shows differences between two DEM resolutions. It can be observed that 1m resolution of DEM makes it possible to map also smaller convergences/divergence which is critical for investigation of landslide morphology (Tarolli et al., 2012). However it is unknown if it is significant for effective rapid landslide mapping or rather provides too detailed, noisy information.
3.2 Rapid landslide mapping
Landslide mapping was performed by creating a composition of DEM and 12-DEM derivatives and then by applying pixel-based classification. The main objective of this study is to check if the resolution coarser than 1m has a meaningful influence on accuracy for automatic landslide mapping. Therefore, other post-processing algorithms such as filtering of classification results or false positive removal, which would increase classification accuracy, have not been applied to not disturb the results of classification by additional post classification steps. More precise descriptions of the further steps are provided by following subsections.
3.2.1 Generation of DEM-derivative compositions
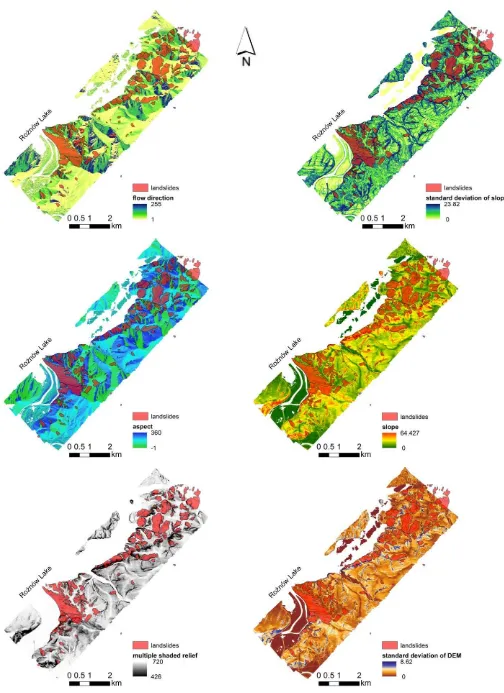
All DEM-derived layers were provided in GRID format with the cell size calculated correspondingly to the tested DEM resolution. The most frequently used in the literature, 12 diverse morphometric indicators were calculated independently for four DEMs. Some of them are presented in Figure 4. Table 1 presents main information, calculation patterns and references of DEM-derivatives used in this study.
DEM-derivatives Information and references slope [Spatial Analyst in ArcGIS™] curvature [Spatial Analyst in ArcGIS™]
mean aspect moving mean aspect filter using 3 x 3 pixel kernel size [Focal statistic in ArcGIS™]
flow direction GIS Geomorphometry & Gradient Metrics toolbox by Evans et al. 2014
mean slope moving mean slope filter using 3 x 3 pixel kernel [Spatial analyst toolbox in ArcGIS™]
side exposure index
GIS Geomorphometry & Gradient Metrics toolbox by Evans et al. 2014
slope 2nd derivative
GIS Geomorphometry & Gradient Metrics toolbox by Evans et al. 2014
slope position GIS Geomorphometry & Gradient Metrics toolbox by Evans et al. 2014
standard
moving standard deviation filter of slope using 3 x 3 pixel kernel size [Focal statistic in ArcGIS™]
standard deviation of elevation
moving standard deviation filter of elevation using 3 x 3 pixel kernel size [Focal statistic in ArcGIS™]
multiple shaded relief
summed values of eight raster created from hillshade analysis from eight diverse angle of sun [Spatial Analyst in ArcGIS™]
Table 1 DEM-derivatives explanation and references Figure 3 Landslide morphology on
diverse DEM-resolutions
3.2.2 Classification
As previously mentioned, 30% of landslide areas and 20% of non-landslide areas were used for the training. Based on the same training data set, classifications were performed for the four compositions created from morphometric indicators. Here, pixel-based classifications were used to classify each compositions for two classes: landslide areas and non-landslide areas. It is obvious that classification accuracy depends on selected classification methods. Therefore, to better evaluate the effectiveness of each pixel resolution for automatic landslide mapping, two classification techniques were tested: feed forwarded neural network (FFNN) and maximum likelihood (ML) classifications. These two classification methods were used as examples of parametric and non-parametric classifiers.
3.2.3 Feed Forward Neural Network
Artificial Neural Network (ANN) is the useful tool for data classification and have considerable potential for the classification of remotely sensed data. ANN is an empirical modelling tool that has an ability to identify underlying highly complex relationship from input-output data only. The FFNN utilizes standard backpropagation for supervised learning. The feed-forward neural network (FFNN) allows signals to travel only in one direction: from input to output. In FFNN there are no loops Thus, it tends to be straight forward network to associate input with outputs. FFNN are widely used in remote sensing applications, especially in pattern recognition (Ndehedehe et al., 2013). Some researchers concluded that multilayer feedforward neural network classification is universal approximation technique (Hornik et al., 1989). However, FFNN appears as a black box and the results strictly depends on used parameters (Ndehedehe et al., 2013). Therefore, in this study diverse numbers of iteration were tested.
Neural Network Classification
Composition size 5357mb 1343 mb 496 mb 124mb
DEM resolution 1m 2m 5m 10m
Test number Test 1 Test 2 Test 3 Test 4 Test 5 Test 6 Test 7 Test 8 Test 9 Test 10 Test 11 Test 12 Test 13 Test 14 Test 15 Test 16
Number of
iterations 10 20 50 100 10 20 50 100 10 20 50 100 10 20 50 100 Number of hidden
layers 1 1 1 1
Training threshold contribution/ training momentum
0.9 0.9 0.9 0.9
Training Rate/Training RMS
Exit Criteria
0.2/0.1 0.2/0.1
0.2/0.1 0.2/0.1
OA [%] 59.1 67.8 64.5 63.0 62.0 75.6 64.3 76.5 58.6 61.6 71.4 69.2 62.6 62.5 69.4 71.8
Kappa 0.20 0.22 0.21 0.22 0.20 0.17 0.25 0.13 0.14 0.24 0.25 0.27 0.16 0.20 0.17 0.13
PA (landslides) 75.4 55.1 63.4 70.2 68.6 25.3 72.3 17.1 62.5 77.7 50.5 61.0 55.9 65.6 39.7 27.2
UA (landslides) 31.2 34.3 32.9 32.9 32.2 39.7 34.4 39.6 23.3 33.9 38.6 37.8 32.0 33.7 35.2 35.3
PA (non-landslides) 54.6 71.3 64.8 64.0 60.2 89.4 62.1 92.8 57.9 56.9 77.3 71.6 64.6 61.5 78.2 85.1
UA(non-landslides) 89.1 85.3 86.7 88.3 87.5 81.3 89.1 80.3 90.5 90.0 84.6 86.6 83.1 85.7 81.3 79.6
Maximum Likelihood Classification
DEM resolution 1m 2m 5m 10m
OA [%] 70.6 73.7 72.0 69.9
Kappa 0.20 0.19 0.14 0.12
PA (landslides) 44.9 33.2 29.8 39.7
UA (landslides) 35.3 37.7 34.5 35.2
PA (non-landslides) 77.6 84.9 84.0 81.7
UA(non-landslides) 83.8 82.2 80.8 79.7
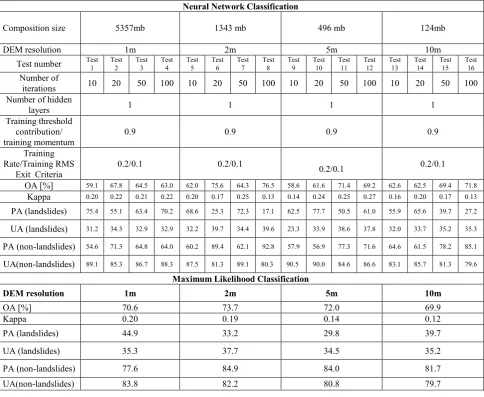
Table 2 Accuracy parameters of classification for FFNN and ML. Explanation in the text.
The International Archives of the Photogrammetry, Remote Sensing and Spatial Information Sciences, Volume XLII-1/W1, 2017 ISPRS Hannover Workshop: HRIGI 17 – CMRT 17 – ISA 17 – EuroCOW 17, 6–9 June 2017, Hannover, Germany
3.2.4 Maximum Likelihood Classification
ML is a supervised classification method which is based on the Bayes theorem. ML utilize a discriminant function to determine pixel to the class with the highest likelihood. The class mean vector and the covariance matrix are the fundamental sources for the function and can be estimated from the training pixels of a specific class (Asmala, 2012). The ML classification has commonly been assumed as unsuited to the classification of data types that can disturb various assumptions of parametric statistical techniques, such as categorical or non-Gaussian distribution of data sets (Duro et al., 2012). The ML algorithm tends to be not as much effective in the overall classification accuracy as modern non-parametric machine learning classifiers (e.g. ANN, support vector machine). Despite of these reservations, the MLC is still extensively applied in some studies aiming at comparison of various classifiers (Duro et al., 2012). On the contrary, Platt and Rapoza (2008) demonstrated that ML classifier exceeds the accuracy of the k-NN classification in pixel-based comparisons where the feature space (i.e. number of input variables) was not optimized.
3.3 Accuracy assessment
The implementation of classification was software-based in ENVI 5.4, and the results were validated by computation of Kappa (K) estimates, producer accuracy (PU), user accuracy (UA) and overall accuracy (OA). The OA is calculated by summing the number of correctly classified values and dividing by the total number of values. The Kappa can be used as a measure of agreement between model predictions and reality (Congalton, 1991) or to determine if the values contained in an error matrix represent a result significantly better than random (Jensen, 1996). Therefore, based on achieved K, OA and PA (tab. 2) evaluation of achieved results were performed.
4. RESULTS AND DISCUSSION
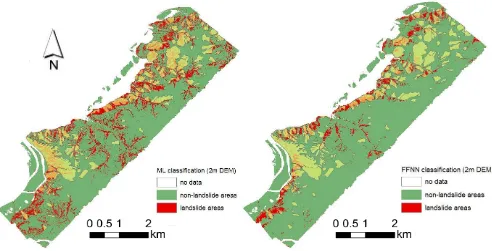
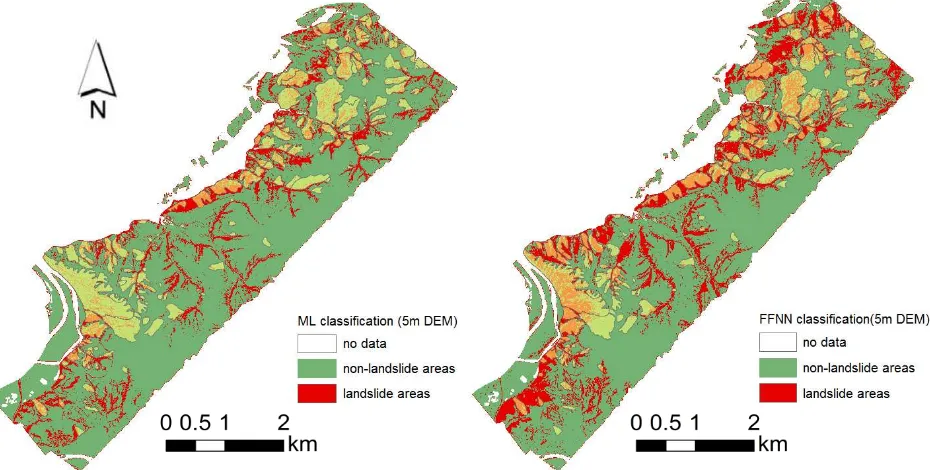
Table 2 summarizes the results of accuracy assessment for performed classification tests. Moreover, figures 5 and 6 show some representative landslide mapping results. Based on that, it can be concluded that finer DEM resolution classifies more landslide areas which increases the number of false negative pixels. This situation is mostly located in areas close to the river. Base on Table 2, it can be observed that the most effective landslide mapping results were achieved by using the 5m resolution of DEM and FFNN. The Kappa coefficient equal to 0.27 was achieved. In the contrary, for the DEM resolution of 1 m, the most effective classification results were achieved using LM classification. However, the Kappa coefficient does not differ significantly. It can be seen that the selected classification method have a significant impact on the classification performance and also for the selection of DEM resolution.
Based on achieved results, it can be concluded that non-parametric classifiers (FFNN) provide better performance but their effectiveness highly depends on used number of iteration. It is worth to emphasize that the number of iterations used in FFNN classification is crucial. As can be observed, not always the same number of iteration for diverse DEM resolution provides the best accuracy. For example, for 1m resolution it was 20 iterations, but for 2m and 5m resolution it was 100 iterations. Moreover, it indicates that more sophisticates classifiers allow for using a coarser resolution of DEM and simultaneously increase the performance of classification when selecting appropriate parameters of classification. Based on Table 2, the Kappa coefficient is the highest for 5 meter resolution of DEM and OA for 2 meter resolution. Additionally, the highest PA of landslide areas also appeared for 5m resolution. In the case of ML classification, it can be seen that coefficient decreases proportionally to the coarser DEM resolution. Based on that it can be assumed that performance of parametric classifiers such as ML decreases proportionally to the DEM resolution. However, the highest OA and PA of
Figure 5 Examples of classification results for 2m resolution of DEM
The International Archives of the Photogrammetry, Remote Sensing and Spatial Information Sciences, Volume XLII-1/W1, 2017 ISPRS Hannover Workshop: HRIGI 17 – CMRT 17 – ISA 17 – EuroCOW 17, 6–9 June 2017, Hannover, Germany
landslide areas, were found to be 2m and 5m resolution, respectively.
On the other hand, it is also worth to consider the size of data because for composition created from DEM and 12 DEM derivatives it is more than 5 Gb. Applying more DEM derivatives with such a resolution could be problematic and significantly increase computing time.
5. SUMMARY AND CONCLUSIONS
The objective of this study was to evaluate the impact of DEM resolution on automatic landslide mapping by using pixel-based approach. Four various spatial resolutions of DEM were generated from ALS data with a point density of 4 points per square meter. In order to evaluate the selected classification method in reference do DEM resolution, two different classification methods were used, namely FFNN and ML.
The presented study suggests that the finest scale of analysis is not always the best. Similar results were demonstrated by Hengl (2006), Paudel et al. (2016), Tarolli and Tarboton (2006), Penna et al. (2014) and Mora et al. (2014). Based on achieved results, it can be determined that selected spatial resolution of DEM depends mostly on objective of the study and used methodology. In the presented paper, pixel-based approach was tested by using non parametric and parametric classifiers. ML as an example of parametric classifiers presents a strong relationship between performance and resolution of the DEM. On the contrary, non-parametric classifiers presents that setting the appropriate parameters (number of interactions) allows for using a coarser resolution of DEM.
In this study we omitted application of post-classification algorithms. Implementation of these algorithms should increase the low value of Kappa coefficient.
REFERENCES
Ardizzone, F., Cardinali, M., Galli, M., Guzzetti, F., and Reichenbach, P., 2007. Identification and mapping of recent rainfall-induced landslides using elevation data collected by airborne Lidar. Natural Hazards and Earth System Science, 7(6), 637-650.
Asmala, A., 2012. Analysis of maximum likelihood classification on multispectral data. Applied Mathematical Sciences, 6(129-132), 6425-6436.
Booth, A. M., Roering, J. J., and Perron, J. T., 2009. Automated landslide mapping using spectral analysis and high-resolution topographic data: Puget Sound lowlands, Washington, and Portland Hills, Oregon. Geomorphology, 109(3), 132-147.
Borkowski, A., Jóźków, G., 2008. Airborne Laser Scanning Data Filtering Using Flakes. The International Archives of the
Photogrammetry, Remote Sensing and Spatial Information Sciences, Vol. XXXVII, Part B3b: 179–184.
Borkowski, A., Keller W., 2003. Modelling of irregularly sampled surfaces by two-dimensional snakes. Journal of Geodesy, 77, 543–553, DOI 10.1007/s00190-003-0354-1
Borkowski, A., Perski, Z., Wojciechowski, T., Jóźków, G. and Wojcik, A., 2011. Landslides mapping in Roznow Lake vicinity, Poland using airborne laser scanning data. Acta Geodyn. Geomater 8(163), 325–333
Cheng, K. S., Wei, C., and Chang, S. C., 2004. Locating landslides using multi-temporal satellite images. Advances in Space Research, 33(3), 296-301.
Congalton, R. G., 1991: A review of assessing the accuracy of classifications of remotely sensed data. Remote Sensing of Environment 37,35-46.
Figure 6 Examples of classification results for 5m resolution of DEM
Cruden, D. M., 1991. A simple definition of a landslide. Bulletin of Engineering Geology and the Environment, 43(1), 27-29.
Del Ventisette, C., Righini, G., Moretti, S., and Casagli, N., 2014. Multitemporal landslides inventory map updating using spaceborne SAR analysis. International Journal of Applied Earth Observation and Geoinformation, 30, 238-246.
Duro, D. C., Franklin, S. E. and Dubé, M. G., 2012. Multi-scale object-based image analysis and feature selection of multi-sensor earth observation imagery using random forests. International Journal of Remote Sensing, 33(14), 4502-4526.
Evans JS, Oakleaf J, Cushman SA, Theobald D., 2014. An ArcGIS Toolbox for Surface Gradient and Geomorphometric Modeling, version 2.0-0.
Available: http://evansmurphy.wix.com/evansspatial. Accessed: 2015 Dec 2nd.Hengl, T., 2006. Finding the right pixel size. Computers & Geosciences, 32(9), 1283-1298.
Hornik, K., Stinchcombe, M., and White, H., 1989. Multilayer feedforward networks are universal approximators. Neural Networks, 2(5), 359-366.
Jensen, J. R. 1996: Introductory Digital Image Processing: A Remote Sensing Perspective (Second edition). Prentice Hall, Inc., Upper Saddle River, New Jersey, USA.
Leshchinsky, B. A., Olsen, M. J., and Tanyu, B. F., 2015. Contour Connection Method for automated identification and classification of landslide deposits. Computers & Geosciences, 74, 27-38.
Li, Z., Shi, W., Myint, S. W., Lu, P., and Wang, Q., 2016. Semi-automated landslide inventory mapping from bitemporal aerial photographs using change detection and level set method. Remote Sensing of Environment, 175, 215-230.
Moosavi, V., Talebi, A., and Shirmohammadi, B., 2014. Producing a landslide inventory map using pixel-based and object-oriented approaches optimized by Taguchi method. Geomorphology, 204, 646-656.
Mora, O. E., Lenzano, M. G., Toth, C. K., and Grejner-Brzezinska, D. A., 2014. Analyzing the Effects of Spatial Resolution for Small Landslide Susceptibility and Hazard Mapping. The International Archives of Photogrammetry, Remote Sensing and Spatial Information Sciences, 40(1), 293.
Ndehedehe, C., Ekpa, A., Simeon, O., and Nse, O., 2013. Understanding the neural network technique for classification of remote sensing data sets. New York Science Journal, 6(8), 26-33.
Paudel, U., Oguchi, T., & Hayakawa, Y. (2016). Multi-resolution landslide susceptibility analysis using a DEM and random Forest. International Journal of Geosciences, 7(05), 726.
Pawłuszek, K., and Borkowski, A., 2016. Landslides identification using airborne laser scanning data derived topographic terrain attributes and support vector machine classification. The International Archives of Photogrammetry, Remote Sensing and Spatial Information Sciences, xli-b8, 145-149, doi:10.5194/isprs-archives-xli-b8-145-2016.
Pawluszek, K., and Borkowski, A., 2017. Impact of DEM-derived factors and analytical hierarchy process on landslide susceptibility mapping in the region of Rożnów Lake, Poland. Natural Hazards, 86, 919-952, doi:10.1007/s11069-016-2725-y
Penna, D., Borga, M., Aronica, G. T., Brigandì, G., and Tarolli, P., 2014. The influence of grid resolution on the prediction of natural and road-related shallow landslides. Hydrology and Earth System Sciences, 18(6), 2127.
Platt, R.V., and Rapoza, L., 2008. An evaluation of an object-oriented paradigm for land use/land cover classification. The Professional Geographer, 60, 87–100
Stumpf, A., 2013. Landslide recognition and monitoring with remotely sensed data from passive optical sensors. Doctoral dissertation, Université de Strasbourg.
Tarolli, P., 2014. High-resolution topography for understanding Earth surface processes: Opportunities and challenges. Geomorphology, 216, 295-312.
Tarolli, P., and Tarboton, D. G., 2006. A new method for determination of most likely landslide initiation points and the evaluation of digital terrain model scale in terrain stability mapping. Hydrology and Earth System Sciences Discussions, 10(5), 663-677.
Tarolli, P., Sofia, G., Dalla Fontana, G., 2012. Geomorphic features extraction from high-resolution topography: landslide crowns and bank erosion. Natural Hazards, 61(1), 65-83.
Van Den Eeckhaut, M., Poesen, J., Verstraeten, G., Vanacker, V., Moeyersons, J., Nyssen, J. and Van Beek, L. P. H., 2005. The effectiveness of hillshade maps and expert knowledge in mapping old deep-seated landslides. Geomorphology, 67(3), 351-363.
Wojciechowski, T., Borkowski, A., Perski, Z., Wójcik, A., 2012. Airborne laser scanning data in the study of landslide- case study: landslide in Zbyszyce (Outer Carpathians). Przegląd Geologiczny, 60(2), 95-102.
Wójcik, A., Wojciechowski, T., Wódka, M., Krzysiek, U., 2015a. Explanations to the landslides inventory maps and areas prone to mass movements in the scale of 1: 10000.
Municipality of Gródek nad Dunajcem, district: nowosądecki,
province: małopolskie.
http://geoportal.pgi.gov.pl/portal/page/sopo (access on 5.06.2016; in Polish)
Wójcik, A., Wojciechowski, T., Wódka, M., Krzysiek, U., 2015b. Landslide inventory map of landslide in Gródek nad Dunajcem in the scale of 1: 10000. Municipality of Gródek nad Dunajcem, district: nowosądecki, province: małopolskie. http://geoportal.pgi.gov.pl/portal/page/sopo (access on 5.06.2016; in Polish)
Woźniak, A., 2014. Anomalously high monthly precipitation totals in the Polish Carpathian Mountains and their foreland (1881–2010). Prace Geograficzne. 138:7–28 (in Polish)
Zhao, C., Lu, Z., Zhang, Q., and de La Fuente, J., 2012. Large-area landslide detection and monitoring with ALOS/PALSAR imagery data over Northern California and Southern Oregon, USA. Remote Sensing of Environment, 124, 348-359.
The International Archives of the Photogrammetry, Remote Sensing and Spatial Information Sciences, Volume XLII-1/W1, 2017 ISPRS Hannover Workshop: HRIGI 17 – CMRT 17 – ISA 17 – EuroCOW 17, 6–9 June 2017, Hannover, Germany