CARTOGRAPHIC REPRESENTATION OF SPATIAL DATA QUALITY IN VGI FOR
USERS WITH DIFFERENT SEMANTICS
R. Esmaeili* and F. Karimipour
Faculty of Surveying and Geospatial Engineering, College of Engineering, University of Tehran, Tehran, Iran (roya.esmaeili, fkarimipr)@ut.ac.ir
Commission II, WG II/4
KEYWORDS: Spatial Data Quality, Users’ Semantics, VGI, Positional Accuracy, Completeness
ABSTRACT:
Volunteered geographic information is constantly being added, edited or removed by users. Most of VGI users are not experts, thus formal representation of spatial data quality parameters through metadata standards does not efficiently communicate, as it may be interpreted differently by different users with different semantics. In addition, a user may not be able to decide on the relevant dataset for their in-hand application. In this paper, we propose providing VGI users with the spatial data quality parameters through simple cartographic representations, which is independent of users’ semantics. The problem is described and its implementation results for a simple case study are represented.
* Corresponding author
1. INTRODUCTION
The emergence of internet has developed producing and sharing of information. The information is used to be created solely by professionals, and users were just consumers and could not get involved in production and editions processes (Cooper et al., 2012). Advances in spatial data collection technologies (e.g., cell phones, digital cameras, PDAs and other hand-held devices equipped with GPS) along with online services have dramatically increased the contribution of ordinary people in producing, sharing and usage of geographic information. This has led to a huge source of spatial data termed as Volunteered Geographic Information (VGI) by Mike Goodchild (Goodchild, 2007). The well-known OpenStreetMap (OSM), Wikimapia, and Google Map Maker are examples of environments whose data are provided by their users.
Similar to other crowdsourced information, volunteered geographic information is constantly being added, edited or removed by users. Thus, the existing data can be improved over time, which makes the quality of volunteered geographic information dynamic. As most of VGI users are not experts, system administrators deploy various user- and content-driven approaches to control the quality of information to ensure providing their users with relevant datasets. As a non-spatial example, among other strategies, Wikipedia use crowdsensusto evaluate the quality of its articles’ contents (Adler and Alfaro, 2007; Wöhner, 2009). However, relevant data may differ from one application to another depending on the quality aspects (e.g., spatial accuracy, attribute accuracy, updateness, completeness, and logical consistency) that are important for the given application. It is very common in geographic communities to evaluate the relevancy of datasets for an application based on metadata, which expresses different aspects of quality of datasets. In the case of VGI, however, users are not experts and do not necessarily have enough spatial knowledge to interpret the standard metadata statements. In other words, their semantics influence how they infer the quality
of data from metadata: Although “completeness = 60%” accurately present an aspect of data quality for a given dataset, non-expert users may not be able to decide on relevancy of this dataset for their applications.
In this paper, we propose providing VGI users with the spatial data quality parameters through simple cartographic representations, which is independent of users’ semantics and let them decide on relevancy of datasets for their in-hand applications. The users select the desired quality parameters as well as the visualization element (e.g. color, line thickness, intensity, style, etc.) to classify the datasets. The datasets are represented by the selected element based on their metadata information, which helps the users to visually evaluate the quality of datasets. The proposed method has been inspired by WikiTrust (Adler et al., 2010; wikitrust, 2012), which automatically assesses the credibility of content and author reputation of wiki articles, and then uses different text and text-background colors to represent this assessment to users (Figure 1): High reputation text, revised by many high-reputation colors, will appear over a white background, while low-reputation text, which has not benefitted yet from revision by multiple, high-reputation users, is displayed over an orange background; the more intense the orange, the lower the reputation of text.
In the following, the problem is described in more details based on the concept of semantics interoperability. Then, the proposed approach is described and is applied to a case study.
2. QUALITY ISSUES IN VGI
Spatial data quality is getting more attention due to increase of variety and usage of spatial data (Ather, 2009). "Unlike the geographic information produced by mapping agencies and corporations, VGI carries no guarantees of accuracy" (Goodchild, 2009), therefore their quality and reliability is questionable.
The International Archives of the Photogrammetry, Remote Sensing and Spatial Information Sciences, Volume XL-3/W3, 2015 ISPRS Geospatial Week 2015, 28 Sep – 03 Oct 2015, La Grande Motte, France
This contribution has been peer-reviewed. Editors: A.-M. Olteanu-Raimond, C. de-Runz, and R. Devillers
doi:10.5194/isprsarchives-XL-3-W3-81-2015
Figure 1. Representing the credibility of content to users by WikiTrust through different text and text background colors (Source: http://en.wikipedia.org/wiki/WikiTrust)
VGI is mostly based on human experience of geography, thus instead of measurement-based parameters used in the case of official spatial data, there are suggestions to express their quality through perception-based parameters. For example, Navratil (2009) proposed expressing quality of spatial data with possibility distributions instead of precise numbers. Longueville et al. (2010) introduced the concept of degree of truth to describe object models with vagueness and then expressed that an object with the degree of truth tends to have this characteristic. Finally, Flanagin and Metzger (2008) believe that credibility, as a perceptual variable, is adequate for evaluating collaborative productions, and "…although there is no clear definition of credibility, it is generally thought to be the believability of a source or message, which is composed of two primary dimensions: trustworthiness and expertise".
The above discussion lead to the idea that spatial quality of VGI highly depends on the user who collected the data, but also on how she assesses and interprets the quality of this dataset. On the other hand, this individual-based interpretation of quality influences the interpretation of the user about how this dataset is reliable and suits her current application.
3. SEMANTIC INTEROPERABILITY IN REPRESENTING SPATIAL QUALITY TO USERS
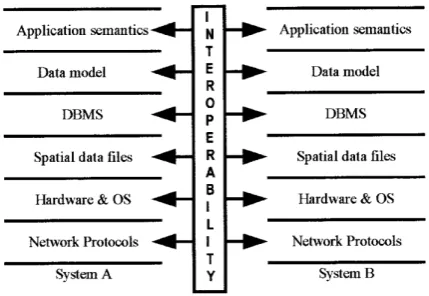
With a rapid development in information systems and distributed databases, the need for interoperable geographic information system was realized, i.e., a system that could provide information portability and inter-application cooperative process control. As Figure 2 shows, semantic interoperability is the top level of interoperability (Bishr, 1998). Semantic definition depends on the field of study, but it commonly investigate the meaning of symbols in communication and how the information can be described unambiguously (Keßler et al., 2009).
Figure 2. Levels of interoperability (Bishr, 1998)
Semantic interoperability refers to ability of different systems to share information such that the semantics of the information
stored in one system and transferred to another will be correctly interpreted (Bishr, 1998). The semantic interpretations of geographic information can differ considerably, which frequently causes misunderstandings when using and combining data and services on the Web (Janowicz et al., 2012). According to the meaning triangle (also called semiotic triangle), there is a relationship between real world objects, symbols and concepts or interpretation (MacEachren, 1995; Ogden et al., 1946). In the case of VGI, where data are produced by various users with different semantics and perceptions, the users’ semantics may influence the data in both of entering and receiving the data from the database. While there has been exhaustive research on how to handle the users’ semantic in entering the data by users (Pazoky et al., 2014), the reverse issue has less be explored: How a non-expert user will interpret the formal metadata that expresses the spatial data quality parameters for a given dataset, and how she decides if this dataset is relevant for her in-hand application?
This paper focuses on how to represent the spatial data quality to the less expert users with different semantics. As discussed, although (formal) numerical representation of data quality parameters transfer the same message to expert users, it may lead to different interpretations by non-experts. Our approach is based on representing the spatial data quality to the users through simple visual (cartographic) elements, which are pretty interpreted the same by different users. Although this leads to decreasing the information content for expert users, its advantage in alleviating the user’s semantics in interpreting the spatial data quality is considerable.
4. PROPOSED APPROACH TO REPRESENT SPATIAL DATA QUALITY INFORMATION IN VGI
Different methods are proposed in the literature to assess the spatial quality of VGI (Haklay, 2008), which is beyond the scope of this paper. Having determined the quality parameters of the datasets (Karimipour et al., 2013), the features are demonstrated by a certain visual element so that the user has an understanding of their quality. The visual elements that can be used are as follows (Figure 3):
• Color classification: The datasets are classified into different quality classes. Then, the datasets of each class are shown in different colors. For example, the datasets with the highest, medium and the lowest quality are drawn in, respectively, green, yellow and red. This can be used for point, line and polygon feature datasets.
• Color intensity: The datasets are ordered based on their quality and they are shown by different color intensity. For example, the datasets with the highest and the lowest quality are drawn in, respectively, dark blue and light blue. This can be used for point, line and polygon feature datasets.
• Feature Size: The datasets are ordered based on their quality and they are symbolized in different sizes. For point The International Archives of the Photogrammetry, Remote Sensing and Spatial Information Sciences, Volume XL-3/W3, 2015
ISPRS Geospatial Week 2015, 28 Sep – 03 Oct 2015, La Grande Motte, France
This contribution has been peer-reviewed. Editors: A.-M. Olteanu-Raimond, C. de-Runz, and R. Devillers
doi:10.5194/isprsarchives-XL-3-W3-81-2015
features, it means different symbol sizes; and for line features, it is different line thicknesses. For polygon features, it can be adapted as differentiation in hatching intensity.
Figure 3. The proposed approach for representation of spatial quality information to the VGI user
5. IMPLEMENTTION
This section describes the results of an implementation developed based on the proposed approach. First, data collection process is introduced. Quality assessment and presentation of the collected data are presented afterwards.
5.1 Data Collection
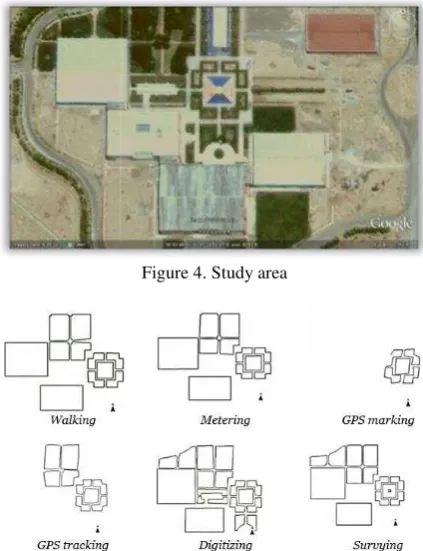
Ten planimetric maps were produced for a small area (Figure 4) using different data collection methods: walking, measuring by tape, GPS marking, GPS tracking, digitizing and surveying using total station (Figures 5 and 6). In order to have datasets with different spatial qualities (limited here to positional accuracy and completeness), the data collection was performed by different users.
5.2 Quality Assessment
For each datasets, positional accuracy and completeness were assessed as follows:
•Positional accuracy: Since there is no reference data to assess the positional accuracy of the datasets, we obtained a relative positional accuracy for each one: First, an initial positional accuracy was assigned to each dataset depending on the data collection method as well as the instruments used. This initial value is considered as the weight where a weighted average coordinate were computed for each point using its coordinate in all of the datasets that the point has appeared. For each point in each dataset, we calculated its deviation from the average. Finally, the average of all the deviations calculated for each dataset is assigned to that dataset as its positional accuracy.
•Completeness: Again, a relative completeness parameter was calculated for the datasets: The union of all points appeared in all of the datasets was assumed to be the complete data (we assumed no straight line is split into several segments in any of the datasets). Dividing the
number of points of each dataset to all points yields its completeness.
Figure 4. Study area
Figure 5. Examples of the produced maps from the study area
Figure 6. Overlay of the ten datasets collected from the study area
5.3 Quality Presentation
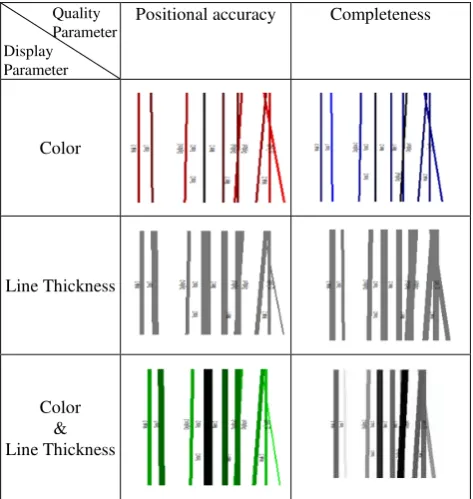
An ArcGIS extension was developed to visually represent the quality information (i.e., positional accuracy and completeness) assessed for each dataset to the user. A user selects a number of datasets as well as the desired quality parameter (positional accuracy or completeness). In the case of color intensity, a base color is selected by the user; then the desired quality parameter of the selected datasets are distributed over the gray scale of 0 to 255. In the case of using symbol size, the minimum and maximum symbol size are specified by the user (Table 1); the The International Archives of the Photogrammetry, Remote Sensing and Spatial Information Sciences, Volume XL-3/W3, 2015
ISPRS Geospatial Week 2015, 28 Sep – 03 Oct 2015, La Grande Motte, France
This contribution has been peer-reviewed. Editors: A.-M. Olteanu-Raimond, C. de-Runz, and R. Devillers
doi:10.5194/isprsarchives-XL-3-W3-81-2015
symbol size of the selected datasets are distributed over this range according to the selected quality parameter.
Quality Parameter Display Parameter
Positional accuracy Completeness
Color
Line Thickness
Color & Line Thickness
Table 1. Visual representation of spatial quality parameters of the datasets by color, line thickness and both (Karimipour et al., 2013)
4. CONCLUSION AND FUTURE WORK
This paper proposed an approach to visually present the spatial data quality parameters to VGI non-expert users with different semantics. As VGI users do not necessarily have high spatial knowledge, this approach helps them to evaluate and compare the available datasets based on quality parameters that are important in their current applications.
Here, we focused on positional accuracy and completeness as the quality parameters. However, there may be other parameters that are important for the users, e.g., updateness or logical consistency. On the other hand, our implementation can classify the datasets based on only one quality parameter. Its extension to simultaneously classify the datasets regarding a combination of quality parameters is a future direction of the research.
REFERENCES
Adler, B.T., Alfaro, L.d., 2007. A Content-Driven Reputation System for the Wikipedia, 16th international conference on World Wide Web, Banff, Alberta, Canada, pp. 261-270.
Adler, B.T., LucadeAlfaro, Pye, I., 2010. Detecting Wikipedia Vandalism Using WikiTrust Lab Reportfor PAN at CLEF 2010. CLEF (Notebook Papers/LABs/Workshops).
Ather, A., 2009. A Quality Analysis of OpenStreetMap Data, Department of Civil, Environmental & Geomatic Engineering University College London.
Bishr, Y., 1998. Overcoming the semantic and other barriers to GIS interoperability. International Journal of Geographical Information Science 12, 299-314.
Cooper, A., Coetzee, S., Kourie, D., 2012. Volunteered Geographical information – The Challenges. PoPositionIT, 34-38.
Flanagin, A., Metzger, M., 2008. The Credibility of Volunteered Geographic Information. GeoJournal 72, 137-148.
Goodchild, M.F., 2007. Citizens as sensors: the world of volunteered geography. GeoJournal 69, 211-221.
Goodchild, M.F., 2009. Geographic information systems and science: today and tomorrow. Annals of the Association of American Geographers 15, 3-9.
Haklay, M., P. Weber, 2008. OpenStreetMap: User-Generated Street Maps. PERVASIVE computing 7, 12-18.
Janowicz, K., Scheider, S., Pehle, T., Hart, G., 2012. Geospatial semantics and linked spatiotemporal data–Past, present, and future. Semantic Web 3, 321-332.
Karimipour, F., Esmaeili, R., Navratil, G., 2013. Cartographic representation of spatial data quality parameters in volunteered geographic information, The 26th international cartographic conference (ICC).
Keßler, C., Raubal, M., Wosniok, C., 2009. Semantic rules for context-aware geographical information retrieval, Smart Sensing and Context. Springer, pp. 77-92.
Longueville, B.D., Ostländer, N., Keskitalo, C., 2010. Addressing Vagueness in Volunteered Geographic Information (VGI) – A Case Study. International Journal of Spatial Data Infrastructures Research 5.
MacEachren, A.M., 1995. How Maps Work: Representation, Visualization, and Design. The Guilford Press.
Navratil, G., 2009. Modeling Data Quality with Possibility Distributions, in: Stein, A., Shi, W., Bijker, W. (Eds.), Quality Aspects in Spatial Data Mining. CRC Press, Boca Raton, pp. 91-99.
Ogden, C.K., Richards, I.A., Malinowski, B., Crookshank, F.G., 1946. The meaning of meaning. Harcourt, Brace & World New York.
Pazoky, S.H., Karimipour, F., Hakimpour, F., 2014. An Ontological Solution for Perceptual Uncertainties of VGI, Proceedings of the Extended Abstracts of 8th International Conference on Geographic Information Science (GIScience 2014), Vienna, Austria.
wikitrust, 2012. http://en.wikipedia.org/wiki/WikiTrust.
Wöhner, T.a.R.P., 2009. Assessing the Quality of Wikipedia Articles with Lifecycle Based Metrics, 5th International Symposium on Wikis and Open Collaboration, Orlando, Florida.
The International Archives of the Photogrammetry, Remote Sensing and Spatial Information Sciences, Volume XL-3/W3, 2015 ISPRS Geospatial Week 2015, 28 Sep – 03 Oct 2015, La Grande Motte, France
This contribution has been peer-reviewed. Editors: A.-M. Olteanu-Raimond, C. de-Runz, and R. Devillers
doi:10.5194/isprsarchives-XL-3-W3-81-2015