* Corresponding author
CROWDSOURCING BIG TRACE DATA FILTERING: A PARTITION-AND-FILTER
MODEL
X. YANG a, L. TANG a*
a State Key Laboratory of Information Engineering in Surveying, Mapping, and Remote Sensing, Wuhan University, Wuhan 430079, China.
KEY WORDS: Crowdsourcing traces, Trace partitioning, GPS trace filtering, GPS baseline
ABSTRACT:
GPS traces collected via crowdsourcing way are low-cost and informative and being as a kind of new big data source for urban geographic information extraction. However, the precision of crowdsourcing traces in urban area is very low because of low-end GPS data devices and urban canyons with tall buildings, thus making it difficult to mine high-precision geographic information such as lane-level road information. In this paper, we propose an efficient partition-and-filter model to filter trajectories, which includes trajectory partitioning and trajectory filtering. For the partition part, the partition with position and angle constrain algorithm is used to partition a trajectory into a set of sub-trajectories based on distance and angle constrains. Then, the trajectory filtering with expected accuracy method is used to filter the sub-trajectories according to the similarity between GPS tracking points and GPS baselines constructed by random sample consensus algorithm. Experimental results demonstrate that the proposed partition-and-filtering model can effectively filter the high quality GPS data from various crowdsourcing trace data sets with the expected accuracy.
1. INTRODUCTION
In our big data era, data is being generated, collected and analysed at an unprecedented scale, and data-driven decision making is sweeping through all aspects of society. Recent studies used volume, velocity, variety, value, and veracity to characterize the key properties of big data. Compared with
volume, velocity, variety and value, the fifth ‘V’ of big data,
veracity is more important to knowledge mining because poor quality data has serious consequences on the results of data analyses. So to extract value and make big data operational, veracity, is increasingly being recognized. Data cleansing and data quality management for veracity are the pressing need, and it ensures data in a databases represent the real world entities to which they refer in a consistent, accurate, complete and unique way (Saha, et al., 2014). Without proper data quality management, even minor errors can accumulate resulting in process inefficiency and failure to comply with industry and government regulations (the butterfly effect (Samimi, et al., 2012)). Crowdsourcing big trace data is a kind of spatial
positional big data and bears the characteristics of five ‘V’
features like other big data. Specifically, it provides us with an unprecedented window into the dynamics of urban areas. This information has been analysed to uncover traffic patterns (Masciari et al., 2014, Castro et al., 2012), city dynamics (Tu et al., 2015, Tu, Li, et al., 2015), and urban hot-spots (Tang, et al., 2015). At the same time, crowdsourcing big trace data also makes it possible for mining different sophistication degree of urban information such as centreline-level, carriageway-level and lane-level road map refinement. However, the precision of crowdsourcing traces in urban area is very low because of low-end GPS data devices and urban canyons with tall buildings, thus making it difficult to mine high-precision geographic information such as lane-level road information (Tang, Yang, et al., 2015, Zhou, Li, et al., 2015). In this paper, we propose an efficient partition-and-filter model to filter trajectories, which includes trajectory partitioning and trajectory filtering. For the partition part, the partition with position and angle constrain algorithm is used to partition a trajectory into a set of sub-trajectories based on distance and angle constrains. Then, the
trajectory filtering with expected accuracy method is used to filter the sub-trajectories according to the similarity between GPS tracking points and GPS baselines constructed by random sample consensus algorithm.
Different to the existing methods of data quality management of GPS traces, the main goal of this paper is to provide a way for crowdsourcing big trace data filtering which can classify data according to their positional accuracy.
2. METHODOLOGY 2.1 Crowdsourcing traces
Crowdsourcing traces means that traces are collected by soliciting contributions from a large group of people, rather than from traditional employees or suppliers. It is a low-cost and efficient way to extract useful information from crowdsourcing big trace data. The traces via crowdsourcing way recorded the location, time, and other movement characteristics of moving objects. The veracity of crowdsourcing big trace data predominantly focused on the quality of positional accuracy of GPS records. It is generally known that the quality of crowdsourcing big trace data is poor in urban area because of low-end GPS devices, complicated surroundings and crowdsourcing gathering way and so on. For example, the positioning accuracy of the civil C/A code GPS receiver is about 10-15 m. That means a part of outliers and noises lower the precision level of the data set but some high-precision GPS tracking points still mix in the raw GPS traces (Bradford, et al., 1996).
2.2 Methodology of partition-and-filter model
On the basis of the crowdsourcing big trace data quality and its causes analysis, this paper proposed a partition-and-filter model to filter GPS data according to their positional accuracy. Different to the traditional GPS data filtering methods, the partition-and-filter model is used to classify GPS data based on their positioning accuracy rather than correct or repair GPS data. At the same time, based on the partition-and-filter model, we
develop a trajectory partition algorithm PPAC and a trajectory
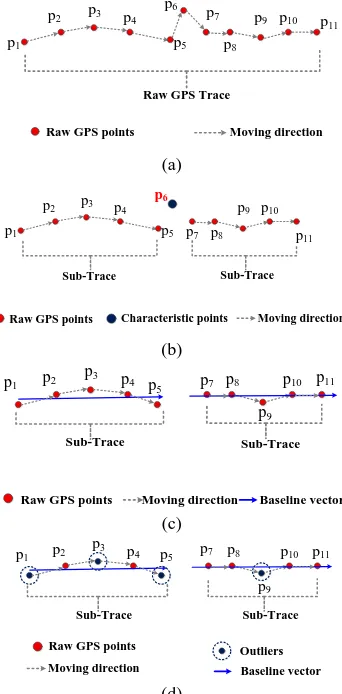
Raw GPS points Characteristic points Moving direction
(b)
Raw GPS points Moving direction Baseline vector Sub-Trace Sub-Trace
Figure 1. Methodology of partition-and filter model Given a set of trajectories T={Tr1,Tr2, …, Trn}, and Tri is one of them, as shown in figure 1(a). According to the partition-and-filter model, first, the PPAC algorithm is used to identify characteristic points CP={ cp1,cp2, …, cpm} of Tri, and these characteristic points partition Tri into a set of sub-trajectories, as shown in figure 1(b). At the same time, these characteristic points will be primarily separated as a cluster and considered as outliers because their positon and angle are different to other points in the whole trajectory. After first step, filtering high-precision tracking points from traces is relatively easy because of the reduction of interference from outliers.
Then, we present that use TFRA algorithm to filter precision points from sub-trajectories. Generally, filtering high-precision points form sub-trajectories without a positional
reference is very difficult because we don’t know which point is
satisfied with the expected precision. Thus, the first step of TFRA is to construct a positional reference which is called as GPS baseline. As shown in figure 1(c), each sub-trajectory of Tri is regarded as the object and its GPS baseline is constructed by using random sample consensus method based on the high consistency of high-precision points in position and heading. Then GPS baseline will be regarded as the positional reference to filter points that means the more similar the GPS points with GPS baseline are, the more precision the GPS points are. To evaluate the similarity between tracking point and GPS baseline, a similarity evaluation model is presented. What is more, we devise a method by analysing the relation between similarity and positional accuracy of GPS points to acquire the similarity
threshold to filter data, as shown in figure 1(d). In the rest of this chapter, we will provide more details on the technical aspects of the partition-and-filter model.
2.2.1 Partition with position and angle constrain (PPAC): Trajectory partition is a preliminary step in trajectory data mining (Rasetic, et al., 2005), and it is also the first phase of the partition-and-filter model. Most trajectory partition methods always focus on the trajectory location and sampling time interval, velocity constraint or other movement characteristics of moving objects (Lee, et al., 2008, Zhang and Wang, 2011). But for partition-and-filter model, we only highlight the positional accuracy of filtered data. Although the current research shows that the positional accuracy of GPS tracking points can be speculated according to its location, velocity and sampling time interval (Krishnan, et al., 2015), we are left with considering with position and angle constraint because of the low-sampling rate of crowdsourcing trace data. Hence, we propose a trajectory partition method PPAC with position and angle constraint. Moreover, we devise an adaptive partitioning termination threshold to meet the trajectory data processing requirements.
The key issue for partitioning a Tri into a set of sub-trajectories is to find out all the characteristic points in it. In this section, we propose a new trajectory partitioning algorithm which aims at finding the points where the behaviour of a trajectory changes rapidly. The main idea is to check the value of the threshold of distance and angle, with respect to the present move action.
|Pi+2 Pi+2'|
Figure 2. Partition with position and angle constraint Assuming that the trajectory Tri contains a series of tracking points pi, i=1,2,…, n, as shown in figure 2. The partitioning thresholds of distance and angle are do and ao, respectively. Then the principle of PPAC algorithm is described as Table 1.
1. Input : Trajectory: Tri(p1, p2, p3, …, pn);
2. Output: A set of characteristic points CP(c1,c2,…,ck)
3. c1=p1, startIndex=1;length=1; partitioning termination threshold: ao, do
Table 1. The principle of trajectory partitioning
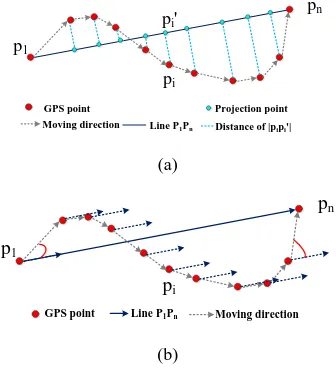
The parameters verdisj and angdisj show the vertical distance from point pj to the start vector and the angle between vector pjpj+1 and the start vector. In order to obtain better partitioning, the appropriate threshold should be determined. In this paper, the partitioning termination thresholds ao and do are determined by evaluating the complexity of trajectory shape. We use the standard deviation of the distance between point pi and its projection point pi′ on p1pn, as shown in figure 3a, and the standard deviation of angle between directed line pipi+1 and p1pn, as shown in figure 3b, and the curvature of trajectory Tri to describe its shape complexity.
GPS point Line P1Pn Moving direction
pn
pi
(b)
Figure 3. Trajectory shape complexity. (a) and (b) indicate the computation of trajectory shape complexity.
Specifically, the curvature ρ of trajectory Tri can be calculated as: Then the value of ao and do are calculated as follows:
the adaptive termination threshold adapts flexibly to all types of trajectory segments, and overcomes the disadvantage that other partition algorithms with fixed termination threshold.
2.2.2 Trajectory filtering with required accuracy (TFRA): Trajectory filtering is the second phase of the partition-and-filter model, and also the most important and critical step of trajectory classification based on the required precision. Different to the traditional GPS data filtering methods, TFRA is used to classify GPS data based on their positional accuracy rather than correct or repair GPS data. According to the recent study, GPS noises caused by complicated surroundings, low-end GPS devices, crowdsourcing way and so on are always regarded as outliers. Though a lot researchers discussed outliers detection and removal from raw GPS traces (Lee, et al., 2008, Yu, et al., 2014, Gupta, et al., 2014) but trajectory filtering according to different positional accuracy demands has been
little investigated. Because it’s very difficult to identify the
positional accuracy of GPS measurements collected via crowdsourcing way without any space position reference. Thus, in order to identify the position accuracy of GPS measurements, the first step of TFRA is to construct a positional reference which are called as GPS baseline in this paper. Then, TFRA evaluates the similarity between GPS points and GPS baseline for further filtering.
Most moving objects keep moving along the route and change moving direction in a short time. The GPS trajectory reflects the tendency of moving object. Thus, the high-precision data reflects high consistency in positon and heading. For example, tracking points of vehicles with high positional accuracy always cluster together along the centreline of each lane, and its heading will not change a lot unless they are at an intersection or change lanes. Based on this observation, we proposed that using GPS baseline to help TFRA filter high-precision GPS measurements from raw GPS traces. Specifically, the GPS baseline is a directed line segment which belongs to the straight line l, as shown in figure 4. Therefore, we equate the straight line l extraction with the construction of GPS baseline. To avoid the adverse effect of these noises, we use random sample consensus method (RANSAC) to construct GPS baseline (Yaniv, 2010).
Inliers Outliers Moving direction The straight line l GPS baseline
Figure 4. Generation of GPS baseline based on RANSAC According to RANSAC algorithm, the estimated of model is called as M*. The threshold which defines if a GPS points pi agrees with model M* is set as τ. The number of iteration is set as N, and the number of data elements required to fit M* is donated as s. The basic principle of using RANSAC algorithm to generate the GPS baseline is described in reference ‘Yaniv, 2010’.
In this study, GPS baseline is generated by using RANSAC algorithm and then regarded as the positional reference to filter high-precision GPS points. That means GPS point which has a high similarity with the GPS baseline will be classified as the high-precision data. Here, we only care about the location accuracy of GPS points rather than the sampling rate and speed of moving objects. Therefore, to evaluate the similarity between GPS points and the GPS baseline we present a similarity evaluation model with heading and distance constraint. The similarity measure of TFRA is defined in the form of linear weighting:
'
1 cos
1 2
,
k k k
k
p p p G
sim
e
e
(4)Where |pkpk′| is the distance between pk and its projection point pk′ on GPS baseline G, θk is the angle between pk’s heading and GPS baseline G, ω1 and ω2 are the weighting of the difference of vertical distance and angle, ω1+ω2=1. In general similarity of GPS points and GPS baseline ranges from 0 to 1.
After similarity computation, we need to set similarity threshold to filter data from raw GPS traces, and each similarity threshold directly determines the positional accuracy of filtered data. According to our idea, the similarity threshold should corresponds with the expected precision of filtered data. Assuming that the functional relationship exists among similarity and positional accuracy of GPS traces, and it can be described as:
Sim
f
(5) Where Sim represents the similarity and ε indicates the positional accuracy. Then the threshold of trajectory filtering is displayed as:
Threshold
f
(6) The parameter ξ is the expected precision, ξ =1 m, 2m, …, h m, h<1 .
In particularly, to figure out the relation of Sim and ε, we use the similarity evaluation model to compute the similarity between the GPS measurements and its ground truth, and then carry on linear regression analysis of the similarity and the GPS measurements error. After much investigation, the functional relationship between similarity and positional accuracy was an exponential model. So the equation ‘6’ is redefined as:
aSim
f
be
c
(7) The parameters b, a, c of equation ‘7’ are determined by the positional accuracy of experimental data and the weight of distance and heading of similarity model. At the same time, the threshold of trajectory filtering is displayed as:
aThreshold
f
be
c
(8)
3. EXPERIMENTAL RESULTS AND ANALYSIS In this section we perform an extensive experimental evaluation of the method introduced in Section 3 on the real-world mobility datasets.
3.1 Experimental data
We experimented with real trajectory data sets: the vehicle movement data set. It was collected by shuttle vehicles in Wuhan. Each shuttle vehicle was equipped with a GPS logger and Inertial Measurement Unit (IMU) that recorded two kinds of traces, GPS traces based on the GPS single-point positioning technique and its synchronized DGPS traces based on differential global positioning technology. This need to be stressed that one GPS point corresponds to a DGPS point and they all display the position of moving object with different positional accuracy. The positional accuracy of the GPS and DGPS data in urban area was about 10-15 m and 0.05 m respectively. The sampling rate for these data was 1 s. The data collection period for the shuttle vehicles was seven days. We obtained about 90 thousand GPS and DGPS points, shown in figure 8
DGPS( positional accuracy: 0.05 m) GPS (positional accuracy: 10-15 m)
Figure 5. The collection of DGPS trajectories and synchronized GPS trajectories.
In a follow-up experiment, the low-precision GPS traces in data set will be regarded as the experimental data, and its synchronized high-precision DGPS traces will be considered as ground truth to validate the effectiveness of the partition-and-filter model.
3.2 Visual results
In this section, we randomly selected a part of trajectories as the experimental data to present the filtered results according to partition-and-filter model.
The experimental traces (Figure 6a) were partitioned according to PPAC algorithm first, and a set of characteristic points were acquired, shown in Figure 6b. Specifically, the constants α and
β were set as 25 m and 30⁰ according to our demands, and the partitioning termination threshold ao and do of each trace was different so we would not introduce them one by one. After trace partitioning, the characteristic points of a trajectory were clustered as outliers because the location or angle of these points were very different from other points. The sub-trajectories without characteristic points were regarded as raw data and to be classified based on TFRA algorithm.
(a) (b)
Figure 6. Trajectory partitioning based on PPAC. (a) is the raw GPS points. (b) shows the final result of PPAC where red points and black points present raw GPS points and characteristic
points respectively.
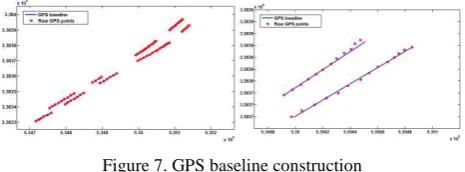
The main operators of the TFRA algorithm included GPS baseline construction, similarity evaluation and filtering threshold determination. The GPS baseline of sub-trajectory was constructed by using RANSAC method, and the direction of GPS baseline was same as the moving direction of the sub-trajectory, as shown in figure 7. During GPS baseline construction by using RAσSAC, the parameter was set as 0.5 m according to the precision requirement and other parameters like N was self-adaptive.
Figure 7. GPS baseline construction
In this study, we think that the GPS baseline represents the actual position of moving object to some extent, and the more
similar the GPS points of a sub-trajectory with its GPS baseline, the more accurate the GPS points will be. So TFRA uses similarity evaluation model to compute the similarity between GPS points and its GPS baseline. Particularly, after much trial and error, the weight of distance and angle of the similarity evaluation model was set as 0.98 and 0.02 respectively. In addition, the similarity threshold of trajectory filtering was decided by the expected precision of filtered data. The functional relationship between similarity and positional accuracy obeyed exponential model. Based on extensive testing, the entire correlation coefficient of exponential regression can reach the highest R=0.946 when the parameter a, b, c of the exponential model for GPS traces with 10-15 m accuracy are equal to 1, -0.267, 0, respectively. The corresponding similarity threshold of the expected precision of filtered data was calculated as shown in table 2.
Expected precision: ξ (m) Similarity Threshold
1 0.7657
2 0.5863
3 0.4489
4 0.3437
5 0.2632
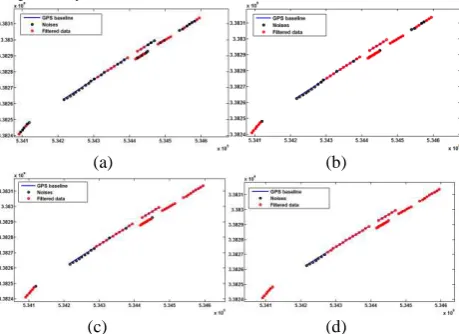
Table 2. The filtering threshold with different expected accuracy According to table 1, we set different similarity threshold to filter data from raw GPS traces. Figure 8 shown the filtered results of a part of GPS points with 1 m (figure 8a), 3 m (figure 8b), 5 m (figure 8c), 7 m (figure 8d) positional accuracy respectively.
(a) (b)
(c) (d)
Figure 8. The filtering results with different expected accuracy The number of experimental points and filtered points is displayed in figure 8, the results show that the proportion of filtered data will fall as the expected precision increased.
3.3 Experimental results analysis
To estimate the performance of the partition-and-filter model in data filtering, two factors are indispensable part of it: the first factor is that all GPS data collected from different roads in urban area are regarded as the experimental data to evaluate the robustness of partition-and-filter model; the second factor emphasizes the analysis of positional accuracy and precision distribution of filtered data, and demonstrates the validity of partition-and-filter model.
There are about 90 thousands GPS points collected in urban area as the experimental data. Compared with the ground truth, the average value and standard deviation of positional accuracy
of the experimental data are about 5.12 m and 4.13 m respectively.
(a) (b) Figure 9. The filtering results
By using partition-and-filter model, we got the final results of partition and filtering. Figure 9(a) and (b) show the partition results of all GPS points based on PPAC algorithm and filtered results of all sub-trajectories based on TFRA algorithm. The details of the experimental results can be seen in the child window of the figure 9.
Expected precision: ξ
(m)
Proportion of filtered
data (%)
Average value of GPS errors
(m)
Standard deviation of
GPS errors (m)
1 31.58 1.2 0.92
2 47.62 2.05 0.91
3 58.67 2.78 1.02
4 67.30 3.41 1.73
5 74.48 3.89 1.79
Table 3. The precision of filtered data
To estimate the validity of partition-and-filter model, the positional accuracy of filtered data was calculated according to its ground truth. Table 3 shows the average value and standard deviation of positional accuracy of the filtered data from different roads in urban area. Based on the statistics, the average value and the standard deviation of positional accuracy of filtered data indicated that the partition-and-filter model could indeed filter GPS traces according to the expected precision. At the same time, the average value of positional accuracy of filtered data increased when the expected precision was fall as well as the standard deviation of positional accuracy.
4. CONCLUSION
In this paper, we have proposed a novel framework, the partition-and-filter model for data quality management of crowdsourcing big trace data. Based on this framework, we have developed the trajectory partition algorithm, PPAC, and the trajectory filtering algorithm, TFRA. The main advantage of PPAC is the adaptive partitioning termination threshold technique. The partition results show that PPAC effectively segments trajectory according to its shape complexity. Besides, TFRA algorithm also provides a new understanding of trajectory filtering which classifies crowdsourcing big trace data based its positional accuracy. Overall, we believe that we have provided a new paradigm in trajectory quality management.
REFERENCES
Bradford, P. W., Spilker, J., & Enge, P., 1996. Global positioning system: theory and applications. AIAA Washington DC, 109.
Zhou, B., Li, Q., Mao, Q., Tu, W., Zhang, X., & Chen, L., 2015. ALIMC: Activity landmark-based indoor mapping via crowdsourcing. Intelligent Transportation Systems, IEEE Transactions on, 16(5), pp. 2774-2785.
Saha, B., & Srivastava, D., 2014. Data quality: The other face of big data. In Data Engineering (ICDE), 2014 IEEE 30th International Conference on IEEE, pp. 1294-1297.
Castro, P. S., Zhang, D., & Li, S., 2012. Urban traffic modelling and prediction using large scale taxi GPS traces. In Pervasive Computing (pp. 57-72). Springer Berlin Heidelberg.
Chen, Y.H.; Krumm, J., 2010. Probabilistic modelling of traffic lanes from GPS traces. In Proceedings of the 18th SIGSPATIAL International Conference on Advances in Geographic Information Systems, San Jose, CA, USA, 2–5 November 2010.
Gupta, Manish, et al., 2014. Outlier detection for temporal data. Synthesis Lectures on Data Mining and Knowledge Discovery, 5(1), pp. 1-129.
Samimi, H., Schäfer, M., Artzi, S., Millstein, T., Tip, F., & Hendren, L., 2012. Automated repair of HTML generation errors in PHP applications using string constraint solving. In Proceedings of the 34th International Conference on Software Engineering (pp. 277-287). IEEE Press.
Krishnan, S., Garg, A., Patil, S., Lea, C., Hager, G., Abbeel, P., & Goldberg, K., 2015. Transition state clustering: Unsupervised surgical trajectory segmentation for robot learning. In International Symposium of Robotics Research. Springer STAR. Lee, J. G., Han, J., & Whang, K. Y., 2007. Trajectory clustering: a partition-and-group framework. In Proceedings of the 2007 ACM SIGMOD international conference on Management of data (pp. 593-604). ACM.
Lee, J. G., Han, J., & Li, X., 2008. Trajectory outlier detection: A partition-and-detect framework. In Data Engineering, 2008. ICDE 2008. IEEE 24th International Conference on (pp. 140-149). IEEE.
Tang, L., Yang, X., Kan, Z., & Li, Q., 2015. Lane-Level Road Information Mining from Vehicle GPS Trajectories Based on Naïve Bayesian Classification. ISPRS International Journal of Geo-Information, 4(4), 2660-2680.
Tang, L., Kan, Z., Zhang, X., Sun, F., Yang, X., & Li, Q., 2015. A network Kernel Density Estimation for linear features in space–time analysis of big trace data. International Journal of Geographical Information Science, pp. 1-21.
Masciari, E., Shi, G., & Zaniolo, C. (2013). Trajectory Data Pattern Mining. In New Frontiers in Mining Complex Patterns (pp. 51-66). Springer International Publishing.
Rasetic, S., Sander, J., Elding, J., & Nascimento, M. A., 2005. A trajectory splitting model for efficient spatio-temporal indexing. In Proceedings of the 31st international conference on Very large data bases (pp. 934-945). VLDB Endowment. Wang, J., Rui, X., Song, X., Tan, X., Wang, C., & Raghavan, V., 2015. A novel approach for generating routable road maps from vehicle GPS traces. International Journal of Geographical Information Science, 29(1), pp. 69-91.
Tu, W., Li, Q., Fang, Z., & Zhou, B., 2015. A Novel Spatial-Temporal Voronoi Diagram-Based Heuristic Approach for Large-Scale Vehicle Routing Optimization with Time Constraints. ISPRS International Journal of Geo-Information, 4(4), pp. 2019-2044.
Tu, W., Li, Q., Fang, Z., Shaw, S. L., Zhou, B., & Chang, X., 2015. Optimizing the locations of electric taxi charging stations: A spatial–temporal demand coverage approach. Transportation Research Part C: Emerging Technologies.
Yu, Y., Cao, L., Rundensteiner, E. A., & Wang, Q., 2014. Detecting moving object outliers in massive-scale trajectory streams. In Proceedings of the 20th ACM SIGKDD international conference on Knowledge discovery and data mining (pp. 422-431). ACM.
Zhang, L., & Wang, Z., 2011. Trajectory Partition Method with Time-Reference and Velocity. JCIT, AICIT, 6(8), pp. 134-142.