POST-MISSION QUALITY ASSURANCE PROCEDURE FOR SURVEY-GRADE
MOBILE MAPPING SYSTEMS
A. P. Kerstinga,*, P. Friessa a
Teledyne Optech, 300 Interchange Way - Vaughan, Ontario, Canada, [email protected], [email protected]
Commission I, ICWG I/V-A
KEY WORDS: MMS, lidar, accuracy, trajectory errors, system calibration, quality assurance
ABSTRACT:
Mobile Mapping Systems (MMS) consist of terrestrial-based moving platforms that integrate a set of imaging sensors (typically digital cameras and laser scanners) and a Position and Orientation System (POS), designed to collect data of the surrounding
environment. MMS can be classified as “mapping-grade” or “survey-grade” depending on the system’s attainable accuracy. Mapping-grade MMS produce geospatial data suitable for GIS applications (e.g., asset management) while survey-grade systems should satisfy high-accuracy applications such as engineering/design projects. The delivered accuracy of an MMS is dependent on several factors such as the accuracy of the system measurements and calibration parameters. It is critical, especially for survey-grade systems, to implement a robust Quality Assurance (QA) procedure to ensure the achievement of the expected accuracy. In this paper, a new post-mission QA procedure is presented. The presented method consists of a fully-automated self-calibration process that allows for the estimation of corrections to the system calibration parameters (e.g., boresight angles and lever-arm offsets relating the lidar sensor(s) to the IMU body frame) as well as corrections to the system measurements (e.g., post-processed trajectory position and orientation, scan angles and ranges). As for the system measurements, the major challenge for MMS is related to the trajectory determination in the presence of multipath signals and GNSS outages caused by buildings, underpasses and high vegetation. In the proposed self-calibration method, trajectory position errors are properly modelled while utilizing an efficient/meaningful trajectory segmentation technique. The validity of the proposed method is demonstrated using a dataset collected under unfavorable GNSS conditions.
1. INTRODUCTION
Mobile mapping systems (MMS) have emerged as a cost-effective method for the rapid collection of geospatial information of the surrounding environment to satisfy the needs
of several applications. “Mapping-grade” and “survey-grade” are designations commonly used to distinguish between different mobile systems depending on their attainable accuracy/potential applications (Hauser, 2013). Mapping-grade systems have lower cost, since they usually utilize lower-accuracy inertial measurement unit (IMU) and laser scanners and are mainly designed to deliver data suitable for lower-accuracy applications, such as asset management. Note that some mapping-grade systems available in the market, such as the Teledyne Optech Lynx MG system, utilize high-end laser scanners. Survey-grade systems, on the other hand, utilize high-end IMU and laser scanners, and are designed for high-accuracy applications such as engineering/design projects (e.g., Teledyne Optech Lynx SG and SG-S systems).
The implementation of a robust Quality Assurance (QA) procedure is critical, especially for survey-grade systems. Quality can be defined as the compliance of a product with the specification requirements. For spatial data acquisition systems, the most important product requirement is the accuracy, which is also the most complex one to achieve and validate. QA mainly deals with processes to ensure the achievement of the
procedures followed, the attainment of the required accuracy for survey-grade applications may not be possible if robust post-mission QA procedures are not implemented.
The accuracy of the point cloud derived from a lidar system depends on random and systematic errors in the system measurements and parameters. The magnitude of the random
errors depends on the accuracy of the system’s measurements, which include the scanner angles and ranges as well as the position and orientation information from the GNSS/INS integration process. Systematic errors, on the other hand, are mainly caused by biases in the parameters relating the system components (boresight angles and lever-arm offsets relating the lidar sensor(s) to the IMU body frame) as well as biases in the system measurements (e.g., position and orientation information, scan angles and ranges). For airborne lidar systems, extensive error analysis has been carried out by several authors (e.g., Huising and Pereira, 1998; Baltsavias, 1999; Schenk, 2001; Csanyi, 2008; Kersting, 2011). For mobile lidar systems, on the other hand, less research work in this regard can be found (e.g., Alshawa et al., 2007; Glennie, 2007; Leslar et al., 2014).
The parameters relating lidar system components (i.e., the system mounting parameters) consist of the boresight angles and lever-arm offsets relating the lidar sensor(s) and the IMU
measurements (mirror angles and ranges) are provided by the system manufacturer. The initial values for the mounting parameters should be refined through an in-field system calibration process. Biases in some of the parameters associated with the lidar unit measurements should also be estimated in the calibration process, especially for airborne systems (in-flight calibration), e.g., mirror angle scale, and range offsets (Shenk, 2001; Csanyi, 2008; Kersting, 2011).
In order to achieve the potential accuracy of a lidar system, a rigorous system calibration needs to be implemented. Calibration procedures for the estimation of biases in the system parameters and in the laser unit measurements have been proposed by several authors for airborne lidar systems (Burman, 2000; Filin, 2001; Morin, 2002; Toth, 2002; Skaloud and Lichti, 2006; Friess, 2006; Kersting, 2011) and in a reduced number for mobile lidar systems (Rieger et al., 2010; Picard et al., 2012; Chan et al., 2013).
For mobile systems, the major challenge in attaining survey-grade accuracy is related to the platform trajectory due to the deterioration of the GNSS conditions by multipath effects and by shading of the signals caused by buildings, trees and underpasses. Therefore, a procedure to optimize the post-processed trajectory position can play a significant role.
Piecewise polynomial modeling has been frequently used to model platform trajectories as a function of time for photogrammetric systems (McGlone and Mikhail, 1981; Lee et al., 2000). To avoid the instability of high-order polynomial models, the piecewise model is usually used where the complex trajectory is split into segments, with each section having its own set of low-order polynomials coefficients. In many practical systems, a linear shift-drift model is used. Continuity constraints are often implemented at the segment boundaries to ensure smooth transition across the boundaries.
In this paper, a novel post-mission QA procedure for MMS is introduced for accuracy optimization. The procedure consists of a self-calibration process that allows for the estimation of corrections to the system parameters as well as to the post-processed trajectory position and orientation information. The self-calibration procedure, which was first introduced in Friess (2006) for airborne lidar systems and further developed into a commercially available software tool (LMS Pro – Lidar Mapping Suite Professional) in 2010, is further extended to allow for the calibration of the Lynx mobile lidar systems. For trajectory position corrections, a piecewise polynomial model is devised for mobile lidar systems while introducing a meaningful method for trajectory segmentation.
The paper was structured as follows. First, the lidar system geometric model is described. Then, the proposed post-mission QA method is outlined followed by results using a dataset collected under challenging GNSS conditions. Finally, conclusions and recommendations for future work are presented.
2. LIDAR SYSTEM GEOMETRIC MODEL
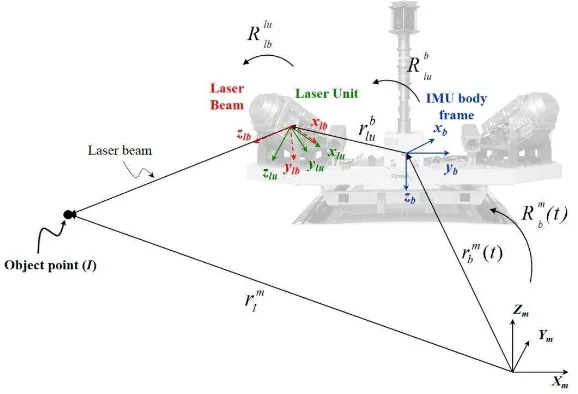
The lidar system geometric model expresses the mathematical relationship between the lidar point coordinates, the system parameters, and measurements. More specifically, the position of the mapped point (I) is written as a function of the system parameters and measurements. This mathematical relationship, which is presented in equation (1), can be derived through the summation of the vectors illustrated in Figure 1 (rbm(t),rlub,andrIlb(t)), after applying the rotation matrices (Rbm(t),Rlub,andRlblu(t)). In this equation, rbm(t)is the vector from the origin of the ground reference frame to the origin of the IMU coordinate system (trajectory position),
) the GNSS/INS integration process in consideration of the lever arm offset between the IMU body frame and the phase center of the GPS antenna. The term Rbm(t) stands for the rotation matrix relating the ground and IMU coordinate systems (trajectory orientation), which is derived through the GNSS/INS integration process. The term Rlub represents the rotation matrix relating the IMU and laser unit coordinate systems, which is
Equation (2) includes the corrections to the trajectory position ) through the post-mission quality assurance procedure (calibration process). The International Archives of the Photogrammetry, Remote Sensing and Spatial Information Sciences, Volume XLI-B1, 2016
Figure 1. Involved quantities in the lidar system geometric model
3. POST-MISSION QUALITY ASSURANCE PROCEDURE – LYNX LMS PRO
In this work, the self-calibration procedure introduced by Friess (2006) for airborne systems has been extended for Lynx mobile systems (LMS Pro). The self-calibration process consists of a block adjustment using overlapping lidar data collected by different coverage passes/sensors and control information if available. Correspondence among overlapping coverage passes is established using tie planes. The use of higher order features, such as planar surfaces and/or linear features, when dealing with lidar surfaces is necessary due to the irregular nature of the data, where point-to-point correspondence cannot be established. The identification of conjugate planes is quite independent of the point density and facilitates automation.
In the next subsections, the self-calibration methodology is described along with the implemented trajectory corrections model.
3.1 Self-Calibration Methodology
At the start of the self-calibration process, planar features are extracted per sensor and per coverage pass using an automated plane segmentation method. The correspondence between the identical planes in the overlapping areas is then automatically established. Based upon some pre-defined criteria, tie planes are selected for parameter estimation through a rigorous least-squares adjustment procedure. Each ith laser point (xi,yi,zi) of the jth tie-plane will provide one observation equation in the form shown in (3), where the lidar points are expressed using the rigorous lidar geometric model presented in equation (2). The lidar points should lie on a common plane if appropriate corrections to the system parameters and measurements are estimated.
nX,jxinY,jyinZ,jzid0 (3)
3.2 Trajectory Corrections Model
As already mentioned, for mobile mapping systems the ability to estimate corrections to the post-processed trajectory is quite important in order to achieve the required accuracy for certain applications.
In the proposed self-calibration process, corrections to the trajectory position,rbm(t), and orientation,Rbm(t), can be estimated. For trajectory position corrections, a piecewise polynomial model with time as the independent variable, is implemented. Second-order polynomial corrections have been chosen, allowing for the recovery of offset, drift and acceleration coefficients, as shown in equation (4).
() t2
The use of a low-order polynomial model is preferable to avoid instability in the adjustment process. However, one polynomial model will not fit the complete trajectory. Therefore, the trajectory needs to be segmented prior to parameter estimation. In the proposed self-calibration process, the trajectory is segmented according to position accuracy. Figure 2 shows the trajectory segmentation functionality available in Lynx LMS Pro. Each laser-on interval is automatically segmented if the RMS jump is larger than a predefined threshold. The segments can also be manually edited if needed.
Figure 2. Trajectory segmentation based on position accuracy.
In order to ensure continuity at the segments’ transition zones,
two constraints are implemented. The first constraint ensures that the corrections computed for neighboring segments is equal at their boundaries. The second continuity constraint enforces the slope, or first-order derivative of the correction function, to be the same at the segments’ transition zones.
Control information, which is required for the estimation of trajectory corrections and absolute accuracy validation, can be easily incorporated in the block adjustment. In Lynx LMS Pro, the user has the flexibility to select the type of control information that is most appropriate for the characteristics of project area (or a combination of both): (a) control points located on planar surfaces and (b) control targets. Control points on planar surfaces are ideal for project areas where there is an abundance of vertical and horizontal surfaces. This type of control information is straightforward to collect and allows for complete automation. Since it does not need to be identified in the lidar point cloud, it can be collected before or after the survey. However, it is very important to note that, in order to improve the absolute accuracy in all three coordinate directions, it is necessary to have control points on both horizontal and vertical planes with different orientations. Control targets can be used in addition to control points on planes. Such targets represent an import supplement in areas without significant planar geometry since they work as full control points that contribute to the estimation of both horizontal (X and Y directions) and vertical (Z direction) corrections.
4. RESULTS
To demonstrate the validity/robustness of the introduced post-mission QA procedure, a real dataset has been collected under unfavourable/challenging GNSS conditions. Figure 3 displays a plot with the trajectory RMSTOTAL for one of the laser-on intervals of the mission. One can note very high RMS values (up to 30 cm) in one of the laser-on intervals due to GNSS signal outages. The availability of control points along this trajectory interval is shown in blue at the bottom. This figure also illustrates how this interval has been split for the estimation of corrections for each of the defined segments (ensuring homogeneous distribution of control points).
Figure 3. Trajectory segmentation based on GNSS position quality.
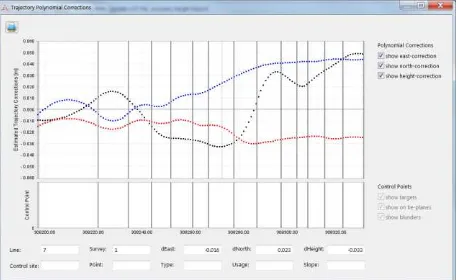
In order to produce a dataset with the required accuracy, the self-calibration process was performed. A block adjustment using tie planes and the surveyed ground control points was carried out to estimate the trajectory position corrections (second-order polynomial coefficients) for the defined segments as well as corrections to the boresight angles. Figure 4 illustrates the estimated corrections, demonstrating the flexibility of the polynomials, i.e., how well they can follow the errors in the trajectory and how smooth they are at the transition points.
Figure 4. Trajectory polynomial corrections ensuring smooth transition zones.
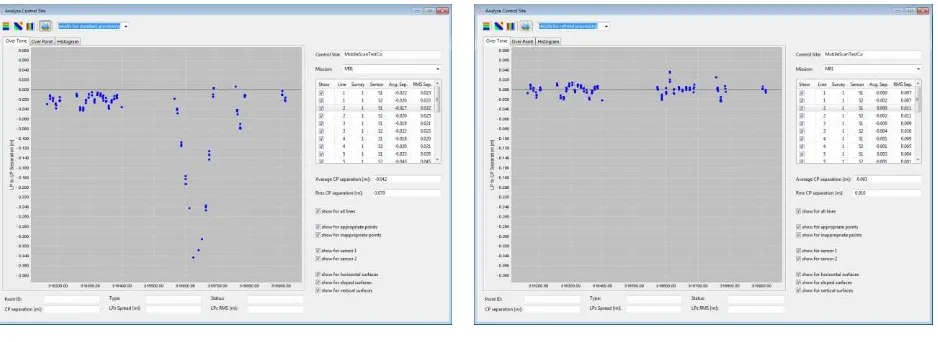
The assessment of the compatibility of the lidar data with the control points over time and in the form of a histogram is illustrated in Figures 5 and 6, respectively, before and after performing the post-mission QA procedure. Significant improvement can be observed after the post-mission QA, demonstrating the effectiveness of the method. One can note that an RMS of 1 cm was achieved for the control point to laser point separation, which is quite remarkable given the fact that control points are not measured with accuracy better than 1 cm. Therefore, a significant fraction of the 1-cm RMS can be attributed to the accuracy of the control points themselves. The International Archives of the Photogrammetry, Remote Sensing and Spatial Information Sciences, Volume XLI-B1, 2016
(a) (b)
Figure 5. Separation between lidar data and control points over time before (a) and after (b) the post-mission QA procedure.
(a) (b)
Figure 6. Separation between lidar data and control points in the form of a histogram before (a) and after (b) the post-mission QA procedure.
5. CONCLUSIONS AND RECOMMENDATIONS FOR FUTURE WORK
This paper has discussed the importance of performing a post-mission QA procedure for the achievement of the required data quality, especially for high-accuracy applications. A fully-automated self-calibration process for the estimation of corrections to system parameters and measurements has been introduced for mobile mapping systems. The validity of the discussed procedure has been demonstrated through results using real data collected under challenging GNSS conditions. Significant improvement could be observed after performing the proposed self-calibration process. Future work will focus on more testing using real datasets to come up with recommendations in terms of number/distribution of control points for the estimation of trajectory position corrections under different GNSS conditions.
REFERENCES
Baltsavias, E., 1999. Airborne laser scanning: existing systems and firms and other resources, ISPRS Journal of Photogrammetry and Remote Sensing, 54(2-3), pp. 164–198. Burman, H., 2000. Calibration and Orientation of Airborne Image and Laser Scanner Data Using GPS and INS, Ph.D. dissertation, Royal Institute of Technology, Stockholm, 125p. Chan, T., D. Lichti and C. Glennie, 2013. Multifeature based boresight self-calibration of a terrestrial mobile mapping system, ISPRS Journal of Photogrammetry and Remote Sensing, 82, pp. 112-124.
Csanyi, N., 2008. A Rigorous Approach to Comprehensive Performance Analysis of State-of-the-Art Airborne Mobile Mapping Systems, Ph.D. dissertation, The Ohio State University, 217 p.
Filin, S., 2001. Calibration of Spaceborne and Airborne Laser Altimeters Using Natural Surfaces, Ph.D. dissertation, The International Archives of the Photogrammetry, Remote Sensing and Spatial Information Sciences, Volume XLI-B1, 2016
Friess, P., 2006. Toward a rigorous methodology for airborne laser mapping, Proceedings of EuroCOW, Castelldefels, Spain, unpaginated CD-ROM.
Glennie, C. 2007. Rigorous 3D error analysis of kinematic scanning LIDAR systems, Journal of Applied Geodesy, 1(3), pp. 147–157.
Hauser, D. L., 2013. Three-Dimensional Accuracy Analysis of a Mapping-Grade Mobile Laser Scanning System, MSc dissertation, University of Houston, Department of Civil & Environmental Engineering, 94p.
Kersting, A. P., 2011. Quality Assurance of Multi-Sensor Systems, Ph.D. dissertation, University of Calgary, Department of Geomatics Engineering, Calgary, AB, 265 p.
Lee C., H. J. Theiss, J. S. Bethel, and E. M. Mikhail, 2000. Rigorous mathematical modelling of airborne pushbroom imaging systems, Photogrammetric Engineering and Remote Sensing, 66(4), pp.385-392.
Leslar M., B. Hu, J.G. Wang, 2014. Error Analysis of a Mobile Terrestrial LiDAR System, Geomatica, 68(3), pp. 183-194. McGlone, J. C., and E. M. Mikhail, 1981. Photogrammetric Analysis of Aircraft Multispectral Scanner Data, Technical Report, School of Civil Engineering, Purdue University, West Lafayette, Indiana, 178 p.
Picard, A., T. Touze, N. Seube, J.G. Nistad and M. Rondeau, 2012. Calibration of Vessel Mounted LiDAR, Proceedings of the Canadian Hydrographic Conference, May 15th to 17th, Niagara Falls, Ontario, Canada.
Rieger, P., N. Studnicka, M. Pfennigbauer and G. Zach, 2010. Boresight alignment method for mobile laser scanning systems. Journal of Applied Geodesy, 4(1), pp. 13–21.
Schenk, T., 2001. Modeling and Analyzing Systematic Errors in Airborne Laser Scanners, Technical Report in Photogrammetry No. 19, Ohio State University.
Skaloud, J., and D. Lichti, 2006. Rigorous Approach to Bore-Sight Self-Calibration in Airborne Laser Scanning, ISPRS Journal of Photogrammetry and Remote Sensing, 61: 47–59.