ACCURACY COMPARISON OF VHR SYSTEMATIC-ORTHO SATELLITE IMAGERIES
AGAINST VHR ORTHORECTIFIED IMAGERIES USING GCP
E. Widyaningruma, M. Fajaria, J. Octariadya*
a
Geospatial Information Agency (BIG), Cibinong, Indonesia - (elyta.widyaningrum, marda.khoiria, jali.octariady)@big.go.id
Commission I, WG I/4
KEY WORDS: VHR systematic-ortho, orthorectified image, GCP, DEM, accuracy
ABSTRACT:
The Very High Resolution (VHR) satellite imageries such us Pleiades, WorldView-2, GeoEye-1 used for precise mapping purpose must be corrected from any distortion to achieve the expected accuracy. Orthorectification is performed to eliminate geometric errors of the VHR satellite imageries. Orthorectification requires main input data such as Digital Elevation Model (DEM) and Ground Control Point (GCP). The VHR systematic-ortho imageries were generated using SRTM 30m DEM without using any GCP data. The accuracy value differences of VHR systematic-ortho imageries and VHR orthorectified imageries using GCP currently is not exactly defined. This study aimed to identified the accuracy comparison of VHR systematic-ortho imageries against orthorectified imageries using GCP. Orthorectified imageries using GCP created by using Rigorous model. Accuracy evaluation is calculated by using several independent check points.
1. INTRODUCTION
The use of very high resolution satellite imageries for large-scale mapping (1: 5000) provides many advantages over the use of aerial photography related to costs and area coverage. Before using them to develop large-scale maps, the very high-resolution satellite imagery should be geometrically corrected. Most of geometric correction implemented by orthorectification. The orthorecification processes requires the Digital Elevation Model (DEM) data and Ground control Point (GCP) data acquired from the field survey.
Previous published papers confirms that the difference in accuracy DEM (Barazzetti, et al., 2010; Ayhan, et al, 2006) and different numbers of GCP (Lee, et al, 2008; Murthy, et al, 2008; Toutin and Cheng, 2002) will affect the results (orthorectified image).
Currently in Indonesia, the usage of systematic (semi-automatic) orthorectification is increasing due to its cost-effective and its simple-rapid method of ortho imageries for many practical purposes for national development, such as infrastructure developments and regional development planning. Thus, it is necessary examine the benefits value of the systematic-ortho method compared to its accuracy result. This paper discuss comparison of the accuracy of very high resolution (VHR) systematic-ortho imageries against orthorectified imageries using GCP data in tropical region. The VHR systematic-ortho imageries is refers to satellite imageries which semi-automatically ortho-rectified by using DEM data only without using any GCP data. Meanwhile, the orthorectified imageries is rectified by using Terrasar-X DEM and GCP
2. STUDY AREA
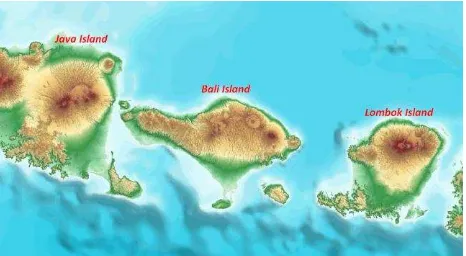
The selected research area of this paper is Bali Island of Indonesia (803’26”S–8051’1”S and 114025’59”E– 115042’40”E). Bali Island is located in between Lombok Island and Java Island (figure 1). Bali Island is about ±5591 km2 and surrounded by beautiful tropical beaches. This island has various topography between 0 – 2577m of MSL with flat area in
the southern part and mountainous area in the middle and northern part of the island.
Figure 1. Location of study area in Bali Island
Bali Island has the famous island and tourism industries in Indonesia and in the world. The undergoing rapid development in Bali mainly to facilitate domestic and foreign tourists needs during their visit. This situation resulting many new building and road accesses throughout the island providing accessibility during GCP measurement and easyness in image interpretation.
3. DATA
There are three main data used in this study namely Satellite Imageries, Digital Elevation Model and Ground Control Point.
3.1 Satellite Imageries
Variety of the very high resolution satellite imageries sensors are used to produce the ortho-mosaicked imageries to cover the entire Bali mainland area consist of Pleiades, WorldView-2, WorldView-3, and GeoEye. The total number of images are 57 scenes which consists of 17 scenes Pleiades imageries with 0.5m spatial resolution, 22 scenes WorldView-2 imagery with 0.5m spatial resolution, 15 scene WorldView-3 imageries with 0.3m spatial resolution, and 3 scenes GeoEye imageries with a
spatial resolution of 0.46m. There are many overlap images for certain areas (figure2).
Figure 2. 57 scene satellite imagery coverage Bali Island
The product level of Pleiades sensor is in Primary while the other satellite sensors are in Ortho-Ready Standard (OR2A) level. The satellite imageries data used in this research has the incident angle less than 20 degree while the acquisition year are varies between 2013 to October 2015.
3.2 Digital Elevation Model
There are 2 type of DEM data used in this research study namely SRTM DEM 30 meters resolution and TerraSAR-X DEM (figure 3). TerraSAR-X DEM is produced from satellite TerraSAR X-band sensor, so objects on the surface of the earth is still served at Digital Surface Model (DSM). DEM TerraSAR-X has a spatial resolution of 9m with vertical accuracy between 7 to 9m in some parts of Bali.
(a) (b)
Figure 3. Visualization for Terrasar X DEM (a) and SRTM DEM 30m (b)
SRTM DEM data generated from Shuttle Radar Topography Mission (SRTM) which are used in this research has a spatial resolution of 30m with vertical accuracy better than ± 16m. The height reference system is on Earth Gravitational Model 1996 (EGM 96).
3.3 Ground Control Point
The GCP data are acquired through field works by using geodetic GPS dual frequency and static measurement method. The interval of time observation for each GCP is 1 hour. There are 103 points used for orthorectification processing for the whole Bali Island which distribute evenly. Each GCP is located on an object that easily identified in the image and in the field, usually it located in the corner of identified object and have high contrast. These objects mainly artificial objects, such as corner of street, bridges or fences, the corner of water drainage, volleyball court, swimming pool, etc (figure 4). There are parts of the study area has less dense of GCP distribution, mostly forest coverage area, due to limited road accesses and located in remote area or private places.
Figure 4. GCP and ICP field measurement in various object
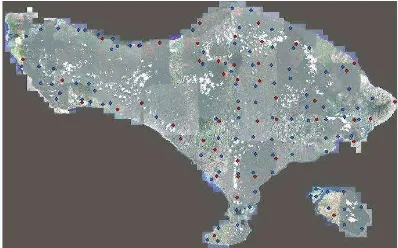
Besides the GCPs, we prepared 46 Independent Check Point (ICP) measured through GPS surveys during the field work. The ICPs are used to calculate the accuracy of the VHR systematic-ortho imageries and orthorectified imageries using GCP results. Figure 5 shows the distribution of GCP and ICP in entire study area. The blue point represents the GCP, while the red point represents the ICP.
Figure 5. Distribution GCP and ICP in Bali Island
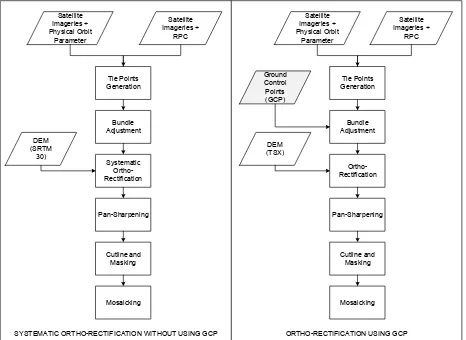
4. METHODOLOGY
The orthorectification for both systematic orthorecification and orthorectification using GCP are conducted by using two different algorithm methods namely rigorous models and approximation model for different satellite sensor data. Orthorectified imagery using Rigorous models methods is implemented for Pleiades imageries. Rigorous models are being performed for data which contain the information about the geometry of the sensor (physical orbit parameter) during satellite data recording. The approximation models method is used for WorldView-2, WorldView-3 and GeoEye imageries. This method used the RPC data of the related satellite imageries. The RPC data provides the polynomial coefficient information to build correlation between pixels in the image and object in the ground locations (Parcharidis, et al, 2005). During the bundle adjustment process, the tie points between overlapping imageries are generated with the maximum residu
for X is 0.940 pixels and for Y is 0.990 pixels. The final result of the this process are ortho-mosaicked imageries of Bali Island with GCP and without GCP.
The VHR systematic-ortho imageries is produced from orthorectification process by using SRTM DEM 30m only.
4.2 VHR orthorectified imageries using GCP
Orthorectification is implemented by using DEM from TerraSAR-X data and 103 of GCPs. Instead of having tie points, during the bundle adjustment process, the GCP are also calculated with the maximum residu for X is 0.078 second and for Y is 0.076 second. The residu value is settled by considering the minimum accuracy for the 1:5.000 Topographic map scale which 2.5 metres.
4.3 Geometric Accuracy Assessment
Root Mean Square Error (RMSE) formula can be used to determine the accuracy of the orthorectified image (ASPRS, 1998). equations 1 and 2 are used to determine the RMSE for X and Y coordinate, whereas equation 3 is used to determine the
xi(map) is the coordinate in the specified direction of the i th
check-point in the data set,
xi(surveyed) is the coordinate in the specified direction of the ith check-point in the independent source of higher accuracy, n is the number of checkpoints tested,
i is an integer ranging from 1 to n
Horizontal accuracy analysis performed referring to an accuracy standard that has been recognized or have been implemented by an independent agency of a country. The analysis carried out as a quality control for X and Y coordinates generated in order to guarantee the quality of products produced (FGDC, 1998).
5. RESULTS
The horizontal accuracy of orthorectified image evaluated based on RMSE error value. RMSE error value obtained from the calculation of differences between the coordinates object in the field to the coordinates object in orthoimage. Some 46 ICP was used to evaluate the horizontal accuracy for each image had produced.
5.1 Result for VHR systematic-ortho
Visually, VHR systematic-ortho imageries looks nice and matching for all scene image (figure 7). However, when it was evaluated using 46 check points, on certain part of the image, 4-5m displacements were identified. Table 1 represents the comparison of ICP coordinates acquired from field measurement using GPS Geodetic and VHR systematic-ortho.
Figure 7. Result for VHR systematic-ortho imageries
No. Point DX (m) DY (m)
Table 1. The displacement values that occurs in VHR systematic-ortho imageries
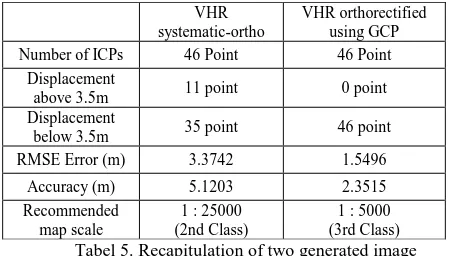
From table 1, it can be seen that some point have displacement more than 4m. Base on calculating the accuracy for 46 ICP, VHR systematic-ortho imageries have 3.374m RMSE value. In 90% confidence interval, thus the accuracy for these imageries is 5,120m. Referenced to the Indonesian base map accuracy standards, VHR systematic-ortho imageries can be used to produces 1: 25000 (2nd class) map scale.
5.2 Result for VHR orthorectified image using GCP
By using exactly the same ICPs, VHR orthorectified imageries using GCP was evaluated. The average displacement resulting
from this ortho imageries are in the range of 0.5-1.5m as shown in Table 2.
Figure 8. Result for VHR orthorectified imageries using GCP
No. Point DX (m) DY (m)
I031 -0.7138 -0.77483
I036 -0.99565 2.168993
I041 -0.49855 0.506804
I104 0.335358 2.177952
I105 -1.87331 -0.46018
I045 -1.23993 -1.58351
I048 -0.9001 0.681672
I071 1.06857 0.07007
I072 1.553792 1.182258
I077 1.561263 -0.43603
Table 2. The displacement values that occurs in VHR ortho imageries using GCP
Table 2 represents points which have nearly equal displacement value in the entire scope of the research studies. The evaluation using 46 ICP shows that VHR orthorectified imageries using GCPs has 1,550m RMSE values with accuracy at 90% confidence interval is 2.351m. Referenced to the Indonesian map accuracy standards, this image then can be used to produce or as reference to 1 : 5000 (3rd class) map scale.
5.3 Accuracy Comparison
Geometric accuracy comparison between VHR systematic-ortho and VHR orthorectified using GCP can be perform by using the same ICPs as shown in Table 3.
No. Point
VHR systematic-ortho VHR orthorectified using GCP
DX (m) DY (m) DX (m) DY (m)
I031 7.3231 -4.9151 -0.7138 -0.7748
I036 3.2121 -4.7503 -0.9956 2.1690
I041 2.8452 5.5823 -0.4986 0.5068
I104 5.5270 5.5099 0.3354 2.1780
I105 6.3057 -3.0027 -1.8733 -0.4602
I045 1.4320 0.6650 -1.2399 -1.5835
I048 0.7527 1.0239 -0.9001 0.6817
I071 1.22291 0.10215 1.06857 0.07007
I072 -1.3837 -0.9584 1.5538 1.1823
I077 -1.1211 0.8124 1.5613 -0.4360
Table 3. Comparison of ICPs coordinate between two mosaicked-ortho image
The accuracy comparison showed significantly different results between VHR systematic-ortho and VHR orthorectified using GCP. The use of GCP and more precision DEM proven to increase the accuracy of orthorectified imagery. Here is the
result from accuracy comparison between VHR systematic-ortho and VHR systematic-orthorectified using GCP:
1. Improved the accuracy significantly
On VHR systematic-ortho, ICP I031 and I104 has a displacement on the X axis by 7.3231m and 5.5270m respectively. The low accuracy of the VHR systematic-ortho caused by inaccuracies of the information satellite ephemeris and attitude. Erroneous information satellite ephemeris and attitude resulted in a significant displacement in the objects on the earth's surface, especially for flat areas. As an illustration, an error 0.01” in recording information in one corner of the orientation sensor WorldView2 satellite imagery at an altitude of 770km will lead to displacement in the image equal to 9.5m in the earth's surface from the position that it should be. The errors that occur on the X axis is greater than the Y axis indicates the satellite conditions inaccurate information on the X axis is big.
The use of GCP in the process of orthorectification made dependent area around the GCP. The presence these bond, the area around the GCP will be controlled. In VHR orthorectified, ICP I031 located close to the GCP G032 and ICP I104 located close to the GCP G062. GCP lead to increased the accuracy in the X-axis at the ICP I031 and I104 be -0.7138m and -0.4986m respectively. Figure 9 shows the appearance ICP I031 and I104 along with nearby GCP.
Figure 9. Location ICP I031 and I104 related with nearby GCP
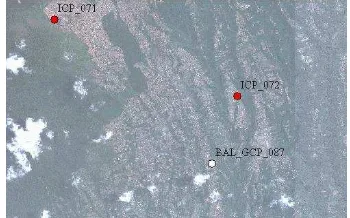
On VHR systematic-ortho, ICP I071 has a displacement by 1.2291m on the X axis and 0.102393m on the Y axis, while ICP I072 has a displacement by 1.38366m on the X axis and -0.958370m on the Y axis. On VHR orthorectified using GCP, ICP I071 has a displacement by 1.06857m on the X axis and 0.07007m on the Y axis and ICP I072 has a displacement by 1.553729m on the X axis and 1.182258m on the Y axis. These ICP located close to the GCP G087 with difference distance on the flat surface topography. ICP located further to the GCP has a larger displacement than the ICP that located closer to GCP. This proves that the closer ICP to GCP, the less displacement occur. Figure 10 shows the appearance of ICP I071 and I072 related to GCP G087.
Figure 10. Location ICP with various distance from GCP
2. Decrease the accuracy.
On VHR systematic-ortho ICP I045 has a displacement by 1.432m on the X axis and 0.665m on the Y axis. However, the comparison results showed displacement in ICP I045 becomes greater in the VHR orthorectified of -1.2399m and -1.5835m respectively. This decrease in accuracy can occur due to various possibilities. The first possibility is a mistake in the identification of objects in the image so wrong in putting the GCP on orthorectification process. The fault in placed GCP on orthorectification process will cause harm in the area around the coordinates of GCP, resulting in deterioration of accuracy in the area around the GCP.
The second possibility is due to the influence of GCP attractions in the vicinity and do not care. ICP I045 was among the GCP G058 and GCP G059. When there are 2 GCP near the ICP, ICP position was influenced by the attraction between the two GCP. When one of the GCP have bad accuracy then the relative position of ICP will be wrong. This is likely occur in ICP 045, so the shift in VHR orthorectified be greater than VHR systematic-ortho. Figure 11 shows the appearance of GCP G058 and G059 related to ICP I045.
Figure 11. Location ICP I045 realted to GCP G058 and G059
Therefore, in order to get good results, GCP had used in the orthorectification process should be identified clearly, firmly, and have minimal relief displacement . This 2 possibility then cause some of ICP on VHR orthorectified using GCP has a greater displacement than VHR systematic-ortho.
Table 5 represents a recapitulation of the geometric accuracy between two generated imageries. Based on the geometric accuracy, the VHR systematic-ortho imageries has very low accuracy and can not be met the large scale maps requirements. It fit to produce the 1: 25000 map scale or smaller map scale. When it used for large scale map production, this image will result in the issue regarding the horizontal accuracy that not appropriate to the map scale accuracy. That mean the map will give the wrong spatial information to the every user who use that map.
Tabel 5. Recapitulation of two generated image
6. CONCLUSION
This research paper found that VHR systematic-ortho imageries has significant different accuracy compared to VHR orthorectified using GCPs. The VHR systematic-ortho imagery
has geometric displacement in the range between 3 to 4 meters. Based on the evaluation of horizontal accuracy, these images can only be used to produce medium-scale base maps in the scale of 1: 25000 and not recommended to be used to produce scale maps of 1: 5000. When it is used to produces large-scale maps, this image will bring the wrong spatial information to the user. Then, the user will use the map that not appropriate in horizontal accuracy as they need. Any users who use the map for spatial planning, such as detailed spatial planning, that should use the large scale base map will produce the bad spatial planning.
GCP had used in the orthorectification process should be identified clearly, firmly, and have minimal relief displacement Using good GCP on orthorectification process may significantly increase the geometric accuracy to fulfill the requirement as an input data for the production of 1: 5000 base map.
REFERENCES
ASPRS, 1998. “ Horizontal Accuracy Reporting for Lidar Data” Federal Geographiic Data Committee Geospatial Positioning Accuracy Standards.
ASPRS, 2014. “ASPRS Positional Accuracy Standards for Digital Geospatial Data” Photogrammetric Engineering & Remote Sensing, 81, pp. A1–A26.
Ayhan, E., Erden, Ö et al, 2006. “Digital Orthophoto Generation with Aerial Photos and Satellite Images and Analyzing of Factors which Affect Accuracy” FIG Congress Photogrammetry and Remote Sensing, 23, pp.0552-0565. Barazzetti, Luigi et al, 2010. “LiDAR Digital Building Models for True Orthophoto Generation”. Applied Geomatics, 2, pp.187-196.
FGDC, 1998. “Geospatial Positioning Accuracy Standars” National Standard for Spatial Data Accuracy.
Lee, T., Jeong, J. H et al, 2008. “Automated Update of Existing Ortho-Image Database and DEM Using High Resolution Satellite Images” XXIst ISPRS Congress Technical Commission I, 37 Part B1, pp. 913-918.
Murthy, Y. V. N. K., Rao, S. S et al, 2008. “Analysis of DEM Generated Using CARTOSAT-1 Stereo Data Over Mausanne Les Alpiles–Cartosat Scientific Appraisal Programme (CSAP TS–5). XXIst ISPRS Congress Technical Commission I, 37 Part B1, pp.1343-1348.
Parcharidis, I., Foumelis, M.et al, 2005. “Orthorectification and assessment of QuickBird imagery using D-GPS measurements over Paros urban area. Proceedings of the International Society for Photogrammetry and Remote Sensing 2005 Joint Conference.
Reuter, H. I., Nelson, A et al, 2007. “An Evaluation of Void Filling Interpolation Methods for SRTM Data International Journal of Geographic Information Science”, 21 Part 9, pp. 983-1000.
Toutin, T. and Cheng, P, 2002. “QuickBird – A Milestone for High Resolution Mapping. Earth Observation Magazine”, 11 no 4, pp. 14-18.