ESTIMATING PM2.5 IN THE BEIJING-TIANJIN-HEBEI REGION USING MODIS AOD
PRODUCTS FROM 2014 TO 2015
Yuenan Li a, *, Jianjun Wang b, Cheng Chen a, Yifei Chen a, Jonathan Li a
a Department of Geography and Environment Management, University of Waterloo, 200 University Avenue West, Waterloo, Ontario N2L 3G1, Canada - (y745li, c226chen, y378chen, junli)@uwaterloo.ca
b Third Institute of Oceanography, State Oceanic Administration, 184 University Road, Xiamen, Fujian 361005, China -
Commission II, Theme Session 17 Smart Cities
KEY WORDS: Air Pollution, PM2.5, MODIS, Aerosol Optical Depth, Geographically Weighted Regression, China
ABSTRACT:
Fine particulate matter with a diameter less than 2.5 μm (PM2.5) has harmful impacts on regional climate, economic development and public health. The high PM2.5 concentrations in China’s urban areas are mainly caused by the combustion of coal and gasoline, industrial pollution and unknown/uncertain sources. The Beijing-Tianjin-Hebei (BTH) region with a land area of 218,000 km2, which contains 13 cities, is the biggest urbanized region in northern China. The huge population (110 million, 8% of the China’s population), local heavy industries and vehicle emissions have resulted in severe air pollution. Traditional models have used 10 km Moderate-resolution Imaging Spectroradiometer (MODIS) Aerosol Optical Depth (AOD) products and proved the statistical relationship between AOD and PM2.5. In 2014, the 3 km MODIS AOD product was released which made PM2.5 estimations with a higher resolution became possible. This study presents an estimation on PM2.5 distributions in the BTH region from September 2014 to August 2015 by combining the MODIS satellite data, ground measurements of PM2.5, meteorological parameters and social-economic factors based on the geographically weighted regression model. The results demonstrated that the 10 km AOD product provided results with a slightly higher accuracy although the 3 km AOD product could provide more information about the spatial variations of PM2.5 estimations. Additionally, compared with the global regression, the geographically weighed model was able to improve the estimation results.
1. INTRODUCTION
Air pollution is a recognized threat to public health and has been globally associated with increasing mortality and morbidity. Currently, the major pollutants include particulates, sulfur oxides, nitrogen oxides, carbon monoxide and ground level ozone. Particulate matter (PM) is a mixture of liquid and solid airborne particles with complex compositions and diameters (Gupta et al., 2006; Lin et al., 2015). PM2.5 is the fine particulate matter with a diameter less than 2.5 μm. The composition of PM2.5 varies due to its source: natural and anthropogenic source. Natural source include sea salt, dust, volcanic eruptions, forest and grassland fires (Beh et al., 2013; Emili et al., 2010), while anthropogenic source include fossil fuel combustion (coal, gasoline and diesel), industrial processes, transportation and uncertain sources (Emili et al., 2010; Wang et al., 2016). Due to its size, PM2.5 can be breathed deeply into lungs and would never come out (Pope III et al., 2000). Long term and short term exposure to PM2.5 has been associated with lung cancer, heart disease and premature deaths (Jones et al., 2015; Kioumourtzoglou et al., 2016; Zanobetti et al, 2015). In addition to the influence on climate change and human health, PM2.5 also brings economic loss. It was also estimated that in the Yangtze River Delta, China, the total economic loss caused by the high concentration of PM2.5 was ¥22.10 billion CNY in 2010 (Wang et al., 2015). Gao and colleagues (2015) assessed that Beijing’s economic loss resulted from the haze in January 2013 was more than $250 million USD.
* Corresponding author
In 2012, PM2.5 was firstly considered as a mandatory monitoring index in the 2012 Chinese Ambient Air Quality Standards (GB3095-2012). The yearly and daily standards are 15 µg/m3 and 35 µg/m3, respectively. Along with implementing policies and standards, the Chinese government also spent significant expense in building more than 1500 ground monitoring stations (79 stations in the Beijing-Tianjin-Hebei region).
Generally, ground-based monitoring data is regarded as an accurate measurement, but it only represents the concentration in a relatively small region. Moreover, the number of ground level
stations is limited and these stations’ distributions are often
sparse and unbalanced, which makes continuous spatial
monitoring difficult (Hu et al., 2013). Apart from the spatial
coverage and resolution, the temporal coverage of ground-level PM monitoring, relying on instrument operation period and functionality, also highly varies (Benas et al., 2013). Moreover, the construction and maintenance of ground-level stations are time-consuming and labor-consuming.
is more, this method costs less to monitor air quality for developing countries or regions which are in lack of ground-level stations but have severe air pollution. Previous studies have shown the correlation between satellite-derived AOD and ground-level PM2.5 concentration by various models (Chu et al.,
2003; Wang, 2005). AOD is a parameter of the extinction of
electromagnetic radiation at a given wavelength (Chudnovsky et al., 2014). AOD can describe how much sunlight is blocked by particles in the whole atmosphere. However, satellite techniques also have shortcomings. The major issue preventing a robust relationship between AOD and PM2.5 is that AOD presents the whole atmospheric aerosol distribution, while ground-level PM2.5 measurements are measured near the Earth’s surface (Benas et al., 2013). Furthermore, due to cloud, snow and ice cover, AOD information cannot always be retrieved from remote sensing instruments, which makes researchers unable to estimate PM2.5 concentrations (Lee et al., 2012).
A few satellite sensors are available for AOD observations such as AVHRR, TOMS, MODIS and MISR. Among these sensors, MODIS, boarded on Terra and Aqua satellite, was the most often used one. In addition, users can use 10km MODIS AOD products provided by NASA instead of retrieving AOD from satellite images themselves. This product has been provided since 2000 and it is based on dark target and deep blue algorithms. In 2014, a new AOD product, with 3 km spatial resolution was released based on only the dark target algorithm and this product provides a chance to predict PM2.5 concentrations in a higher spatial resolution. However, because MODIS 3 km AOD product is still a new product, the performance of this product in estimating PM2.5 needs to be explored.
Various statistical models used to estimate PM2.5 by AOD include the multiple linear regression model (Li et al., 2011), the land use regression model (Kloog et al., 2012), the geographically weighted regression model (Hu et al., 2013), and other models. GWR model is also applied to build a local relationship between AOD and PM2.5 (Hu et al., 2013). Instead of assuming global geographic uniformity, GWR estimates PM2.5 in consideration of local variability.
In addition to AOD, meteorological parameters and socio-economic factors have been widely utilized as inputs to perfect models because meteorological factors affect the formation and dispersion of PM2.5, while human activities generate a considerable amount of PM2.5. The common used meteorological parameters and socio-economic factors include relative humidity (Kumar et al., 2007), wind speed (Lei et al., 2015), population density (Wang et al., 2016) and other factors.
This study aims to compare the 3 km and 10 km MODIS AOD products’ performances in estimating PM2.5 concentrations by using the GWR model in the Beijing-Tianjin-Hebei region from September 2014 to August 2015.
2. STUDY AREA AND DATA
2.1 Study Area
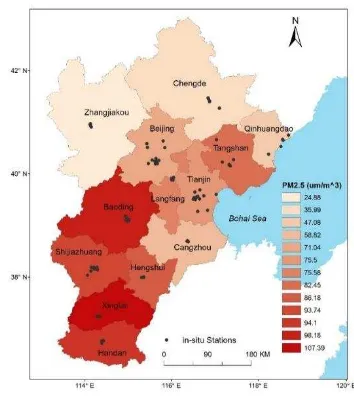
The Beijing-Tianjin-Hebei (BTH) region (show in Figure 1), with a land area of 218,000 km2, is the biggest urbanized region in northern China. BTH consists of two municipalities (Beijing and Tianjin) and eleven prefecture-level cities in Hebei Province (Shijiazhuang, Baoding, Langfang, Tangshan, Zhangjiakou, Chengde, Qinhuangdao, Cangzhou, Hengshui, Xingtai and Handan).
Figure 1. Study area
The huge population (110 million, 8% of the China’s population), high-speed urbanization, industrial processes, transportation, and coal consumption for winter heating have resulted in severe air pollution in the BTH region. From Figure 2, it can be found that during the study period, none of the eleven cities reached the Chinese national annual standard (15 μg/m3) and some of their averaged PM2.5 were 500% higher than the national standard and 800% higher than WHO guideline (10 μg/m3).
Figure 2 ground level monitoring stations’ locations and the averaged PM2.5 of each city during the study period
Table 1. Data sets used in this study.
2.2 Data
The data sets used in this study include ground-level PM2.5 measurements, remote sensing data, meteorological data and supplementary data, Table 1 presents all the data sets.
2.2.1 Ground PM2.5 Measurements: Hourly PM concentrations measured at 14:00 in 79 ground stations in the BTH region were acquired from the Ministry of Environmental Protection of the People’s Republic of China (MEPCN) (http://www.zhb.gov.cn/). The locations of these 79 stations are shown in Figure 2 and most of them are located in the urban area. Ground-level PM2.5 concentrations were mainly measured by Tapered Element Oscillating Microbalance (TEOM) and Beta Attenuation Monitoring (BAM) instruments.
2.2.2 Satellite Data: MODIS is carried on both Terra and Aqua satellites. In this study, in order to match MODIS AOD retrievals with the acquire time of meteorological data (acquired time: 14:00), only Aqua satellite MODIS data was employed. Aqua’s overpass time at equator is at local time 1:30 pm in ascending order, which suggests that the satellite normally flies over the study area during 1:30 pm to 2:00 pm.
The 10 km MODIS AOD product works well in climate related application but it is insufficient in fine scale’s study (Leigh et al, 2014). Therefore, in 2014, 3 km MODIS AOD was released as a part of MODIS Collection 6 product. In this study, both 10 km and 3 km AOD products are utilized. MODIS AOD product files are stored in Hierarchical Data Format (HDF-EOS).
2.2.3 Supplementary Data: Supplementary data include meteorological data, social-economic data and land use data.
In this study, meteorological data was obtained from the European Centre for Medium-Range Weather Forecasts (ECMWF) reanalysis datasets (ERA-Interim). As one of the ECMWF’s reanalysis datasets, ERA-Interim is a global atmosphere reanalysis from 1979. The meteorological data included surface temperature (K), surface pressure (Pa), U wind and V wind speed (m/s), relative humidity (%) and boundary layer height (BLH) (m). As introduced in Subsection 2.1, the wind from different direction may have different effects on PM2.5’s dissipation. Thus, U wind and V wind speeds are both used in this study. U wind is the wind from west to east while V wind is the wind from south to north.
The elevation, GDP, population, and land use data in 2010 were provided by the Data Centre for Resources and Environmental Sciences, Chinese Academy of Sciences (RESDC) (http://www.resdc.cn). The spatial resolutions of them are all of 1 km.
3. METHODOLOGY
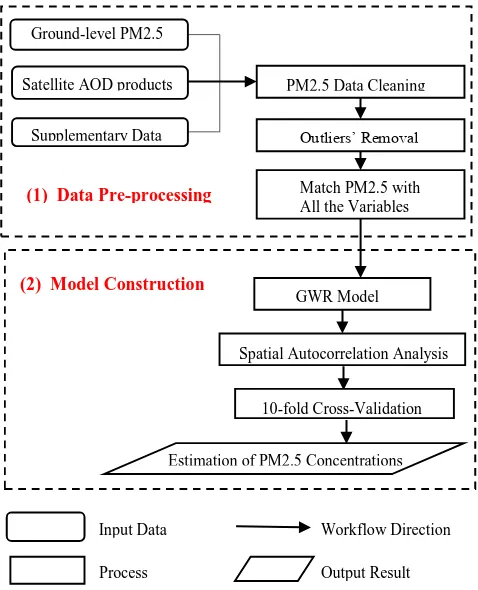
The methodology contains two modules: data pre-processing and model construction. The model construction module consist of the GWR model construction, spatial autocorrelation analysis and a 10-fold cross validation (CV). Figure 3 presents the workflow of this study.
Figure 3. Workflow of the methodology
Date Type Data Acquired Time Spatial Resolution Source
Ground-level PM2.5 PM2.5 (µg/m3) 14:00 N/A MEPCE
Remote Sensing Data Aqua MODIS AOD products
(dimensionless) 14:00 10 km; 3 km
NASA, MODIS Team
Meteorological Data
Temperature (K)
14:00
0.125° ECMWF: ERA-Interim Surface Pressure (Pa)
U Wind & V Wind speed(m/s)
Relative humidity (%)
Boundary Layer Height (m) 8:00; 12:00
Supplementary Data
Elevation (m)
2010 Year 1 km RESDC
Population (person) GDP (yuan)
The percent of the urban area (%)
Ground-level PM2.5
10-fold Cross-Validation
Estimation of PM2.5 Concentrations
(1) Data Pre-processing
(2) Model Construction
GWR Model
Spatial Autocorrelation Analysis
Process Input Data
Output Result Workflow Direction Satellite AOD products
Supplementary Data
PM2.5 Data Cleaning
Outliers’ Removal
3.1 Data Pre-processing
Firstly, all the data sets’ geographical coordinates are unified as China Lambert Conformal Conic. Then the meteorological datasets acquired from the ECMWF were resampled to 3 km resolution and 10 km respectively by using bilinear interpolation. The resolutions of GDP, population and elevation data were all less than 3 km. So these data sets were also aggregated to 3 km and 10 km resolution. This aggregation process was conducted by ArcGIS 10.3.1 and the aggregation techniques for GDP and population were “SUM” and that for DEM data was “MEAN”. For the PM2.5 concentrations acquired from MEP of China, the raw data was stored in text file. So text files were converted to features classes. Then, for those PM2.5 sites located in the same pixel of the MODIS AOD, their PM2.5 concentrations were averaged. This step was conducted for both the 10 km and 3 km AOD data, which is namely data cleaning.
Then each day’s PM2.5 data at each site was matched with all the variables at the same time within the same pixel. Those PM2.5 concentrations with no AOD data matched are considered invalid data. Then other variables and PM2.5’s outliers were removed. Finally, there were 1497 training samples for 3 km MODIS AOD model and 3132 training samples for 10 km MODIS AOD models.
3.2 GWR model
The GWR model generates a continuous surface of parameters by considering parameters’ spatial variations instead of assuming globally constant coefficient. The GWR model used in this study can be expressed as Eq. (1): slopes of corresponding variables. ; , is the MODIS AOD value at location (i, j); , is the temperature at location software, which is a Microsoft Windows-based application software developed and programmed by Professor Tomoki Nakaya from Ritsumeikan University in Japan. In this study, the Gaussian GWR model was chosen as the model type and the adaptive kernel type was chosen due to the uneven distribution of the PM2.5 monitoring sites. Furthermore, the “Golden Section Search” was used to automatically determine the best bandwidth size while “AIC” (Akaike Information Criterion) was used for bandwidth selection. In general, AIC can be used to determine the model which is closest to reality and the best model should have the lowest AIC value (Fotheringham et al., 2003; Hu et al.,
2013).At the same time, AIC can be used to assess whether the GWR model could generate a better result than global regression model. Therefore, a global regression model was also built with the same datasets: global regression model generates globally constant coefficient. More introduction of AIC can be found elsewhere (Bozdogan et al., 1987).
3.3 Spatial Autocorrelation Analysis
After the construction of the GWR model, the models’ residual was conducted with a spatial autocorrelation analysis. In this study, the spatial autocorrelation was analysed by calculating Moran’s I values in ArcGIS 10.3.1. The detailed introduction of Moran’s I values can be found elsewhere (Hu et al., 2013). Generally, Moran’s I value ranges from -1 to +1 (Cliff et al., 1981). When Moran’s I value is greater than zero, it is indicated the existence of positive spatial autocorrelations while the negative value of Moran’s denotes the negative autocorrelation. If Moran’s I value is near zero, it means there is no spatial autocorrelation (Hu et al., 2013). The ideal GWR models should have residuals with no significant spatial autocorrelation (Wang et al., 2005; Zhao et al., 2010).
3.4 Cross validation
After the spatial autocorrelation analysis, a 10-fold cross validation (CV) was conducted to determine whether the models were over-fitted. The whole dataset was split into ten folds and each of them had approximately 10% of the total data points. Then each fold was used for validation while the rest nine folds were used for training.
4. RESULTS AND DISCUSSION
The statistical results of the GWR model, including AIC, local R2, RMSE, MAPE and Moran’s I value, are shown in Table 2. The same statistical results of CV are also shown in Table 2. At the same time, to assess whether the GWR model could improve estimation accuracy from the global regression model, the corresponding global regression model’s results are also listed in Table 2.
In Table 2, N for the GWR model and the global regression model is the number of the training samples, while N for the 10-fold CV is the number of CV’s total testing samples. When determining whether the models’ residual had spatial autocorrelation, it should be noticed in Table 2 that no matter for the GWR model or the global regression model with the 3 km or 10 km product, Moran’s I were all near zero, which means there is no spatial autocorrelation in the model’s residuals.
In terms of AIC, the 3 km AOD GWR model’s AIC is 539.40, lower than AIC of the 3 km AOD global regression model (552.65). For 10 km GWR model, AIC is 533.62, which is also lower than the 10 km AOD global regression model’s AIC (548.19). Therefore, it can be drew that, no matter for the 3 km or 10 km AOD GWR model, GWR model performed better in predicting PM2.5 concentrations than global regressions did. Meanwhile, AIC of the 3 km AOD GWR model was slightly higher than AIC of the 10 km AOD GWR model, which indicates when using the GWR model, the 10 km AOD model still has a higher accuracy than 3 km AOD models.
Table 2. Model results of the GWR model, 10-fold CV and the corresponding Global Regression model from the 3 km and 10 km AOD products
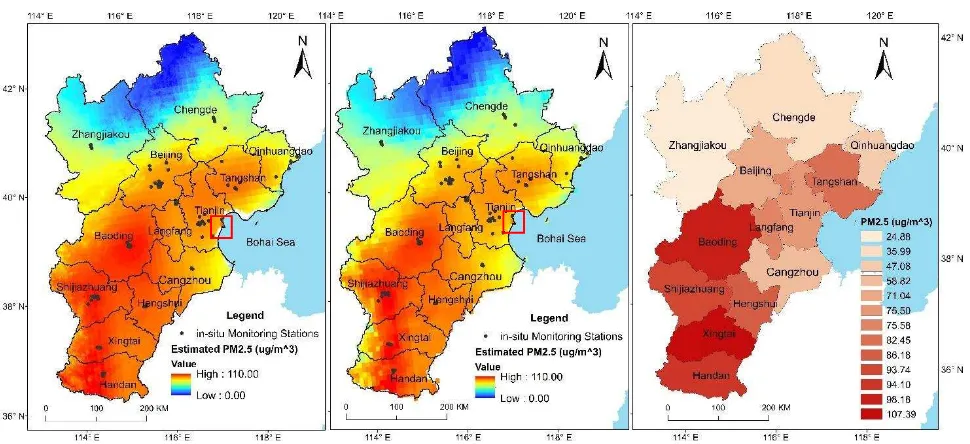
Figure 4. Estimated PM2.5 generated by the GWR model from (a) the 3 km AOD product, (b) the 10 km AOD and (c) the average PM2.5 of each city from their ground-level monitoring stations
had a local R2ranged from 0.83 to 0.96 and its CV’s local R2 was also similar. Meanwhile, RMSE and MAPE of CV were both greater than those of the GWR models. Therefore, it can be carefully concluded that, the 10 km AOD GWR model was slighted over-fitted but this over-fitting was at an acceptable level.
Then based on the 3 km and 10 km AOD WGR model, the estimations of annual PM2.5 distributions were mapped in Figure 4. As a whole, the 3 km AOD GWR model (Figure 4 (a)) and the 10 km AOD model (Figure 4 (b)) present similar spatial distributions of PM2.5 concentrations. In these two figures, red colour denotes high PM2.5 while blue colour indicates relatively clearer air. The estimated PM2.5 concentrations were ranged from 0 to 110 (μg/m3). Figure 4 (c) shows the each city’s average PM2.5 concentrations from their ground-level monitoring stations during the research period and this figure is as same as Figure 2. As shown in Figure 4(a) and (b), the mountainous area and the plateau region (Chengde and Zhangjiakou) had low concentrations of PM2.5 (10 to 45 μg/m3). Beijing, Tianjin, Qinhuangdao, Tangshan, Langfang and Cangzhou in Hebei Province had median levels of PM2.5 pollutions: 20-85 (μg/m3). It should be noticed that Tianjin harbour, marked with a red square in Figures (a) and (b), had a much higher value of PM2.5 (85.36 μg/m3) than other areas in Tianjin (around 70-75 μg/m3). This also proved that the transportation was an important source of PM2.5. The rest cities, Baoding, Shijiazhuang, Xingtai, Handan, and Hengshui in Hebei Province were polluted with the
highest level of PM2.5 (80-110 μg/m3) in the BTH region. This distribution agreed with the ground level monitoring data (Figure 4 (c)).
5. CONCLUSSION
This study aims to estimate PM2.5 concentrations in the BTH region using MODIS AOD products, meteorological datasets and land use information based on the GWR model.
The GWR model, estimating local coefficients and local R2, was able to improve the estimation accuracy than the corresponding global regression model. By comparing the MODIS 3km and 10 km AOD products, it was found the 10 km AOD had a slighter better accuracy in PM2.5 estimation. On the contrast, the 3 km AOD product performed better in presenting spatial variations, which may help governments to identify the emission sources.
However, limitations and uncertainties should be concerned. At the first, the vertical structure and components of aerosol was not considered and this would affect PM2.5’s estimation accuracy. This is because AOD presents the whole atmospheric aerosol distribution, while ground-level PM2.5 are measured near the Earth’s surface. Secondly, this study only utilized Aqua MODIS AOD product for time matching with meteorological data, but Terra MODIS AOD product was not explored. Thirdly, the lack of the AOD data in non-retrieved days and regions bring biases
Model Type N AIC Local R2 RMSE (μg/m3) MAPE (%) Moran’s I
3 km AOD
GWR Model 79 539.40 0.82-0.96 5.83 0 0.08
10-Fold CV for GWR 79 0.81-0.96 8.69 9.37 0.03
Global Regression Model 79 552.65 0.90 7.24 8.12
10 km AOD
GWR Model 79 533.62 0.83-0.95 5.61 6.63 -0.03
10-Fold CV for GWR 69 0.82-0.96 10.02 10.95 0.16
in AOD validation and PM2.5 estimation. Similar biases also existed when estimating PM2.5 in the whole BTH region because the ground level stations are limited in number and distributed unevenly.
According to the limitations, some research directions are proposed as followed: firstly, aerosol’s vertical structure and components should be explored by more remote sensing techniques, such as Lidar. Secondly, by integrating other remote sensing’s datasets, such as Terra MODIS AOD product and Landsat 8 data, the non-retrieved days or pixels should be reduced. Then, more spatial regression models should be explored in this field, such as Spatial Lag, for spatial relationship’s research. Moreover, the research scale should be enlarged to a national or global level, so that the pollutants’ sources and transfer’s trend can be identified.
ACKNOWLEDGEMENTS
We acknowledge the MODIS Teams for providing AOD products. In addition, we also appreciate ECMWF for ERA-Interim data. Finally, we acknowledge Data Center for Resources and Environmental Sciences, Chinese Academy of Sciences (RESDC) for proving land use datasets.
REFERENCES
Beh, B.C., Tan, F., Tan, C.H., Syahreza, S., Jafri, M.M. and Lim, H.S., 2013, May. PM10, PM2. 5 and PM1 distribution in Penang Island, Malaysia. In AIP Conf. Proc (Vol. 1528, pp. 146-150).
Benas, N., Beloconi, A. and Chrysoulakis, N., 2013. Estimation of urban PM10 concentration, based on MODIS and MERIS/AATSR synergistic observations. Atmospheric Environment, 79, pp.448-454.
Bozdogan, H., 1987. Model selection and Akaike's information criterion (AIC): The general theory and its analytical extensions. Psychometrika, 52(3), pp.345-370.
Chu, D. A., Kaufman, Y. J., Zibordi, G., Chern, J. D., Mao, J., Li, C., & Holben, B. N. (2003). Global monitoring of air pollution over land from the Earth Observing System‐Terra Moderate Resolution Imaging Spectroradiometer (MODIS). Journal of Geophysical Research: Atmospheres, 108(D21).
Chudnovsky, A.A., Koutrakis, P., Kloog, I., Melly, S., Nordio, F., Lyapustin, A., Wang, Y. and Schwartz, J., 2014. Fine particulate matter predictions using high resolution Aerosol Optical Depth (AOD) retrievals. Atmospheric Environment, 89, pp.189-198.
Cliff, A.D. and Ord, J.K., 1981. Spatial Processes: Models & Applications (Vol. 44). London: Pion.
Emili, E., Popp, C., Petitta, M., Riffler, M., Wunderle, S. and Zebisch, M., 2010. PM 10 remote sensing from geostationary SEVIRI and polar-orbiting MODIS sensors over the complex terrain of the European Alpine region. Remote Sensing of Environment, 114(11), pp.2485-2499.
Fotheringham, A.S., Brunsdon, C. and Charlton, M., 2003. Geographically Weighted Regression: the Analysis of Spatially Varying Relationships. John Wiley & Sons.
Gao, M., Guttikunda, S.K., Carmichael, G.R., Wang, Y., Liu, Z., Stanier, C.O., Saide, P.E. and Yu, M., 2015. Health impacts and economic losses assessment of the 2013 severe haze event in Beijing area. Science of the Total Environment, 511, pp.553-561.
Gupta, P., Christopher, S.A., Wang, J., Gehrig, R., Lee, Y.C. and Kumar, N., 2006. Satellite remote sensing of particulate matter and air quality assessment over global cities. Atmospheric Environment, 40(30), pp.5880-5892.
Hadjimitsis, D.G., 2009. Aerosol optical thickness (AOT) retrieval over land using satellite image-based algorithm. Air Quality, Atmosphere & Health, 2(2), pp.89-97.
Hu, X., Waller, L.A., Al-Hamdan, M.Z., Crosson, W.L., Estes, M.G., Estes, S.M., Quattrochi, D.A., Sarnat, J.A. and Liu, Y., 2013. Estimating ground-level PM 2.5 concentrations in the southeastern US using geographically weighted regression. Environmental Research, 121, pp.1-10.
Jones, B.E., VanDerslice, J., Jephson, A., Dean, N.C. and Pirozzi, C.S., 2015. Short-Term Effects Of Particulate Air Pollution Exposure On Incidence And Severity Of Pneumonia. Am J Respir Crit Care Med, 191, p.A5250.
Kioumourtzoglou, M.A., Schwartz, J.D., Weisskopf, M.G., Melly, S.J., Wang, Y., Dominici, F. and Zanobetti, A., 2016. Long-term PM2. 5 exposure and neurological hospital admissions in the Northeastern United States. Environmental Health Perspectives, 124(1), p.23.
Kloog, I., Nordio, F., Coull, B.A. and Schwartz, J., 2012. Incorporating local land use regression and satellite aerosol optical depth in a hybrid model of spatiotemporal PM2. 5 exposures in the Mid-Atlantic states. Environmental Science & Technology, 46(21), pp.11913-11921.
Kumar, N., Chu, A. and Foster, A., 2007. An empirical relationship between PM 2.5 and aerosol optical depth in Delhi Metropolitan. Atmospheric Environment, 41(21), pp.4492-4503.
Lee, H.J., Coull, B.A., Bell, M.L. and Koutrakis, P., 2012. Use of satellite-based aerosol optical depth and spatial clustering to predict ambient PM 2.5 concentrations. Environmental Research, 118, pp.8-15.
Lei, Y., Wei, R., Wang, S., Wang, Y., Du, L. and Shen, H., 2015. Factor Analysis of Mass Concentration Characterization of PM2. 5 and its Impact Factors in a Suburban Roadside: Taking a National Road of Zhengzhou, China as an Example. Nature Environment and Pollution Technology, 14(2), p.409.
Pope III, C.A., 2000. Epidemiology of fine particulate air pollution and human health: biologic mechanisms and who's at risk?. Environmental Health Perspectives, 108(Suppl 4), p.713.
Wang, J., Li, X., Zhang, W., Jiang, N., Zhang, R. and Tang, X., 2016. Secondary PM 2.5 in Zhengzhou, China: Chemical Species Based on Three Years of Observations. Aerosol and Air Quality Research, 16, pp.91-104.
Wang, J., Wang, S., Voorhees, A.S., Zhao, B., Jang, C., Jiang, J., Fu, J.S., Ding, D., Zhu, Y. and Hao, J., 2015. Assessment of short-term PM 2.5-related mortality due to different emission sources in the Yangtze River Delta, China. Atmospheric Environment, 123, pp.440-448
Wang, Q., Ni, J. and Tenhunen, J., 2005. Application of a geographically‐weighted regression analysis to estimate net primary production of Chinese forest ecosystems. Global Ecology and Biogeography, 14(4), pp.379-393.
Zanobetti, A., Austin, E., Bind, M.A.C. and Schwartz, J., 2015. Estimating Causal Effects Of PM2. 5 On Daily Deaths In Boston. Am J Respir Crit Care Med, 191, p.A3198.