A FRAMEWORK FOR VOXEL-BASED GLOBAL SCALE MODELING OF URBAN
ENVIRONMENTS
Joachim Gehrunga, Marcus Hebela, Michael Arensa, Uwe Stillab
a
Fraunhofer Institute of Optronics, System Technologies and Image Exploitation IOSB, 76275 Ettlingen, Germany - (joachim.gehrung, marcus.hebel, michael.arens)@iosb.fraunhofer.de b
Photogrammetry and Remote Sensing, Technische Universit¨at M¨unchen, 80333 Munich, Germany - [email protected]
KEY WORDS:Large Scale Modeling, Urban Environments, Probabilistic Occupancy Maps, Volume Rendering
ABSTRACT:
The generation of 3D city models is a very active field of research. Modeling environments as point clouds may be fast, but has disad-vantages. These are easily solvable by using volumetric representations, especially when considering selective data acquisition, change detection and fast changing environments. Therefore, this paper proposes a framework for the volumetric modeling and visualization of large scale urban environments. Beside an architecture and the right mix of algorithms for the task, two compression strategies for volumetric models as well as a data quality based approach for the import of range measurements are proposed. The capabilities of the framework are shown on a mobile laser scanning dataset of the Technical University of Munich. Furthermore the loss of the compression techniques is evaluated and their memory consumption is compared to that of raw point clouds. The presented results show that generation, storage and real-time rendering of even large urban models are feasible, even with off-the-shelf hardware.
1. INTRODUCTION
Large scale urban models can be applied for tasks such as city planning, emergency management and other things such as traf-fic flow or flooding simulations. Most works in the field focus on the generation of 3D city models. These are, however, not con-sidering the inherent long-term challenge of keeping it up to date. Using point clouds as an intermediate representation may have the advantage of easy and fast processing. For a fast changing urban environment, volume based representations such as vox-els are more suitable, taking not only their fixed upper memory boundary into consideration but also the ability to model free and unexplored space. Qualities which are important for critical tasks such as efficient storage, change detection and structured data ac-quisition. Not to forget that the inherent multi-scale representa-tion allows the efficient execurepresenta-tion of algorithms - especially ren-dering.
The generation of city models based on a volumetric represen-tation requires a sound foundation. For this reason, this paper proposes a framework for the volumetric large scale modeling of urban environments. The main contributions of this paper are:
• A framework for modeling and visualizing volume based environments on a global scale, based on a thoroughly se-lected mix of technologies and algorithms.
• A data quality based algorithm to import range measure-ments (e.g. point clouds, depth images, ...).
• Both a lossless and lossy compression strategy for storing the volumetric representation to disk.
The paper is organized as follows: In Section 2, a brief overview of the related work is given. Section 3 presents an overview of the proposed framework, while Section 4 and 5 provide further details about the data quality based import algorithm and the pro-posed compression strategies. The results provided by the frame-work are shown in Section 6. An evaluation of the results is given in Section 7.
2. RELATED WORK 2.1 Large Scale Modeling
An comprehensive overview of the field is given in (Leberl et al., 2012). Most of the discussed approaches for city model genera-tion utilize either photogrammetric techniques, active sensors or a combination of both. Some approaches like the one proposed by Poullis et al. have fully automated the extracting of polygonal 3D models (Poullis, 2013).
However, volumetric techniques are hardly used in the field. Mul-der demonstrated the benefits of a voxel-based model for the re-pair of geometrically invalid 3D city building models (Mulder, 2015). Garcia-Dorado et al. utilized volumetric grids as an in-termediate representation to extract building models from aerial images using a surface graph cut algorithm (Garcia-Dorado et al., 2013). To the knowledge of the authors, to date there is no work utilizing the full capacity of volumetic modeling techniques as a starting point for large scale urban modeling.
2.2 Probabilistic Modeling Techniques
Point clouds could be considered as a first step towards environ-ment modeling, as done by most 3D SLAM systems (Cole and Newman, 2006) (N¨uchter et al., 2007). The absence of an upper bound for memory requirements however is a huge disadvantage. Also point clouds lack expression regarding free and unexplored space, further on the measurement uncertainty is not explicitly modeled.
As large scale modeling requires a spatial compression, octree based occupancy maps are a worthwhile approach. Early works stored binary occupancy information in the octree cells (Meagher, 1982). Later probabilistic information has been included into the model (Fournier et al., 2007) (Payeur et al., 1997). As with grid maps, there is an upper bound in memory consumption. Due to the compression and multi-resolution properties of octrees, global modeling and efficient algorithms execution are feasible. The probably most advanced octree-based volumetric representa-tion is OctoMap (Hornung et al., 2013). Its key contriburepresenta-tion is a nearly lossless model compression strategy based on probability clamping, allowing fast adaptability and pruning of child nodes.
However, as this approach has been developed for autonomous robotics, it is not entirely suited for large scale modeling. Merg-ing maps is not trivial, unless the map origin and resolution are equal and the affected nodes have no child nodes on their own. Jessup et al. (Jessup et al., 2014) solved this by aligning maps, using transformations determined from commonly mapped por-tions of the environment. Based on these, trilinear interpolation is used for map resampling and merging. Considering the use of a single global reference frame instead of multiple ones, this approach could be further utilized for large scale modeling.
Furthermore, an adaption of the persistence strategy of OctoMap is required. Since loading a complete global model at once is not feasible, ways to subdivide into partial models are necessary. Fur-ther optimization can be done by discarding all parts of the model that do not carry useful information, namely the octrees upper branch nodes. The memory requirements for storing a global model on disk can further be reduced by considering advanced compression techniques.
2.3 Volume Rendering
An exhaustive overview over the topic of volume rendering is given in (Meißner et al., 2000). Techniques are distinguished in Indirect and Direct Volume Rendering. The former one requires the extraction of a polygonal iso-surface (e.g. using Marching Cubes (Lorensen and Cline, 1987)), which is rendered with poly-gon rendering hardware.
The latter category of techniques renders the volume directly, without the intermediate step of surface extraction. Volume ray casting based approaches like Gigavoxels (Crassin, 2011) pro-duce impressive results, however at the expense of GPU based hardware acceleration. 3D Texture-Mapping is also based on a GPU rendering pipeline. This technique involves loading the vol-ume in question into the texture memory, utilizing the texturing process for volume rendering.
Unlike hardware accelerated techniques both Shear-Warping and Splatting can be implemented in software only. The former in-volves shearing and distorting the voxel grid according to a cho-sen perspective which allows traversing both image and grid us-ing a scanline-based algorithm (Cabral et al., 1994). The latter one uses a multi-scale-representation of the volume which is ren-dered with adaptive depth. A popular variation of this algorithm is QSplat. It allows rendering at a fixed frame rate at the expen-sive of image quality, even in case of complex geometry or low computational resources (Rusinkiewicz and Levoy, 2000).
3. FRAMEWORK 3.1 Capabilities and Architecture
The proposed framework is capable of handling a volumetric en-vironment representation on a global scale. The inherent upper
memory boundary of the chosen modeling approach as well as the proposed compression techniques permit efficient storage even of frequently changing areas. Fast processing is ensured by the capability to load only the required parts of the representation. Real-time visualization is permitted due to a Splatting based ren-dering approach developed for the framework’s volumetric rep-resentation.
Figure 1. Framework main components overview. The global index handles access to resources required by import and visual-ization and is in control of parameters, caching and persistence.
The framework is organized as shown in Figure 1. The Global Index coordinates the storage strategy consisting of in-memory caching and long-term storage on disk. It is responsible for select-ing the required parts of the representation based on addresses, spatial coordinates and rays. The algorithms for import and vi-sualization access the representation through the Global Index, allowing both import of new measurements and visualization at the same time.
3.2 Volumetric Modeling
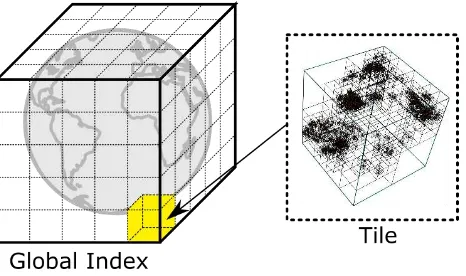
The framework is based on the assumption of a global Cartesian reference frame. Therefore it is expected that the agent respon-sible for data collection is able to geolocate itself respectively its measurements in a sufficiently exact manner. To simplify mat-ters the widely spread ECEF coordinate system was chosen. A cubical bounding box was defined in a way that it completely en-closes the earth. Within the bounding box space was tesselated into a fine uniform grid - referred to asglobal index- which grid cells are labelled astiles(see Figure 2).
Figure 2. The global index created by tesselating a cubic bound-ing box around earth into a fine grid. Grid cells are referred to as tiles.
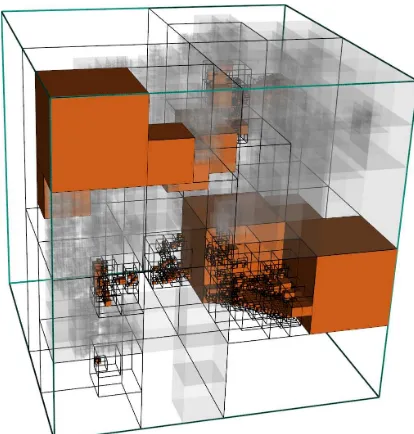
ascelland can be uniquely addressed by its depth inside the tree and its Morton code. The maximum octree depth determines the maximum spatial resolution as well as the upper memory bound-ary. Figure 3 shows an exemplary demonstration created from a real world dataset.
Figure 3. An exemplary demonstration of a tile, created from a real world dataset. Occupied cells are rendered in red, free cells in transparent gray. Unexplored space is not rendered at all.
The benefits resulting from this approach are numerous. Parts of the representation can be loaded, cached and processed dy-namically. Only tiles required by the task at hand are initialized which avoids unnecessary memory consumption. The fusion of distinct representations is straightforward, since only overlapping tiles need special handling.
3.3 Model Parameter Selection
The model parameters that need to be selected are the edge length
lindexof the global index bounding box, the tile edge lengthltileas well asdtile, which is the number of the tiles octree hierarchy lev-els. The calculation is based on the desired approximate tile edge lengthrtileand the maximum spatial resolutionrmax. Equation 1 describes the basic geometric properties of an octree.
l=r·2d (1)
As stated above,lis the edge length of the octree’s bounding cube andris the resolution of a single cell at depthd. Rearranging leads to Equation 2, which allows calculation ofdtile.
dtile=
l
log2
rtile
rmax
m
(2)
Based ondtile, the tiles edge lengthltile can be determined using Equation 3.
ltile=rmax·2 dtile
(3)
The earth’s diameter of approximately12800 kmis a first starting point for the bounding box edge length, which can be determined by Equation 4.
lindex=
l12800 km ltile
m
·ltile (4)
For an approximate tile resolution of about10meters and a spa-tial resolution of0.1 m,lindex = 12800 km,ltile = 12.8 mand
dtile = 7 are determined. These values are considered as the framework’s standard parametrization.
3.4 Real-time Visualization
From the four major volume rendering techniques mentioned in Section 2.3, Splatting turned out to fit most to the overall ap-proach of the framework. One of the main reasons is that due to the octree used for volumetric modeling, a multi-resolution data structure is already available. Furthermore the chosen approach doesn’t require any hardware support except from OpenGL for basic rendering. It builds entirely on a software implementation, allowing real-time rendering even on a single CPU.
During rendering first all existing tiles inside the view frustum are determined based on its bounding box. The rendering speed depends on the chosen resolution, hence on the depth inside the octree. This resolution is determined at runtime based on the length of the last cycle to permit real-time rendering. Therefore a heuristic is used that exploits the fact that the number of cells to render decreases by the factor of eight for every step up the hi-erarchy. An iterative refinement step increases the image quality stepwise once the camera stops moving.
4. DATA IMPORT 4.1 Adaption of the Import Algorithm
The algorithm that imports new range measurements into the vol-umetric representation of the environment is an extension of the one used by the OctoMap framework (Hornung et al., 2013). The utilized ray-based sensor model considers end points as corre-sponding to surfaces and further assumes the line of sight to be free of obstacles. Based on these assumptions, the occupancy probability of the voxels traversed by a ray is updated.
Due to the proposed space tessellation scheme an additional step for the selection of all tiles traversed by a ray is required. There-fore the tiles related to the start and end point of the ray are calcu-lated. All tiles in between are determined by using a 3D variant of the Bresenham algorithm (Amanatides and Woo, 1987). In a fol-lowing step another iteration of Bresenham is applied to every tile to determine the free and occupied cells. To avoid unnecessary computations, each ray is cut to fit the tiles’ bounding box. Since the addressing of cells is based on Morton coding, addresses out-side the bounding box generated due to numerical inaccuracies can easily be filtered out.
After all rays are processed, the occupancy octree of every tile is updated based on the corresponding free and occupied cells. In a final post-processing step, pruning is applied and the probabilities of the branch nodes are recalculated.
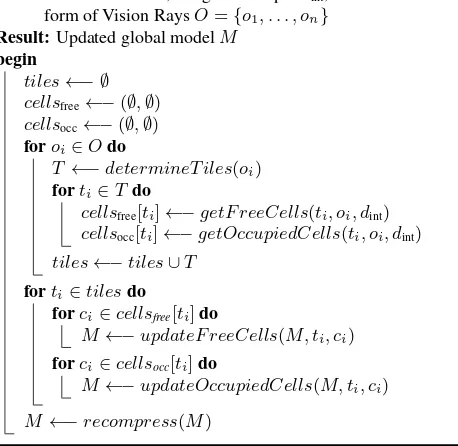
Algorithm 1:Import of range measurements.
Data:Global modelM, integration depthdint, Observations in form of Vision RaysO={o1, . . . , on}
Result:Updated global modelM
begin
tiles←− ∅
cellsfree←−(∅,∅)
cellsocc←−(∅,∅) foroi∈Odo
T ←−determineT iles(oi)
forti∈Tdo
cellsfree[ti]←−getF reeCells(ti, oi, dint)
cellsocc[ti]←−getOccupiedCells(ti, oi, dint)
tiles←−tiles∪T
forti∈tilesdo
forci∈cellsfree[ti]do
M ←−updateF reeCells(M, ti, ci)
forci∈cellsocc[ti]do
M ←−updateOccupiedCells(M, ti, ci)
M ←−recompress(M)
As it turned out the ray based approach performed best regard-ing runtime and memory consumption. The tile based approach turned out to be a few orders of magnitude slower, likely due to a huge memory consumption that forced the operating system to do memory swapping. For the reasons mentioned above, the ray-based key buffering strategy is considered the approach of choice.
4.2 Data Quality based Import
When processing data from multiple sensors, one also has to deal with the diversity in data quality. As the chosen approach models the environment based on discretization, the quality of the result-ing model is ensured by avoidresult-ing discretization errors. These of course are high when placing uncertain data in a fine grid and de-crease once the grid is replaced by a coarser one. As an octree provides multiple resolutions, the way of choice to reduce dis-cretization errors is the selection of the appropriate depth for the import of new measurements.
One way for assessing data quality is the standard deviation of the overall sensor system. In the context of large scale model-ing this not only concerns precision and accuracy of the sensor system, but also of its self-localization. Although this is not triv-ial to calculate, in most cases it is possible to obtain an accurate estimation.
dint= min
j
log2
ltile
4σ
k , dtile
(5)
Equation 5 proposes a way to estimate the octree resolutiondint for integration based on the standard deviation. Since the octree may contain nodes with a finer resolution, the modified update algorithm from (Jessup et al., 2014) is applied for model update.
5. COMPRESSION 5.1 General Approaches to Compression
The storage of large scale volumetric models is very memory in-tensive, which implies the application of compression techniques.
Therefore, in this section approaches for memory reduction are introduced and two strategies utilizing them are proposed. A point worth considering when developing a compression tech-nique is the inherent octree structure. The number of nodes in-creases exponentially with every additional layer. As shown in Figure 4, in a fully expanded octree87.5%of all nodes are in the leaf layer. Taking this into consideration it becomes clear that the largest improvements can be done when reducing memory in the leaf layer. Still, optimizing the branch layer can also be benefi-cial.
Figure 4. In a fully expanded octree87.5%of all nodes are leaf nodes, therefore most compression efforts should focus on them.
The information encoded in a serialized node contains its payload in form of a 4 byte occupancy probability, a 3 byte color informa-tion and a 1 byte array describing whether or not the eight child nodes exist. As leaf nodes have no descendants, there is no need to store a child array. Therefore aleaf bitis introduced. Only if set to zero, a child array is expected. Since a majority of all nodes are leaf nodes, the memory reduction from dropping the child ar-rays outweighs the introduced overhead. The leaf bit also enables another way of compression. The payload of inner nodes can eas-ily be reconstructed from the leaf nodes, as it is done during the import of range measurements. Consequently it doesn’t have to be serialized whenever the leaf bit is zero. These two optimiza-tions lead to a reduction of15.6%of total memory consumption.
Figure 5. The memory consumption in bits for the uncompressed case, as well as after applying leaf bit and additional quantiza-tion, where probability and every color channel are represented by a single bit. Leaf bits are marked in red, child arrays in blue, probabilities in green and colors in orange.
Further compression can be achieved by additionally quantizing the payload. Considering the case that all the color channels and the probability are represented by just a single bit, a total com-pression rate of91.4% can be archived. Since this process is lossy, the total loss of information is evaluated in Section 7. Fig-ure 5 illustrates the memory reduction achieved by applying both the leaf bit and quantization technique.
(a)
(b) (c)
(d) (e)
branch nodes. Extending this approach by quantizing the prob-ability leads to the lossy strategy. A detailed evaluation of the proposed compression strategies is done in Section 7.
6. EXPERIMENTAL RESULTS
The proposed framework has been tested using a mobile laser scanning dataset containing the inner-city campus of the Techni-cal University of Munich (TUM) as well as two art museums and the urban area in the vicinity. The sensor vehicle utilized for this task is equipped with two Velodyne HDL-64E laser scanners lo-cated in a 25 degree angle on the front roof to be able to acquire both road and building facades. A Ladybug5 spherical camera is used for texturization. The navigational system is an Applanix POS LV encompassing two GNSS antennas, an inertial measure-ment unit and a distance measuring indicator. The navigational data was post-processed to increase accuracy.
Since only the part of the model that is currently worked with is loaded into memory, the critical factors for testing the capabilities of the framework are spatial resolution and geometric complexity. The TUM dataset fulfils both criteria. The area covered by it has a size of0.2 km2
. However, it consists of more than35000high resolution mobile laser scans, including a total amount of about
715million points. The density of the accumulated point cloud varies from a few hundred to a few thousand points per square meter, mostly depending on the vehicle speed and the number of pass-bys.
All reported results were generated on a machine with32 GiB1 of RAM and an Intel Core i7 processor with 3.5 GHzand 12
cores. The volumetric model generated from this dataset consists of4619tiles with an inner resolution of10 cm. The import of the complete dataset (using the standard parameters determined in Section 3.3) completed in21 h40 minincluding free space tra-versed at a resolution of80 cmto prevent fragmentation, utilizing all available cores. Time can be reduced dramatically to37 min
when only considering surface points. This corresponds roughly to the driving time spent to record the dataset. A reasonable large cache size was chosen to avoid delays.
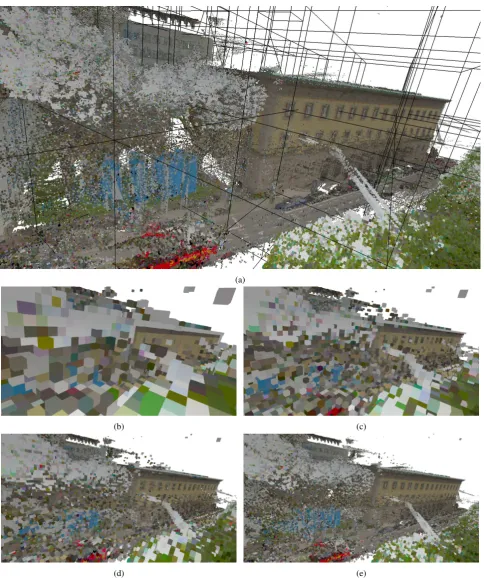
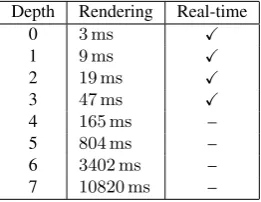
Depth Rendering Real-time
0 3 ms X
1 9 ms X
2 19 ms X
3 47 ms X
4 165 ms – 5 804 ms – 6 3402 ms – 7 10820 ms –
Table 1. The rendering times of each octree depth for a frame rate of10 Hz.
Figure 6a shows the volumetric model generated from the dataset. The Figures 6b, 6c, 6d and 6e show the same scene for different resolutions. The corresponding rendering times are presented in Table 1. Rendering was done without parallelization, using a field of view with a range of100 m. The results show that real-time rendering is possible at a resolution of1.6 m.
1
Please note that in this paper memory is addressed using IEC sym-bols. GiB corresponds to Gigabyte and is defined as230byte.
7. EVALUATION 7.1 Information Loss due to Compression
Due to the sensor model the probability mass is not equally dis-tributed over the entire interval. Therefore, applying the lossy compression results in an information loss that depends on the number of bits used for encoding. The color channels were ne-glected in this consideration and fixed at8bit per channel. To determine the loss, a tile with representative features has been stored in both the compressed an uncompressed format. Both were reimported and the values of their cells were compared. It should be stated that no pruning was applied at the compressed tile to preserve the tree structure. Since all probabilities within the framework are based on log odds, the mean log odd discrep-ancy was chosen as a measure for the actual loss of information.
Figure 7. The mean log odd discrepancy in relation to the number of bits used for encoding is used to illustrate the information loss due to probability quantization.
The experimental results for encodings from1to32bit are shown in Figure 7. As can be seen already a 6-bit encoding results in a very low discrepancy from the original value. Considering the trade-off between accuracy and memory requirements, a 9-bit en-coding resulting in a compression rate of80.5%is the optimal choice.
7.2 Compression Rates
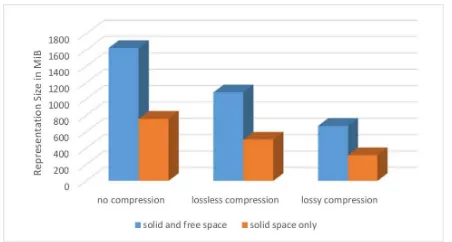
In this section the compression of both the volumetric representa-tion as well as both compression algorithms are analyzed. There-fore the two representations mentioned in Section 6 were utilized. Their memory consumption for the generated representation are shown in Figure 8, whereas the lossy compression is based on the 9-bit encoding determined before. The point clouds used for generation have a size of17.1 GiB.
As can be seen, the memory consumption of even the largest model is an order of magnitude smaller than the point cloud. This demonstrates the inherent compression capabilities of the volu-metric representation. The actual compression rates of both com-pression approaches turned out to be even higher than expected, a few percent for the lossy compression and about15%for the lossless one. This may be due to the environment geometry and applied pruning.
Figure 8. The requirements of disk memory for the representation generated from the TUM dataset. Memory consumption of the uncompressed format as well as lossless and lossy compression are shown.
propabilistic volumetric approach. Beside the framework we pro-posed a quality based algorithm to import range measurements into the global index. Furthermore a lossless and lossy compres-sion technique were presented. We evaluated our framework with a real-world data sets. The loss of information based on the num-ber of bits used for the lossy compression was evaluated and the compression rates for the modeling approach itself as well as both compression techniques were evaluated.
Our work has shown that large scale modeling can benefit from a volumetric representation. As shown in context of the real-time visualization, the inherent multi-level representation permits fast and efficient execution of algorithms. The overall memory con-sumption is less than that of a comparable point cloud. Importing only surface points is roughly possible in real-time, yet consid-ering free space leads to a dramatic increase of the runtime. In the future, besides improving the framework we will focus on the extraction of static environment elements for an efficient change detection. Based on this we hope to achieve better results for the construction of 3D models of buildings and other urban struc-tures.
REFERENCES
Amanatides, J. and Woo, A., 1987. A Fast Voxel Traversal Algo-rithm for Ray Tracing. In:Eurographics ’87, pp. 3–10.
Cabral, B., Cam, N. and Foran, J., 1994. Accelerated Volume Rendering and Tomographic Reconstruction Using Texture Map-ping Hardware. In:Proceedings of the 1994 Symposium on Vol-ume Visualization, VVS ’94, ACM, New York, NY, USA, pp. 91– 98.
Cole, D. M. and Newman, P. M., 2006. Using laser range data for 3D SLAM in outdoor environments. In:Proceedings of the IEEE International Conference on Robotics and Automation (ICRA), pp. 1556–1563.
Crassin, C., 2011. GigaVoxels: A Voxel-Based Rendering Pipeline For Efficient Exploration Of Large And Detailed Scenes. PhD thesis, Grenoble University.
Fournier, J., Ricard, B. and Laurendeau, D., 2007. Mapping and Exploration of Complex Environments Using Persistent 3D Model. In:CRV, IEEE Computer Society, pp. 403–410.
Garcia-Dorado, I., Demir, I. and Aliaga, D. G., 2013. Auto-matic urban modeling using volumetric reconstruction with sur-face graph cuts.Computers & Graphics37(7), pp. 896–910.
Herbert, M., Caillas, C., Krotkov, E., Kweon, I. S. and Kanade, T., 1989. Terrain mapping for a roving planetary explorer. In:
Proceedings of the IEEE International Conference on Robotics and Automation (ICRA ’89), Vol. 2, pp. 997–1002.
Hornung, A., Wurm, K. M., Bennewitz, M., Stachniss, C. and Burgard, W., 2013. OctoMap: An Efficient Probabilistic 3D Map-ping Framework Based on Octrees.Autonomous Robots.
Jessup, J., Givigi, S. N. and Beaulieu, A., 2014. Merging of octree based 3D occupancy grid maps. In: 2014 IEEE International Systems Conference Proceedings.
Leberl, F., Meixner, P., Wendel, A. and Irschara, A., 2012. Au-tomated photogrammetry for three-dimensional models of urban spaces. Optical Engineering.
Lorensen, W. E. and Cline, H. E., 1987. Marching Cubes: A High Resolution 3D Surface Construction Algorithm. In:Proceedings of the 14th Annual Conference on Computer Graphics and Inter-active Techniques, SIGGRAPH ’87, ACM, New York, NY, USA, pp. 163–169.
Meagher, D., 1982. Geometric modeling using octree encoding. Computer Graphics and Image Processing19(2), pp. 129–147.
Meißner, M., Pfister, H., Westermann, R. and Wittenbrink, C., 2000. Volume Visualization and Volume Rendering Techniques. In:Tutorials 6, Eurographics 2000.
Moravec, H. and Elfes, A., 1985. High Resolution Maps from Wide Angle Sonar. In: Proceedings of the 1985 IEEE Interna-tional Conference on Robotics and Automation, pp. 116 – 121.
Morton, G., 1966. A computer oriented geodetic data base and a new technique in file sequencing. Technical report, IBM Ltd., Ottawa, Ontario, Canada.
Mulder, D., 2015. Automatic repair of geometrically invalid 3d city building models using a voxel-based repair method. Master’s thesis, Delft University of Technology.
N¨uchter, A., Lingemann, K., Hertzberg, J. and Surmann, H., 2007. 6D SLAM - 3D mapping outdoor environments: Research Articles.J. Field Robot.24(8-9), pp. 699–722.
Payeur, P., Hebert, P., Laurendeau, D. and Gosselin, C. M., 1997. Probabilistic octree modeling of a 3D dynamic environment. In: Proceedings of the IEEE International Conference on Robotics and Automation, Vol. 2, pp. 1289–1296.
Poullis, C., 2013. A Framework for Automatic Modeling from Point Cloud Data. IEEE Trans. Pattern Anal. Mach. Intell. 35(11), pp. 2563–2575.
Roth-Tabak, Y. and Jain, R., 1989. Building an environment model using depth information.Computer22(6), pp. 85–90.
Rusinkiewicz, S. and Levoy, M., 2000. QSplat: A Multiresolu-tion Point Rendering System for Large Meshes. In:Proceedings of the 27th Annual Conference on Computer Graphics and Inter-active Techniques, SIGGRAPH ’00, ACM, pp. 343–352.