CONTEXT-BASED URBAN TERRAIN RECONSTRUCTION FROM IMAGES AND
VIDEOS
Dimitri Bulatov1, Franz Rottensteiner2, Karsten Schulz1
1Fraunhofer Institute of Optronics, System Technologies and Image Exploitation Gutleuthausstr. 1, 76275 Ettlingen, Germany
{dimitri.bulatov, karsten.schulz}@iosb.fraunhofer.de
2Institute of Photogrammetry and GeoInformation, Leibniz Universit¨at Hannover, Nienburger Str. 1, 30167 Hannover, Germany
Commission III/3
KEY WORDS:Building Reconstruction, Depth Map, Digital Surface Model, Free Geographic Data, Near Infrared, Vegetation
ABSTRACT:
Detection of buildings and vegetation, and even more reconstruction of urban terrain from sequences of aerial images and videos is known to be a challenging task. It has been established that those methods that have as input a high-quality Digital Surface Model (DSM), are more straight-forward and produce more robust and reliable results than those image-based methods that require matching line segments or even whole regions. This motivated us to develop a new dense matching technique for DSM generation that is capable of simultaneous integration of multiple images in the reconstruction process. The DSMs generated by this new multi-image matching technique can be used for urban object extraction. In the first contribution of this paper, two examples of external sources of information added to the reconstruction pipeline will be shown. The GIS layers are used for recognition of streets and suppressing false alarms in the depth maps that were caused by moving vehicles while the near infrared channel is applied for separating vegetation from buildings. Three examples of data sets including both UAV-borne video sequences with a relatively high number of frames and high-resolution (10cm ground sample distance) data sets consisting of (few spatial-temporarily diverse) images from large-format aerial frame cameras, will be presented. By an extensive quantitative evaluation of the Vaihingen block from the ISPRS benchmark on urban object detection, it will become clear that our procedure allows a straight-forward, efficient, and reliable instantiation of 3D city models.
1 INTRODUCTION AND PREVIOUS WORK
Extraction of buildings and vegetation from sequences of aerial images is known to be a difficult task. For several excellent state-of-the-art methods, based on edge matching (Baillard and Zisser-man, 2000), color-segmentation (Hendricsson, 2005) and hierar-chical assessment (Fischer et al., 1998), urban terrain modeling is carried out by a sophisticated combination of bottom-up and top-down processes that require an elaborated choice of parameter sets. However, detection and even more matching of non-zero-dimensional structures is a non-trivial, data-dependent task. As a consequence, these methods are often tested on a quite sparse and congeneric kind of data-sets. Because trees are known to con-tain neither many 2D lines nor homogeneously colored regions, these methods will have problems in reliable estimation of vege-tation. Despite a lower geometric accuracy and susceptibility in regions of homogeneous texture, it has therefore become more attractive in the recent years to compute high-quality depth maps together with aerial images (e. g. (Zebedin et al., 2008) for binoc-ular stereo) and apply the numerous approaches for building re-construction from the laser points, such a (Gross et al., 2005, Rot-tensteiner, 2010, Vosselman and Dijkman, 2001). On the other hand, consideration of multiple sensors in order to separate build-ing and vegetation from the DSM, to classify, reconstruct and tex-ture buildings, and to geo-reference the obtained models in the world coordinate frame, can tremendously improve and upgrade the reconstruction results. The work of (Haala, 2005) summarizes different possibilities of sensor data fusion in urban environment.
Recently, (Bulatov et al., 2011a) presented a method that uses frames of a video recorded from a UAV (unmanned aerial vehi-cle) over urban terrain, taken from the almost-nadir perspective in
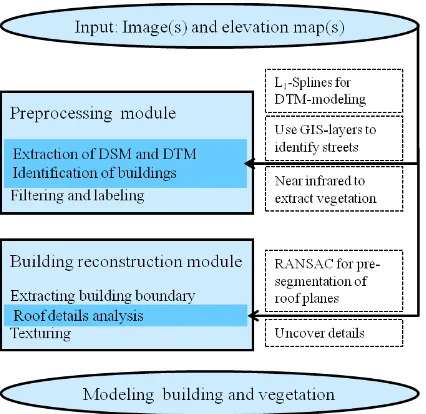
a moderate height. Exploiting a high redundancy of observations, the authors first compute multi-view depth maps, or equivalently, 3D coordinates for a dense set of pixels. These 3D points can again be interpreted as elevation functionz(x, y). From these not necessarily geo-referenced DSMs (Digital Surface Model), it is then possible to extract DTM (Digital Terrain Model), such as the difference between DSM and DSM filtered by area (outliers) and height (cars, bridges) either corresponds to buildings or veg-etation. Then, the elevated regions are separated into buildings and vegetation and the reconstruction of buildings is performed (see Fig. 1). The procedure not only uses a combination of el-evation and image information, but also concerns integration of other sources into the algorithm. For example, registration with a geo-referenced orthophoto for geo-information applications was carried out. Another example is presented in case of several avail-able 3D-points. In (Bulatov et al., 2011b, Bulatov et al., 2011a), these were automatically computed correspondences of charac-teristic features in images, but, of course, a sparse set of ALS points or manually measured ground control points can be con-sidered as well. By means of atriangle-based smoothness term
and identification ofsurface consistenttriangles, their depth val-ues were propagated to their neighbors in order to discard outliers in homogeneously textured regions within triangles that coincide with the surface.
not faced in (Bulatov et al., 2011a): 1) Is the presented method also suitable for data-sets that are different from UAV-videos (pri-marily, traditionally used large scale aerial images, with disad-vantages of reduced redundancy and limited resolution) and 2) How good are reconstruction results quantitatively? This eval-uation is carried out in Sec. 4. Concluding remarks as well as directions for future research are provided in Sec. 5.
Figure 1: Essential steps of the algorithm. The most important innovations are specified by the dark-blue color and summarized in the boxes on the right.
2 DATA SETS
The first data set stems from a video sequence recorded on an UAV flight over the villageBonnlandin Southern Germany. The camera trajectory and a sparse point cloud were reconstructed (Bulatov, 2008) and depth maps from 23 (reference) frames of the sequence were generated with the method (Bulatov et al., 2011b). For DSM computation, thez-coordinates the thus ob-tained 3D points are projected into the rasterizedxy-grid in order to obtain a uniquez-value for each grid cell. This is done by considering the median value of all thesez-values. The same procedure can be considered for the rgb-values; however, since a digital orthophoto of a part of the scene is available, we over-wrote the overlapped region of the synthetic image by the bilin-early interpolated rgb-values of the (registered) orthophoto, see Fig. 2, left. The resulting image will be denoted as ourreference image, that is, the elevation value of almost every cell is avail-able (Fig. 2, right). The size of the reference image is 1096×713 which corresponds to the GSD of approximately 0.1m. For build-ing extraction, the procedure described in Sec. 3 is applied on the resulting DSM.
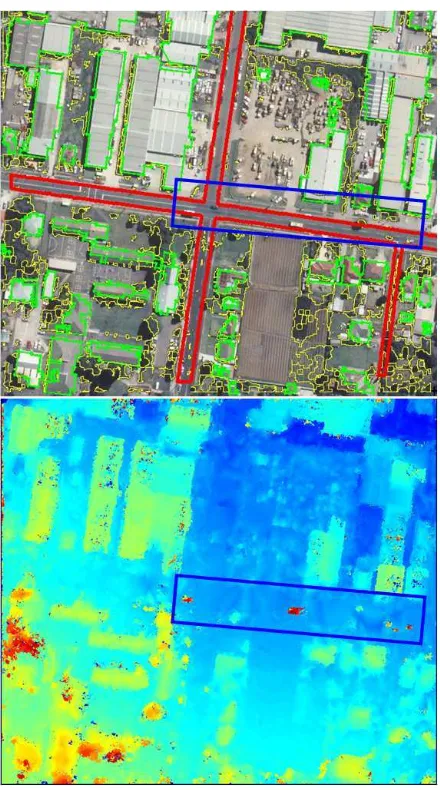
The second data set was captured over the town of Fairfield, NSW (Australia). It consisted of three overlapping analogue RGB true color aerial images scanned at a resolution of 0.15m. The image scale was 1:11000, which corresponds to a GSD (ground sam-pling distance) of 0.17m. Camera orientations were available as well. The focal length of the camera and the flying height above ground were 310mm and 3400m, respectively. The quality of these scanned images for pixel matching was very challenging because of changes of shadows, illumination and resolution, as one can see in Fig. 3, top. The corresponding elevation map was computed from the depth map and the equation (3) of (Bulatov et al., 2011b). It is shown in Fig. 3, bottom.
The third test site is test area 3 of the ISPRS WG III/4 bench-mark on object detection (ISPRS, 2012). It is a purely residential area in the city of Vaihingen (Germany), containing 56 small and detached houses and many trees. The flying height was 800m above ground and the focal length was 120mm. Seven slightly down-sampled 16 bit pan-sharpened color infrared images (see Fig. 4, left) with a (GSD) of 8cm were used to compute the depth and the elevation map (Fig. 4, middle). Also here, because of temporal differences from image to image, additional problems are made up by changes in the scene (cars and shadows). An-other particular challenge here is a high building density, so that is it hard to separate buildings and roof details from each other and preserve topology. On the right of Fig. 4, we visualized the ground truth on roof plane segmentation available from (ISPRS, 2012). One can see that the reference is very detailed; its 235 roof planes contain all dormers and even chimneys.
Figure 2: Left: Reference image with building outlines (green) and vegetation areas (yellow) obtained by our method for the data setBonnland. Right: the corresponding elevation map.
3 PROPOSED METHOD
For all three data sets, we have as input the elevation map that was computed from one or several depth maps. For completeness, we describe in Sec. 3.1 the main steps of our algorithm, which con-sists, as indicated in the flow-chart of Fig. 1, of thepreprocessing moduleand thebuilding reconstruction module. However, we will mostly focus on its methodological innovations that are also specified in Fig. 1. In Sec. 3.2, we present two additional sources that help to obtain better results in the preprocessing module. The information about streets can be extracted from free geographic data and applied for reducing the number of false alarms that are caused by moving vehicles. Additionally, making use of the near infrared channel allows a better separation of buildings and veg-etation among elevated regions.
3.1 Overview of the algorithm
Figure 3: Top: Reference image with with building outlines (green), vegetation areas (yellow) obtained by our method as well as streets outlines (red) provided by means of the GIS for the data setFairfield. Bottom: the corresponding DSM computed from three images without laser points. The moving objects, which end up as outliers in the depth map, are surrounded by the blue rectangle.
Figure 4: Left: Reference image with building interiors (green) and vegetation areas (yellow) obtained by our method for the data setVaihingen. The red channel of the 16-bit image on the left cor-responds to the near-infrared channel. Middle: the corresponding elevation map computed from seven images. Right: Ground truth result on roof plane segmentation, see Sec. 4.
absence of the near infrared channel, the separation of buildings and vegetation starts by identification of isolated trees from aerial images and elevation maps. In (Bulatov et al., 2011a), it was proposed to detect straight lines (Burns et al., 1986) in the refer-ence image within every elevated region and then to divide sum of their squared lengths by the area of the corresponding region. Thislineness measureis low for isolated trees because a large amount of straight line segments can mostly be detected in man-made objects only. In order to generalize this method for the most challenging kind of regions, that is, buildings partly occluded by trees, the RGB-values of the isolated trees were used as train-ing data and propagated over the whole image. In the putative areas of vegetation, the values of the DSM are excluded from consideration for the building reconstruction procedure. Finally, after suppression of false alarms by filtering elevated regions by their altitude, area, and elongation, the remaining (labeled) re-gions of the difference image between the DSM and the DTM are our buildings hypothesis.
Figure 5: Building reconstruction procedure. From left to right: Fragment of the rgb-image; building outline approximation with minimal bounding rectangle indicated in brown; RANSAC-based pre-segmentation of roof planes where different colors code in-formation about normal vectors and the edges of the polygons show how the building was subdivided; 3D-polygon with the building roof textured by the reference image.
3.2 Sensor data fusion
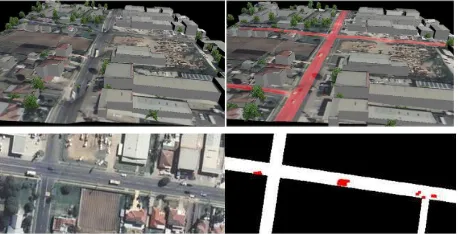
3.2.1 Free geographic data Especially in the data set Fair-field, the presence of moving objects (cars), deteriorates the re-construction results. They not only can hardly be filtered out be-cause of a small number of images, but they also move in the di-rection of epipolar lines. As a consequence, depth values within whole regions cannot be estimated correctly. To discard these mismatches, we developed a three-step procedure that consists of exploiting the GIS data for identification of main roads, registra-tion of images and correcregistra-tion of the DTM in the areas of main roads. TheOpenStreetMap communitycreates and provides free geographic data for huge areas in the world, such that the detailed maps of a high quality are available for image analysis tasks. The map format provides a tag structure allowing to describe a wide variety of map features. Thus it is possible to extract street maps for an area of interest described by the both edge coordinates. The extracted osm-map is then exported to a shape file for fur-ther evaluation by the OSM2SHP converter. The second step be-gins by a registration of the reference image and the image cor-responding to the mask matrix (in our case, it was a GOOGLE-Earth image). A2D-homographyis a suitable model for regis-tration of the GOOGLE-Earth and the RGB-image in case of an almost Nadir view. If the elevation map is not geo-referenced, the homography can be automatically obtained by the DLT-algorithm (Hartley and Zisserman, 2000) from at least four corresponding points; however, these points should stem from a matching oper-ator that is invariant against radiometric changes – e. g., (Shecht-man and Irani, 2007). Alternatively, interactive selection of some 4-7 correspondences can be considered. In the last step, gross er-rors are eliminated by means of the assumption that streets are – at least locally – planar. The reference image is then subdivided into rectangles. In each rectangle, all pixels that correspond to the streets are identified. A plane is computed through the cor-responding 3D points via RANSAC (Fischler and Bolles, 1981) with a generously selected threshold (in order to obtain a possible large set of inliers and to save computing time). Finally, all out-liers are projected into the plane and all further calculations are carried out for the modified elevation image (Fig. 6, top). The ap-proach described above has an additional output: those regions, where outliers form larger areas, usually correspond to the mov-ing vehicles and their shadows, see Fig. 6, bottom.
Figure 6: Top left: part of the model view for the data-set Fair-field; model was generated from the depth map of Fig. 3, right. Outliers caused by moving object are clearly visible. Right: sim-ilar view of the improved model; pixel belonging to street have been identified by means of GIS data and are marked in pink. Bottom left and right: Deviations between the original and the corrected DSM provide alarms about moving objects. After ap-plying some morphological operations, several moving vehicles have been detected.
3.2.2 Near infrared Generally, the performance of the sec-ond preprocessing module of Sec. 3 is better when illumination
conditions are favorable and also when the trees have only few characteristics colors; for instance, in case of leafless trees in winter, the characteristic colors of the elevated regions mostly coincide with the background and are therefore not reliable. In our data sets, this method works well for the data setBonnland
and moderately for the data setFairfield, where false positives are reported from shadowy areas. For the data setVaihingen, it is possible to use the near infrared channel and pixel’s vegeta-tion index in order to identify vegetavegeta-tion. All pixelsxthat satisfy the the empirical conditionmin(r(x)/g(x), r(x)/b(x))>1.75
were declared as tree-like pixels. For larger elevated tree-like re-gions, tree models are added to the final result as described in (Bulatov et al., 2011a) and shown in Figs. 9 and 10.
4 RESULTS
4.1 Building detection for the data set Vaihingen
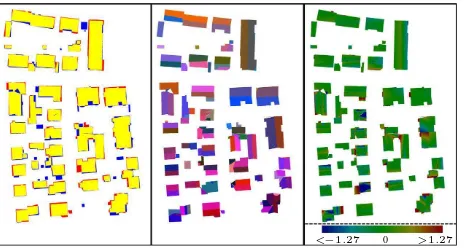
The quantitative evaluation of the results of building detection in area 3 of the data setVaihingenwas carried out using the method-ology described in (Rutzinger et al., 2009). This method is based on a comparison of two label images corresponding to the de-tection results and to the reference, respectively. After a corre-spondence analysis, a topological clarification is carried out. Af-ter that, the completeness, the correctness, and the quality of the building detection results are determined both on a per-area level and on a per-object level. We also compute the RMS errors of planimetric distances between the points of the extracted build-ing boundaries and their nearest correspondences on the reference outline; to remove the impact of outliers, only distances smaller than 3m were used for computing the RMS error. For the object-level evaluation, a building was considered to be a true positive if at least 50% of its area was covered by a building in the other data set. The pixel-based evaluation of our building detection results is depicted in Fig. 7 top. The area-based and object-based quality metrics are shown in Table 1.
A visual inspection of Fig. 7, left, shows that the majority of the buildings is correctly detected. A few buildings are missed (actu-ally, most of them are garages), and there are also spurious classi-fications at the building outlines (this can be partly explained by uncertainties in the depth maps in the shadowy areas near larger buildings, partly by a too coarse threshold for building general-ization, i. e. removing too small rectangular subparts of the first step in Sec. 3.1). These errors at the building outlines are also confirmed by the RMS errors of the outlines of 1.17m, which is almost a factor 15 worse than the GSD of the images. The per-area quality measures in Table 1 show that nevertheless 89.0% of the building area in the reference are correctly detected, whereas 86.9% of the detected building area corresponds to a building in the reference. However, the false positive areas correspond to ex-isting buildings whose size is overestimated. This is shown by the per-building correctness, which is 100%: There are no false posi-tive buildings. The per-building completeness is somewhat lower than the per-pixel value, achieving 78.6%. Figure 8, left, shows why this is the case: the completeness on a per-building level de-pends on the area covered by the buildings. Our method could detect all buildings larger than 75m2, but as the building area de-creases, fewer and fewer buildings can be detected. This analysis shows that our method is capable of reliably detecting the major buildings in complex environments, though the geometrical ac-curacy is somewhat lower than could be expected given the GSD of the input data.
4.2 Building reconstruction for the data set Vaihingen
an adaptation of the method used for the evaluation of building detection. Again, an overlap analysis of two label images cor-responding to the roof plane segmentation and the reference, re-spectively, was carried out (Fig. 7, middle). In this case, the topol-ogy of the extracted roof planes was not adapted to the topoltopol-ogy of the reference, but indicators for over- and under-segmentation were reported. We also evaluated the completeness and the cor-rectness on a per-roof-plane basis, counting a roof plane as a true positive if at least 50% of its area corresponded to roof planes in the other data set. RMS errors in planimetry were determined in the same way as for the building outlines. In addition, we evaluated the height accuracy by computing the RMS error of heights of corresponding positions in planes in two ways: the value RMSZ1takes into account any position where a reference plane overlaps with any extracted roof plane, whereas RMSZ2 only takes into account the main overlapping plane.
<−1.27 0 >1.27
Figure 7: Left: Evaluation of the building detection results on a per-pixel level for the data setVaihingen. Yellow color denotes true positive pixels. Red color denotes false positive pixels and blue false negative pixels. Middle: Result of the plain segmen-tation obtained by our method, to be compared to Fig. 4, right. Right: Absolute difference between ground truth and the DSM obtained after building reconstruction algorithm.
Table 1: Quality metrics of the building detection results. Per-area Per-object Completeness 89.0% 78.6%
Correctness 86.9% 100.0%
Quality 78.5 % 78.6%
The central part of Fig. 7 shows our extraction results, which contain 136 roof planes, whereas the absolute difference of the resulting DSM from the reference is shown on the right. By comparing our results with Fig. 4, right, it becomes clear that for most buildings, the majority of the planes has been recovered, but some of the planes have irregular shapes, and there is both over-segmentation and under-over-segmentation. There were 48 cases of 1:1 relations between reference and extracted planes. The seven instances for 1:M relations and 44 instances of N:1 relations indi-cate an over- and under-segmentation, respectively. Five clusters of roof planes show a N:M relation, where both over- and under-segmentation occur.
The completeness and the correctness of the roof planes were 82.6% and 83.1%, respectively, but the shortcomings again are made up by rather small planes. This can be seen in Fig. 8, right, which illustrates the completeness and the correctness of the roof planes as a function of the area covered by a plane. It shows that in general, planes larger than 60m2are reliably and correctly detected. Planes having an area between 30 and 60m2 are still detected to a reasonable degree (completeness and correctness > 80%), but the roof plane segmentation breaks down rather quickly for smaller planes.
The height differences of planimetric distances of the roof bound-ary polygons is illustrated in the right part of Fig. 7. The RMS er-ror is 1.05m, again greater by an order than the GSD. The height error RMSZ1, which measures correspondences between a refer-ence plane and multiple extracted planes, is 0.62m. However, the height error RMSZ2 (determined from the main corresponding planes) is only 0.35 m. This is the height error to be expected for single points if the parallax accuracy is about one image pixel: our method delivers reasonable geometrical accuracies.
Figure 8: Left: Completeness and cumulative completeness of the building detection results (correctness values are not shown because they are all 100%) for the data setVaihingen. The blue curve shows the completeness for buildings having an area indi-cated on the abscissa; the red curve shows the completeness for all buildings having a larger area than the one shown in the ab-scissa. Right: Completeness and correctness of the roof planes as a function of the area covered by a plane.
4.3 Qualitative evaluation of building detection and recon-struction for other data sets
For the data setBonnland, following observation can be made from the comparison of the reconstruction results with the ground truth: All 19 houses covered in at least one of 23 reference image of the sequence were detected and only two exhibit coarse de-viations in the roof structure. Qualitative results showing camera trajectory, DTM, buildings and vegetation are illustrated in Fig. 9. For the data setFairfield, three larger building out of 46 were not detected. Also, one spurious result was caused by a larger car in the parking area. The accuracy of data was not sufficient for a detailed reconstruction of the majority of roof structures and therefore, most buildings of Fig. 3 have one single roof plane.
5 CONCLUSIONS AND FUTURE WORK
We presented in this paper a robust, straight-forward and almost fully-automatic (with exception of the parameter choice and inte-gration of additional sources of information) algorithm of context-based urban terrain modeling from images and videos. Because its most important component are the high quality depth maps, and as a consequence, additional inputs from original images (e. g results of segmentation information) are not indispensable, it allows obtaining building models for data set of challenging ra-diometric quality In fact, for the testVaihingen, we could show in our detailed analysis that several high resolution images are, in principle, sufficient to detect all larger building and correctly reconstruct (almost) all roof planes. However, consideration of external information sources offers a high potential for additional analysis tasks. We presented an example of OSM, which is mean-while accessible for many locations worldwide and can be used for reduction of false alarms caused by moving vehicles. Addi-tionally, near infrared data greatly simplifies the task of separat-ing buildseparat-ings from vegetation.
to extract too big plane segments (oversegmentation). Moreover, because of ghost planes, application of RANSAC is still prob-lematic in dense building regions. In the future, we will consider the alternatives for building subdivision towards plane hypothe-sis choice supported by neighborhood information. In addition, it will be important to increase the grade of automation with respect to consideration of exterior sources of information and choice of necessary parameters. As for the performance evaluation, direct comparisons of the proposed method with competing procedures, e. g. (Rottensteiner, 2010), are currently being carried out.
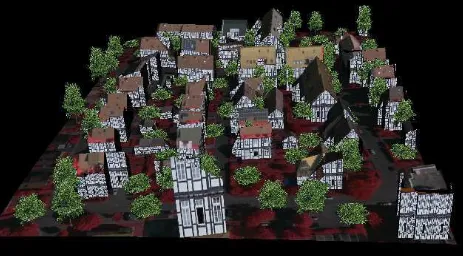
Figure 9: A view of the textured model from the data set Bonn-land. Camera positions corresponding to the reference images are depicted by red viewing cones while the image on the left of Fig. 2 is used to texture the terrain and building roofs. A typical facade for the region is used to texture building walls. The trees are modeled in the elevated tree-like pixel areas of Fig. 2.
Figure 10: Reconstruction result for the data setVaihingen.
ACKNOWLEDGEMENTS
The Fairfield images and orientations are courtesy of AAM Hatch, Mt Colah, NSW 2079, Australia (www.aamhatch.com.au) and Sinclair Knight Merz. TheVaihingendata set was provided by the German Society for Photogrammetry, Remote Sensing and Geoinformation (DGPF), (Cramer, 2010), http://www.ifp.uni-stuttgart.de/dgpf/DKEP-Allg.html. The reference forVaihingen
was generated by RAG (Spreckels et al., 2010) and SIRADEL (www.siradel.com).
REFERENCES
Baillard, C. and Zisserman, A., 2000. A plane-sweep strategy for the 3D reconstruction of buildings from multiple images. ISPRS Congress and Exhibition in Amsterdam (Netherlands).
Bulatov, D., 2008. Towards Euclidean reconstruction from video sequences. Int. Conf. Computer Vision Theory and Applications (2) pp. 476–483.
Bulatov, D. and Lavery, J., 2010. Reconstruction and texturing of 3D urban terrain from uncalibrated monocular images using L1Splines. Photogrammetric Engineering and Remote Sensing 75(10), pp. 439–450.
Bulatov, D., Solbrig, P., Gross, H., Wernerus, P., Repasi, E. and Heipke, C., 2011a. Context based urban-terrain reconstruc-tion from m(uav)-videos for geo-informareconstruc-tion applicareconstruc-tions. Un-manned Aerial Vehicle in Geomatics Conference, Vol. XXXVIII-1/C22,ISSN pp. 1682–1777.
Bulatov, D., Wernerus, P. and Heipke, C., 2011b. Multi-view dense matching supported by triangular meshes. ISPRS Journal of Photogrammetry and Remote Sensing 66(6), pp. 907–918.
Burns, J., Hanson, A. and Riseman, E., 1986. Extracting straight lines. Transactions on Pattern Analysis and Machine Intelligence 8(4), pp. 425–455.
Cramer, M., 2010. The dgpf test on digital aerial camera evalu-ation - overview and test design. Photogrammetrie – Fernerkun-dung – Geoinformation 2, pp. 73–82.
Fischler, M. and Bolles, R., 1981. Random sample consensus: A paradigm for model fitting with applications to image analysis and automated cartography. Commun. ACM pp. 381–395.
Fischer, A., Kolbe, T., Lang, F., Cremers, A., F¨orstner, W., Pl¨umer, L. and Steinhage, V., 1998. Extracting buildings from aerial images using hierarchical aggregation in 2D and 3D. Com-puter Vision and Image Understanding 72(2), pp. 185–203.
Gross, H., Th¨onnessen, U. and v. Hansen, W., 2005. 3D-Modeling of urban structures. Joint Workshop of ISPRS/DAGM Object Extraction for 3D City Models, Road Databases, and Traf-fic Monitoring CMRT05, Int. Arch. of Photogrammetry and Re-mote Sensing 36, Part 3W24, pp. 137–142.
Haala, N., 2005. Multi-Sensor-Photogrammetrie – Vision oder Wirklichkeit? Habilitation, Deutsche Geod¨atische Kommission, M¨unchen.
Hartley, R. and Zisserman, A., 2000. Multiple view geometry in computer vision. Cambridge University Press.
Hendricsson, O., 2005. Multi-Sensor-Photogrammetrie – Vision oder Wirklichkeit? Habilitation, Deutsche Geod¨atische Kommis-sion, M¨unchen.
ISPRS, 2012. ISPRS test project on 3D building reconstruction. http://www.commission3.isprs.org/wg4/.
Rottensteiner, F., 2010. Roof plane segmentation by combin-ing multiple images and point clouds. Proc. of Photogrammetric Computer Vision and Image Analysis Conference, Int. Arch. of Photogrammetry and Remote Sensing 38, Part 3A, pp. 245–250.
Rutzinger, M., Rottensteiner, F. and Pfeiffer, N., 2009. A com-parison of evaluation techniques for building extraction from air-borne laser scanning. IEEE Journal of Selected Topics in Quan-tum Electronics 2/1, pp. 11–20.
Shechtman, E. and Irani, M., 2007. Matching local self-similarities across images and videos. 2007 IEEE Computer So-ciety Conference on Computer Vision and Pattern Recognition (CVPR 2007), 18-23 June 2007, Minneapolis, Minnesota, USA.
Spreckels, V., Syrek, L. and Schlienkamp, A., 2010. DGPF project: evaluation of digital photogrammetric camera systems – stereoplotting. Photogrammetrie – Fernerkundung – Geoinfor-mation 2, pp. 117–130.
Vosselman, G. and Dijkman, S., 2001. 3D Building model recon-struction from point clouds and ground plans. Int. Arch. of the Photogrammetry, Remote Sensing and Spatial Information Sci-ences 34, part 3/W4, pp. 37–44.