www.elsevier.com / locate / livprodsci
Genetic correlations of somatic cell count and conformation
traits with herd life in dairy breeds, with an application to
national genetic evaluations for herd life in the United
Kingdom
*
R.A. Mrode , G.J.T. Swanson, C.M. Lindberg
Animal Data Centre Ltd., Fox Talbot House, Greenways Business Park, Bellinger Close, Chippenham, Wiltshire SN15 1BN, UK
Received 28 April 1999; received in revised form 21 October 1999; accepted 2 November 1999
Abstract
Genetic correlations (r ) between Lifespan (LS) and conformation traits in the Ayrshire breed were obtained from data ong 8087 heifers which calved between 1976 and August 1990. The r were estimated from a series of multivariate analysesg
applying an animal model restricted maximum-likelihood procedure. The genetic relationship between LS and somatic cell counts (SCC) was studied in the Holstein Friesian (HF), Ayrshire (AYR) and Jersey (JER) breeds. Estimates of r betweeng
LS and SCC were obtained from a bivariate analysis fitting a sire model. The four type traits with the largest r with LSg were foot angle (0.47), udder depth (0.46), fore udder attachment (0.28) and teat length (20.28). The estimates of rg
between LS and SCC varied from 20.32 (HF) to 20.11 (JER); higher SCC resulted in lower herd life. Genetic evaluation for LS in the United Kingdom involves a bivariate analysis utilising direct lactation information and indirect information from conformation traits. The design matrices for the direct and indirect traits are different and either trait could be missing. A computing strategy implemented for the national evaluation of herd life that handles these problems is presented in addition to the results from the first official evaluation. Bull predicted transmitting abilities (PTAs) for LS ranged from 20.8 to 1.4 lactations; most bull PTAs were within the range of60.5 lactations. The predicted difference in LS is about one lactation between daughters of extreme bulls when those with at least ten daughters were considered. A slight positive genetic trend was observed for LS in all breeds. 2000 Elsevier Science B.V. All rights reserved.
Keywords: Lifespan; Conformation traits; Somatic cell count; Canonical transformation; Dairy cattle
1. Introduction has a major impact on net returns in dairy pro-duction. The benefit of improved herd life on farm
Herd life which reflects the cow’s productive life includes a reduction in replacement costs and
im-proved average yields from a higher proportion of mature, higher yielding cows in the milking herd
*Corresponding author. Tel.: 144-1249-467-272; fax: 1
44-(Rendel and Robertson, 1950).
1249-467-273.
E-mail address: [email protected] (R.A. Mrode) A problem with selection for improved herd life is
that direct information is not available early in life, ment, udder depth and teat length. In other dairy
as a cow must be given time to complete lactations breeds, apart from Ayrshire (AYR), recording
or be culled from the herd. In order to obtain early schemes for conformation traits have not been
genetic evaluations for herd life, researchers have running for a long enough period to enable similar
examined procedures for prediction of breeding analyses to be carried out.
values based not only on complete herd life in- Dekkers (1993) indicated that herd life corrected
formation but also on partial herd life information on for production or functional herd life is a better
cows which are still alive. Van Raden and Klaas-Kate measure of involuntary culling. LS is a measure of
(1993) predicted completed herd life records for functional herd life since it is adjusted for first
cows still alive in the herd and applied a lower lactation milk yield (Brotherstone et al., 1997) and
weight on the projected records in the genetic therefore reflects the ability of the cow to withstand
evaluation system using an animal model. However, involuntary culling. SCC is used as an indirect
Ducrocq et al. (1988) and Ducrocq and Solkner measure of mastitis in the UK (Mrode et al., 1998).
(1998) presented a non-linear approach to survival Reduction in the rate of mastitis incidence through
analysis based on the Weibull hazard function with selection on SCC should result in a reduction in
records of cows still alive in the herd treated as involuntary culling and hence improvements in
censored observations. Jairath et al. (1998) adopted a functional herd life. Preferably both SCC and LS
multivariate approach with survival in the first three should be included in an index to improve herd life.
lactations regarded as different traits. A major advan- The construction of such an index requires
knowl-tage of this multivariate approach and the non-linear edge of the genetic relationship between both traits
survival analysis is that they allow for the inclusion and this is examined in this study.
of time-dependent systematic environmental effects As Brotherstone et al. (1997) indicated, the
op-such as production and herd–year–season to be timum use of LS and conformation traits in the
associated with each lactation in the models for genetic evaluation of herd life would require the use
genetic evaluation. From the study of Vollema and of a multivariate animal model. Initial test runs on a
Groen (1998) that compared heritabilities and subset of the national data of a million cows with
evaluations from a linear model and survival analy- records took about 84 h of computing time
imple-sis, the major benefit of the survival analysis was its menting a bivariate analysis involving LS and a
ability to handle censored as well as uncensored phenotypic index formed by combining the four type
records. traits most highly correlated with herd life (Mrode
In addition to partial herd life information on live and Swanson, 1998). In conclusion, on a national
cows, correlated conformation traits have been used scale, the implementation of such a multivariate
to obtain early genetic evaluations for herd life and analysis would be impractical in terms of computing
to improve its accuracy (Vollema, 1998). In the time. However, the multivariate analysis could be
United Kingdom (UK) initial predictions of breeding simplified by the application of a canonical
trans-values for herd life were based on indirect estimation formation, but the traits are associated with different
from four conformation traits. These were not pub- fixed effects and there is also the potential problem
lished as such but incorporated in a selection index of missing observations. Ducrocq and Besbes (1993)
together with production (Veerkamp et al., 1995). proposed an algorithm that could be utilised to
However, Brotherstone et al. (1997) proposed a handle traits with different design matrices and also
direct measure of herd life called Lifespan (LS), missing observations when a canonical
transforma-which accounts for the number of lactations each tion is applied.
cow had completed or was expected to complete The objectives of this paper are three-fold. Firstly
based on average population probabilities. From to estimate the genetic correlations between LS and
analyses using LS and conformation data for the HF the conformation traits in the AYR breed to
de-breed, they recommended that genetic evaluation for termine whether similar traits were associated with
herd life in the UK should be based on LS and four LS as in the Holstein breed. In practice decisions
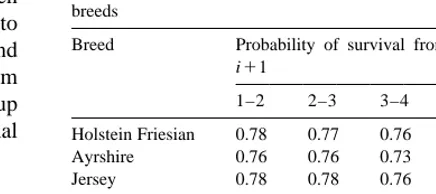
Table 1
over all dairy breeds despite the lack of conformation
The probability of survival from lactation i to i11 in the different
data. Secondly to estimate the association between
breeds
LS and SCC in some dairy breeds with a view to
Breed Probability of survival from lactation i to
proposing improvements to the National Index and
i11
finally to report the application of the algorithm
1–2 2–3 3–4 4–5 .5
proposed by Ducrocq and Besbes (1993) to speed up
the production of LS evaluations on a large national Holstein Friesian 0.78 0.77 0.76 0.73 0.73
Ayrshire 0.76 0.76 0.73 0.71 0.71
data set.
Jersey 0.78 0.78 0.76 0.73 0.73
Guernsey 0.77 0.77 0.74 0.74 0.74 Shorthorn 0.76 0.75 0.73 0.72 0.72
2. Materials and method
range of LS for the HF breed, for instance, was from 2.1. Genetic correlations between LS and
1 lactation (completed first lactation and then culled) conformation traits using AYR data.
to 7.703 lactations (completed 5th lactation and still alive).
To examine the relationship between LS and
Records for conformation traits obtained during conformation traits in the AYR breed, lactation
the first lactation were available on 8087 AYR cows records of heifers calving between 1976 and August
out of 120 063 with LS calculated from survival to 1990 were extracted from the files of Milk Recording
the 4th lactation. The analysis of this data set was Organisations (MRO). The latter date was chosen to
therefore restricted to these 8087 cows with LS ensure all cows had the opportunity to complete four
calculated from actual survival and the conformation lactations. The actual number of lactations a cow has
traits. These were the daughters of 893 sires. The completed was determined by searching the MRO
structure of the data in terms of number of calvings files. A cow was deemed to have completed lactation
per year, number of herds and sires is given in Table n if her lactation n and all previous lactation records
2. A pedigree of three generations consisting of were found in the files (Brotherstone and Hill, 1991).
18 875 animals was utilised in the multivariate Any cow which did not complete a qualifying
analyses. A total of 15 conformation traits were minimum 200 day lactation or transferred into a
available together with LS. It was not possible to non-milk recording herd, was considered not to have
carry out a single animal model multivariate analysis survived. The percentage of cows not completing a
on them all. Therefore four separate animal model qualifying minimum 200 day lactation is about 3%
multivariate analyses, always including LS together within a lactation (Pander, 1992).
with groups of closely associated conformation traits, LS, which represents the number of lactations
were carried out. The groupings were LS and body each animal had survived or was expected to survive,
given that the animal had completed a first lactation,
Table 2
was calculated for each cow on the basis of
prob-Distribution of cows, herds and sires per year of calving for the
ability of survival (Brotherstone et al., 1997). The
Ayrshire data used to estimate genetic correlations between
probabilities of survival from lactations i to i11 up Lifespan and type traits
to the fifth lactation, estimated from completed
Year of calving No. of cows No. of herds No. of sires
lactations for the AYR breed and other breeds
1982 49 17 29
considered later in the study, are given in Table 1.
1983 698 61 212
For instance, if a cow has completed n lactations but
1984 1283 91 318
has not had time to complete n11 lactations, the LS 1985 1027 85 273
was calculated (Brotherstone et al., 1997) as: 1986 1230 89 309
1987 1054 92 271
LS5n1pn1p pn n111p pn n11pn121 ? ? ? 1988 1182 95 275
1989 1302 97 261
Where p is the probability of survival to lactationn
1990 262 71 102
traits (stature, chest width, body depth and angulari- effects with age at first calving as a covariate for
ty), LS and rump, feet and leg traits (rump angle, both traits. First lactation milk yield deviated from
rump width, rear legs side and foot angle), LS and the mean of contemporaries was fitted as a covariate
udder traits (fore-udder attachment, rear udder at- only for LS. The number of records for LS and SCC
tachment, udder cleft and udder depth) and LS and and number of sires represented are shown in Table
teat traits (teat placement rear, teat placement side 3. A sire pedigree of three generations was utilised in
and teat length). the bivariate analysis for each breed.
The fixed effects for LS consisted of herd–year
(HY) and month of first calving. Age at first calving 2.3. Prediction of breeding value for LS
(linear and quadratic) and first lactation milk yield
deviated from the herd–year mean (linear) were Breeding values for LS were predicted in a
fitted as co-variables. The importance of adjusting bivariate best linear unbiased prediction (BLUP)
for milk yield is to ensure that the LS trait reflects analysis of 1 839 878 Holstein Friesian cows born
involuntary culling (Dekkers, 1993). For the con- from 1986 to 1994. In the AYR, JER, Guernsey and
formation traits, the fixed effects were herd–classifi- Shorthorn breeds 156 639, 87 939, 56 886 and
cation visit (HV) and month of first calving. Age at 22 905 cows with observations respectively were
first calving and stage of lactation were fitted as analysed (Table 4). The traits were LS and a
linear and quadratic co-variables. The multivariate phenotypic index (INDEX) of fore-udder attachment,
analyses were carried out using the VCE software foot angle, udder depth and teat length, which were
(Groeneveld, 1993). most highly correlated with herd life (Brotherstone et
al., 1998). The INDEX of four conformation traits
2.2. Genetic correlations between LS and somatic was constructed by applying economic weights to the
cell count phenotypic linear information. Cows with
conforma-tion informaconforma-tion but lacking the opportunity to
Lactation records of heifers calving between 1986 complete a second lactation were included in the
and 1991 for HF and 1976 and 1991 for AYR and analysis but their LS designated as missing
observa-JER were extracted from MRO files. The last year tions. The total number of cows with observations on
for data extract was chosen to ensure all cows had both traits and those that had observations on only
the opportunity to complete four lactations. LS was one of the two traits are given in Table 4.
calculated for each cow as described in the previous A bivariate animal model (BLUP) was
im-section. plemented with a full pedigree relationship file with
First lactation geometric means of test day SCC missing ancestors assigned to groups identified by
(’000 per ml) for heifers calving from 1991 to 1998 date of birth, sex and country of origin. The only
were extracted from the MRO files. In the early random effect was an animal effect. The fixed effects
1990s the number of farmers recording SCC was for LS were as described in the previous section and
limited since it was a new and optional service, those for INDEX are the same as for the individual
consequently only few cows with LS had any SCC conformation traits in the multivariate analyses in
information. The bivariate analysis of SCC and LS Section 2.1. The genetic parameters used for the
was therefore based on a sire model including only sires with at least 20 daughters (HF) or ten daughters
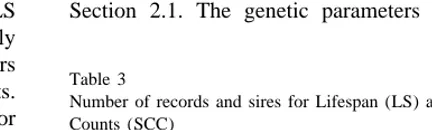
Table 3
(AYR and JER), with records for each of the traits. Number of records and sires for Lifespan (LS) and Somatic Cell
For AYR and JER, sires with ten daughters only for Counts (SCC)
SCC or LS but with at least one paternal half sib
Breed No. of sires No. of records
with ten daughters for the other trait were included.
LS SCC
This implies an error covariance of zero in the
Holstein Friesian 526 434 217 216 465
bivariate analysis. The SCC data were transformed to
Ayrshire 337 23 582 3736
log basis to achieve a normal distribution. Herd–e
Jersey 113 19 775 4046
Table 4
a
Means and standard deviations for Lifespan (LS) and total number of cows with observations for Lifespan, INDEX and both traits for each breed
Breed Total cows Cows with observations for Lifespan
with observations
LS Only INDEX Both LS Mean S.D.
only and INDEX lactations
Holstein /
Friesian 1 839 878 1 382 130 253 179 204 569 4.0 2.4
Ayrshire 156 639 136 928 4555 15 156 3.7 2.5
Jersey 87 939 77 550 5043 5341 4.0 2.6
Guernsey 56 886 50 041 3339 3506 3.9 2.6
Shorthorn 22 905 21 669 392 844 3.8 2.5
a
INDEX, index of survival from fore udder attachment, foot angle, udder depth and teat length.
BLUP analyses for all breeds were those reported for missing observation, the missing value for the ith
the HF data (S. Brotherstone, personal communica- trait ( y ) for the cow was replaced by its expecta-im
tion). These were heritabilities of 0.06 and 0.36 for tion calculated as:
LS and the INDEX respectively and a genetic
(k ) (k ) (k )
ˆ ˆ
correlation of 0.69. For the AYR breed, the conse- yim 5aim 1eim
quences of using HF parameters was verified by
(k )
ˆ ˆ
re-calculating the INDEX based on the genetic Where eim5r /r ( yij ii jo2ajo), k5kth round of
itera-ˆ
correlations between conformation traits and LS tion, aim5breeding value for the ith missing trait on
ˆ
estimated in Section 2.1. The r between this INDEXg the untransformed scale, ajo5breeding value for the
and LS was then estimated from a bivariate analysis jth observed trait on the untransformed scale, yjo5
using the same model and data as described in observed record of jth trait adjusted for solutions of
Section 2.1. Breeding values were re-calculated for fixed effects in the kth round of iteration, r , rii ij5
AYR using these parameters and compared with residual variance for trait i and co-variance for traits
those from the HF parameters. i and j.
The adjusted RHS or estimated missing
observa-2.4. Computing strategy tions (if the cow has any missing records) were then
transformed to a canonical scale and solutions for
The computing strategy adopted involved iterating animals obtained in a univariate manner. As data
on the data such that solutions for all fixed effects were being read, adjusted RHS were accumulated for
and co-variables were obtained using a multivariate minor fixed effects. After all data have been read,
procedure, accounting for missing observations. Ani- solutions for minor fixed effects were obtained using
mal solutions were obtained by applying a canonical the adjusted RHS and the stored inverted coefficient
transformation to adjusted right hand side (RHS). matrix. The iteration process was continued for all
The coefficient matrix for all minor fixed effects (all fixed and animal effects until convergence was
fixed effects apart from HY and HV) and co-vari- achieved.
ables was set up during the first round of iteration, The evaluations were published as predicted
trans-inverted and stored. The solutions for each level of mitting abilities (PTAs), deviated from a fixed base.
HY and HV were obtained as each herd’s data was The base chosen was the average PTA of cows born
read in while adjusting for all other effects in the in 1990, the same definition as the current evaluation
model. To obtain solutions for animals, the RHS for system for production traits. The reliabilities of
each cow was adjusted for the current solutions of PTAs for bulls were calculated by the method
fixed effects and co-variables in the kth round of described by Brotherstone et al. (1998) based on
3. Results the conformation traits varied from 20.28 (TL) to 0.47 (FA). Apart from FA, FUA, ANG, UDS, UDD,
3.1. Genetic relationship between LS and BD and TL, the genetic correlations between LS and
conformation traits in the AYR breed the conformation traits were all below 0.17, with
almost zero genetic correlations observed between
Table 5 shows the conformation traits analysed LS and CW, RA, RW, TPR and TPS. Significantly,
with abbreviations which will be used in the paper the four conformation traits with the largest genetic
together with estimates of heritabilities and the correlations with LS were FA (0.47), UD (0.46),
genetic and phenotypic correlations with LS. The FUA (0.28) and TL (20.28).
heritability of LS averaged over all the multivariate
analyses was low at 0.0660.01. Generally the 3.2. Genetic correlation between LS and SCC
phenotypic correlations between LS and the
con-formation traits were very low, with a maximum The estimates of genetic correlations between LS
correlation of 0.09 with udder depth. and SCC from the bivariate analyses were 20.32
The range of genetic correlations between LS and (0.05) for the HF, 20.28 (0.20) for the AYR and
Table 5
Phenotypic (r ) and genetic (r ) correlations between Conformation traits and Lifespan, along with heritabilities for all traits in the Ayrshirep g breed
2 a
Trait Linear assessment scheme h rp rg
Stature (STA) Very small Very tall 0.55 0.02 0.16
,125 cm .149 cm (0.10)
Chest width (CW) Very narrow Very wide 0.25 0.01 20.08
and strong (0.11)
Body depth (BD) Very shallow Very deep 0.27 0.02 20.19
(0.10)
Angularity (ANG) Very thick Very sharp 0.51 0.06 0.23
and course and angular (0.09)
Rump angle (RA) Pins higher Very low pins 0.27 20.03 20.04
than hips (0.05)
Rump width (RW) Very narrow Very wide 0.38 0.04 0.08
(0.08)
Rear legs side (RLS) Very straight Very sickled 0.27 20.04 20.10
and posty (0.07)
Foot angle (FA) Very low Very steep 0.31 0.05 0.47
(0.10) Fore udder attachment (FUA) Very weak / loose Very strong 0.26 0.10 0.28
and tight (0.09)
Rear udder height (RUH) Very low Very high 0.40 0.06 0.16
(0.08)
Udder support (UDS) Negative cleft, Extreme cleft, 0.09 0.04 0.26
broken support strong support (0.10)
Udder depth (UDD) Level with or Well above 0.22 0.09 0.46
below hock hock (0.08)
Teat placement rear (TPR) Teats on outside Base of teats 0.25 0.05 0.02
of udder almost touching (0.12)
Teat placement side (TPS) Very close Far apart 0.25 0.00 20.04
(0.03)
Teat length (TL) Very short Very long 0.37 20.01 20.28
(0.10)
Lifespan (LS) 0.06
a
20.11 (0.20) for the JER. These results indicate that generally similar considering all bulls and cows
higher SCC resulted in a lower herd life. evaluated. However, higher standard deviations
(0.22) were obtained for bull PTAs when bulls with
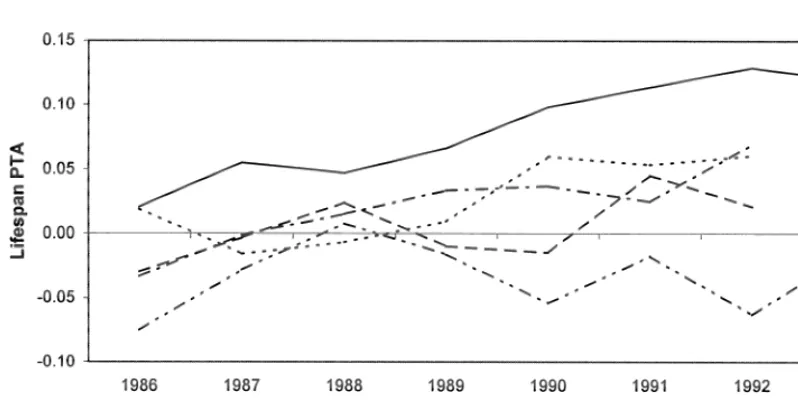
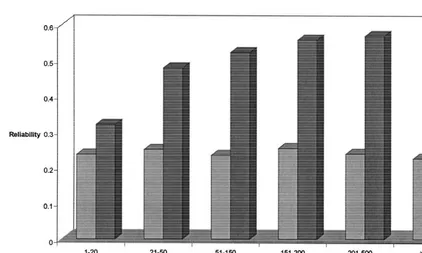
3.3. Genetic evaluation for LS at least 50% reliabilities were considered. Figs. 1 and
2 show the mean PTA plotted by year of birth for
The number of observations together with the bulls with at least 50 daughters and cows,
respective-average number of lactations and standard deviations ly. For all breeds, there was a slight positive genetic
are given for each breed in Table 4. Across breeds trend for LS.
the average LS ranged from 3.8 to 4.0 lactations. The INDEX for the AYR calculated from the
This rather high average number of lactations is due genetic correlations between FA, UD, FUA, TL and
to the fact cows were required to complete a first LS estimated for this breed in Section 2.1 had a
lactation before being included in the evaluation. The heritability of 0.31 compared with 0.36 for HF; and a
highest averages were obtained for HF and JER r of 0.62 with LS compared with 0.69 for HF. Theg
breeds. rank correlation between LS breeding values from
Table 6 gives means, standard deviations and the analysis using these AYR breed parameters and
ranges of LS PTAs and reliabilities for all bulls for the official breeding values based on HF parameters
the different breeds. Similar statistics for cows with was 0.97 for all bulls. The corresponding simple
at least one observation either for LS or INDEX in correlation for cows was 0.99.
the bivariate analysis are presented in Table 7. The The increase in the reliability of bull PTAs with
means for bull PTAs are around zero for all the the inclusion of conformation traits in LS evaluations
breeds and ranged from 20.8 lactations to 1.4 is demonstrated in Figs. 3 and 4 for two categories of
lactations. However, most bull PTAs are in the range bulls. For bulls with LS observations for 1–20
of 60.5 lactations. The means for cow PTAs varied daughters, the reliability of bull PTAs increased
between 0.13 and 0.18 lactations with individual cow linearly with an increase in the number of daughters
PTAs ranging from 20.5 to 1.1 lactations. Within with conformation records. There was an increase of
each breed, the standard deviations of PTAs were about 110% in reliability when there were 201–500
Table 6
Means and standard deviations (S.D.) of bull PTAs and reliabilities for Lifespan
Breed Numbers of Predicted Transmitting Ability (PTA) Reliability bulls evaluated
Average S.D. Min Max Average S.D.
Holstein / Friesian 56 360 0.05 0.14 20.7 1.4 0.27 0.19
Ayrshire 5656 0.05 0.18 20.6 0.9 0.27 0.18
Jersey 3556 20.03 0.20 20.6 0.8 0.26 0.19
Guernsey 1584 0.05 0.15 20.4 0.7 0.28 0.21
Shorthorn 1172 20.05 0.19 20.8 0.6 0.21 0.17
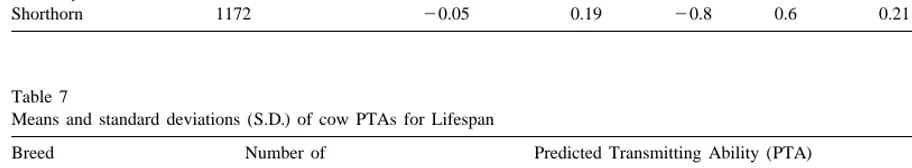
Table 7
Means and standard deviations (S.D.) of cow PTAs for Lifespan
Breed Number of Predicted Transmitting Ability (PTA)
cows evaluated
Average S.D. Min Max
Holstein / Friesian 1 839 878 0.16 0.14 20.5 1.1
Ayrshire 156 639 0.18 0.17 20.7 1.0
Jersey 87 939 0.16 0.21 20.5 1.4
Guernsey 56 886 0.13 0.13 20.5 0.8
Fig. 1. Trend in Lifespan predicted transmitting abilities for bulls.
Fig. 2. Trend in Lifespan predicted transmitting abilities for cows.
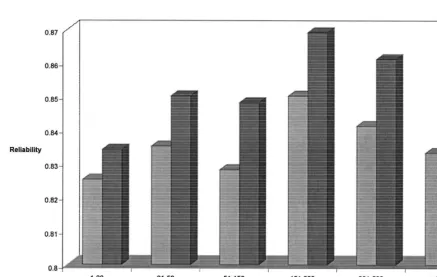
daughters with conformation records. However, for 4. Discussion
bulls with LS records for 201–500 daughters the
increase in reliability with an increase in conforma- The low heritability of 0.06 for LS is in general
Fig. 3. Increase in reliability of predicted transmitting abilities of bulls with Lifespan records for 1–20 daughters with varying numbers of daughters with conformation records.
functional herd life observed in several breeds and and Short and Lawlor (1992) reported r of 0.47 andg
from different methods of estimation. Boldman et al. 0.44, respectively, between udder depth and
func-(1992) reported a lower estimate of 0.03 for func- tional herd life in Holsteins compared with 0.46 in
tional herd life for Holstein grade cows and the this study. The genetic correlations reported by
estimates reported for the Guernsey breed ranged various udder traits and herd life for the Jersey
from 0.02 to 0.05 (Harris et al. 1992). Using a (Rogers et al. 1991a) varied from 0.35 to 1.00, with
restricted maximum-likelihood procedure with an most being higher than obtained in this study. On the
animal model, Vollema and Groen (1998) reported a other hand body traits, in agreement with the results
similar estimate of 0.04 for functional herd life in of Van Doormaal et al. (1985), are poorly correlated
Holstein cows born from 1985 and Brotherstone et with herd life.
al. (1997) the same estimate of 0.06 as obtained in Vollema (1998) indicated no major differences
this study for the Holstein breed in the UK. The between breeds in terms of the relationship between
estimate reported for functional length of productive conformation traits and herd life. However, the
life by Ducrocq et al. (1988) was slightly higher at results from the AYR data indicated a reasonable
0.09 from a survival analysis with a sire model. correlation of 0.23 between angularity and LS in
In common with the results of Brotherstone et al. contrast to a correlation of 20.02 for the HF
(1998), the largest genetic associations were ob- (Brotherstone et al. 1998). Similar to the results for
served between FA, UD, FUA, TL and LS. In the AYR, Klassen et al. (1992) also reported a
general, moderate to high r have been observed ing correlation of 0.44 between angularity and longevity
several studies between udder and teat traits and measured in terms of number of lactations in the
Fig. 4. Increase in reliability of predicted transmitting abilities of bulls with Lifespan records for 201–500 daughters with varying numbers of daughters with conformation records.
One of the main benefits of conformation traits is proofs. Theoretically, Brotherstone et al. (1998),
that they are measured during the first lactation and showed the gain in accuracy in bull progeny tests
can therefore be used as early predictors of LS. For from combining information on conformation and
linear scored conformation traits such as used in this LS. Figs. 3 and 4 demonstrate this gain in a practical
study the direct functional relationship between these sense and indicate much of the gain in accuracy is
traits and LS can be demonstrated; for instance, very for young bulls with no or little direct survival
weak or loose attached fore udders would result in information. However, Brotherstone et al. (1998)
the animal being culled early in life. However, the indicated that Type Merit which was moderately
results of Rogers et al. (1991b) and Mrode et al. correlated with LS and some of the conformation
(1999) seem to indicate an indirect functional rela- traits used to indirectly predict LS, could be used as
tionship between conformation traits and LS through a culling criterion in its own right. If that is the case,
SCC. Both studies obtained negative rg between the rg between herd life and type traits could be
udder traits and SCC, implying selection for higher, biased upwards and hence reliability of indirect sire
more tightly attached udders should lower levels of evaluations based on conformation traits (Essl,
SCC resulting from infections and reduce the rate of 1998).
involuntary culling. Other workers have demonstra- The negative r observed between LS and SCC isg
ted the usefulness of udder traits in addition to SCC consistent with expectation as animals with higher
in reducing incidence of mastitis (De Jong and SCC as a result of infection would be subject to
Lansbergen, 1996). involuntary culling. Presently in the UK, PTAs for
Another benefit of the use of conformation traits in SCC are published but not incorporated into any
an index with production traits in the UK to improve (Van Raden and Klaas-Kate, 1993). The trend was
profitability. However, on the basis of these results, positive for herd life unadjusted for production as
inclusion of SCC in such an index should result in might be expected.
greater accuracy of prediction and hence increase profitability.
The use of bivariate BLUP for the prediction of 5. Conclusions
breeding values for LS ensures the optimum
combi-nation of both direct and indirect information. Mrode The four conformation traits with the largest
and Swanson (1998) have demonstrated advantages genetic correlation with LS in the AYR breed were
of utilising the algorithm presented in this paper over FA, FUA, UD and TL. These were the same traits
a full bivariate analysis. It resulted in a substantial reported to have the largest correlations in the HF
reduction in computing time and is easy to imple- breed. The use of genetic parameters estimated from
ment. However, Ducrocq and Chapuis (1997) have the AYR data set for the genetic evaluation of LS
reported alternative computing strategies involving and construction of the phenotypic index of
con-the application of canonical transformation when formation traits gave similar rankings for bulls and
different models are associated with different traits cows when compared with the official LS
evalua-and missing values are observed. These were not tions based on HF parameters. The decision to use
implemented and could not therefore be compared the HF parameters in other breeds, where it is not
with the algorithm applied in this study in terms of possible to examine the relationship between
con-efficiency. formation and LS due to a lack of data, seemed
The use of INDEX instead of the four individual justified on the basis of the AYR results. A negative
conformation traits has simplified the analysis. genetic correlation between SCC and LS was
ob-Brotherstone et al. (1998) showed little loss in served in all breeds. Thus, as expected, higher SCC
accuracy with the use of the INDEX instead of the resulted in reduced longevity. LS PTAs based on a
four individual conformation traits. Moreover, since bivariate analysis of an index calculated from
con-a linecon-ar con-approcon-ach hcon-as been utilised in the evcon-alucon-ation formation traits and LS obtained from actual survival
procedure, the use of the INDEX should overcome were produced for all breeds. The general range of
problems arising from any non-linear relationship PTAs for most bulls was60.5 lactations. There is a
between any of the conformation traits and LS in positive trend in LS PTAs in all breeds. It is thought
terms of obtaining reliable estimate of r .g that this is due to selection for conformation traits.
The predicted difference in LS from the BLUP LS PTAs have been included together with milk, fat
analysis is about one lactation (60.5 lactations) and protein in a new economic selection index which
between daughters of extreme bulls when bulls with was introduced in the UK in 1999.
at least ten daughters are considered. This is similar to the results of Jairath et al. (1998) for functional herd life in Canada and a preliminary analysis of HF
Acknowledgements
data (Brotherstone et al., 1997). A slight positive genetic trend in LS has been observed in this study.
The authors would like to thank Dr S. Brother-This may be attributed mainly to a correlated
re-stone for useful comments on the manuscript. sponse in LS as a result of improvements in the four
conformation traits used as indirect predictors of longevity. Lindberg et al. (1999), demonstrated
References
positive genetic improvements in these conformation traits in several breeds. Jairath et al. (1998) similarly
Boldman, K.G., Freeman, A.E., Harris, B.L., Kuck, A.L., 1992.
observed a positive genetic trend in direct, indirect
Prediction of sire transmitting abilities for herd life from
and combined herd life. However, for the United transmitting abilities for linear type traits. J. Dairy Sci. 75,
States Holstein population, a small negative trend 552–563.
linear type traits and production: 2 genetic analysis for pedigree Lindberg, C.M., Swanson, G.J.T., Mrode, R.A., 1999. Genetic and non-pedigree cows. Anim Prod 53, 289–297. trends in linear type traits in the United Kingdom (UK) dairy Brotherstone, S., Veerkamp, R.F., Hill, W.G., 1997. Genetic herd. Proc. Br. Soc. Anim. Sci. 1, 118.
parameters for a simple predictor of the lifespan of Holstein Mrode, R.A., Swanson, G.J.T., 1998. Application of canonical Friesian dairy cattle and its relationship to production. Anim. transformation in genetic evaluation of traits with different Sci. 65, 31–37. design matrices and missing values (Vol. 25). In: Proc. 6th Brotherstone, S., Veerkamp, R.F., Hill, W.G., 1998. Predicting World Congress on Genetics Applied to Livestock Production,
breeding values for herd life of Holstein Friesian dairy cattle Armidale, Australia, pp. 601–604.
from Lifespan and type. Anim. Sci. 67, 405–411. Mrode, R.A., Swanson, G.J.T., Winters, M.S., 1998. Genetic De Jong, G., Lansbergen, L., 1996. Udder health index: selection parameters and evaluations for somatic cell counts and its for mastitis resistance. In: Proc. Int. Workshop on Genetic relationship with production and type traits in some dairy Improvement of Functional Traits in Cattle, Gembloux, Bel- breeds in the United Kingdom. Anim. Sci. 66, 569–576. gium, pp. 42–47. Mrode, R.A., Swanson, G.J.T., Lindberg, C.M., 1999. Genetic Dekkers, J.C.M., 1993. Theoretical basis for genetic parameters of relationship between Somatic Cell Count and Lifespan and herd life and effects on response to selection. J. Dairy Sci. 76, conformation traits in some dairy breeds in the United
King-1433–1443. dom (UK). Proc. Br. Soc. Anim. Sci. 1, 48.
Ducrocq, V., Besbes, B., 1993. Solutions of multiple trait animal Pander, B.I. 1992. Genetic studies on test day yields in dairy models with missing data on some traits. J. Anim. Breed. cattle. PhD thesis, University of Edinburgh.
Genet. 110, 81–89. Rendel, J.M., Robertson, A., 1950. Some aspects of longevity in Ducrocq, V., Chapuis, H., 1997. Generalising the use of the dairy cattle. Empire J. Exp. Agric. 18, 49–56.
canonical transformation for the solution of multivariate mixed Rogers, G.W., Hargrove, G.L., Cooper, J.B., Barten, E.P., 1991a. model equations. Genet. Select. Evol. 29, 205–224. Relationships among survival and linear type traits in Jerseys. Ducrocq, V., Solkner, J., 1998. Implementation of a routine J. Dairy Sci. 74, 286–291.
breeding value evaluation for longevity of dairy cows using Rogers, G.W., Hargrove, L. G.L., Lawlor, T.J., Ebersole, J.L., survival analysis techniques. In: Proc. 6th World Congress on 1991b. Correlations among linear type and somatic cell counts. Genetics Applied to Livestock Production (Vol. 23), Armidale, J. Dairy Sci. 74, 1087–1091.
Australia, pp. 359–362. Short, T.H., Lawlor, T.J., 1992. Genetic parameters of conforma-Ducrocq, V., Quaas, R.L., Pollak, E.J., Casella, G., 1988. Length of tion traits, milk yield and herd life in Holsteins. J. Dairy Sci.
productive life of dairy cows. 2. Variance component estimation 25, 1986–1998.
and sire evaluation. J. Dairy Sci. 71, 3071–3079. Van Doormaal, B.J., Schaeffer, L.R., Kennedy, B.W., 1985. Essl, A., 1998. Longevity in dairy cattle breeding: a review. Estimation of genetic parameters for stayability in Canadian
Livest. Prod. Sci. 57, 79–89. Holsteins. J. Dairy Sci. 68, 1763–1769.
Groeneveld, E., 1993. REML VCE — a multivariate multimodel Van Raden, P.M., Klaas-Kate, E.J.H., 1993. Genetic evaluation of restricted maximum likelihood (co) variance component esti- productive life including predicted longevity of live cows. J. mation package. In: Proc. Symp. on Application of Mixed Dairy Sci. 76, 2758–2764.
Linear Models in the Prediction of Genetic Merit of Pigs, May Veerkamp, R.F., Hill, W.G., Stott, A.W., Brotherstone, S., Simm, 27, Germany. G., 1995. Selection for longevity and yield in dairy cows using Harris, B.L., Freeman, A.E., Metzger, E., 1992. Analysis of herd transmitting abilities for type and yield. Anim. Sci. 61, 189–
life in Guernsey dairy cattle. J. Dairy Sci. 75, 2008–2016. 197.
Jairath, L., Dekkers, J.C.M., Schaeffer, L.R., Lui, Z., Burnside, Vollema, A.R., 1998. Longevity of dairy cows: a review of genetic E.B., Kolstad, B., 1998. Genetic evaluations for herd life in variances and covariances with conformation. Anim. Breed. Canada. J. Dairy Sci. 81, 550–562. Abstr. 66, 781–802.
Klassen, D.J., Monardes, H.G., Jairaith, L., Cue, R.I., Hayes, J.F., Vollema, A.R., Groen, A.F., 1998. A comparison of breeding 1992. Genetic correlations between lifetime production and value predictors for longevity using a linear model and survival linearized type in Canadian Holsteins. J. Dairy Sci. 75, 2272– analysis. J. Dairy Sci. 81, 3315–3320.