Full Terms & Conditions of access and use can be found at
http://www.tandfonline.com/action/journalInformation?journalCode=vjeb20
Download by: [Universitas Maritim Raja Ali Haji] Date: 11 January 2016, At: 19:04
Journal of Education for Business
ISSN: 0883-2323 (Print) 1940-3356 (Online) Journal homepage: http://www.tandfonline.com/loi/vjeb20
Student Performance in an Introductory Business
Statistics Course: Does Delivery Mode Matter?
Jonathan Haughton & Alison Kelly
To cite this article: Jonathan Haughton & Alison Kelly (2015) Student Performance in an Introductory Business Statistics Course: Does Delivery Mode Matter?, Journal of Education for Business, 90:1, 31-43, DOI: 10.1080/08832323.2014.968518
To link to this article: http://dx.doi.org/10.1080/08832323.2014.968518
Published online: 06 Nov 2014.
Submit your article to this journal
Article views: 125
View related articles
View Crossmark data
Student Performance in an Introductory Business
Statistics Course: Does Delivery Mode Matter?
Jonathan Haughton and Alison Kelly
Suffolk University, Boston, Massachusetts, USA
Approximately 600 undergraduates completed an introductory business statistics course in 2013 in one of two learning environments at Suffolk University, a mid-sized private university in Boston, Massachusetts. The comparison group completed the course in a traditional classroom-based environment, whereas the treatment group completed the course in a flipped-hybrid environment, viewing lecture material online prior to once-a-week, face-to-face meetings. After controlling for observable differences, students in the hybrid environment performed better on the common final exam; however, there were no significant differences in the final grades or student satisfaction between the two environments.
Keywords: business statistics, hybrid, selection bias, student performance
Concerns about access and quality are among the perennial challenges facing higher education. Greater use of technol-ogy in teaching is widely seen as a promising way of con-trolling costs (and hence potentially improving access), and reducing achievement gaps. Yet, as online and hybrid courses proliferate across college and university campuses, there has been much controversy about the effectiveness of these newer modes of instruction, relative to that of a tradi-tional face-to-face (F2F) format.
In this article, we evaluate whether a flipped hybrid (or blended) model for teaching introductory business statistics performed better or worse than the more traditional class-intensive F2F approach to teaching. By flipped hybrid we mean a model of course delivery where students are required first to study short online videos that present the material, test their understanding with online questions, and then come to a weekly F2F problem-solving class with a professor. Thus students do more prepreparation, and spend half as much time in class, in a flipped hybrid compared with a traditional class. The data come from Suffolk Uni-versity in Boston, a typical medium-sized uniUni-versity where half of all undergraduates take STATS250 (applied statis-tics), and where half of the sections of the course are now delivered as flipped hybrids. Given the importance of courses in introductory business statistics in most
universities, the representative nature of the Suffolk under-graduate body, the relatively large sample size, and our ability to control for many potential influences on perfor-mance, we believe that our results are broadly applicable.
WHY CONSIDER FLIPPED HYBRIDS?
The traditional model of teaching introductory business sta-tistics has been remarkably durable. Typically, students have two or three F2F classes, for a total of 2.5–3 hr, every week. The teacher presents the material, assigns homework exercises, and tests students with quizzes and exams.
A flipped hybrid course departs from the traditional model in two important ways. First, it reverses the sequence; students are first introduced to the substantive material online, and then come to class where the teacher helps clarify points of confusion or difficulty, and adds anecdotes, examples and extensions to the basic analysis. Second, it puts more emphasis on self-directed online activ-ity, and less on spending time in the classroom; typically, there is just a single F2F class per week, with half as much face time with a professor as in the traditional model.
The flipped hybrid model has a number of potential attractions. It may be a very effective approach to teaching introductory business statistics, which has a clear body of concepts and techniques that need to be understood, mas-tered, and applied. Even if hybrids do not work for every-one, they may be well suited to segments of the student
Correspondence should be addressed to Jonathan Haughton, Suffolk University, Department of Economics, 8 Ashburton Place, Boston, MA 02108, USA. E-mail: [email protected]
ISSN: 0883-2323 print / 1940-3356 online DOI: 10.1080/08832323.2014.968518
body (e.g., to students who grasp the material quickly, and do not need to spend as much time in F2F classes), or to stu-dents who need extra time to master the material and for whom one-size-fits-all classes are too short. This would address one of the biggest challenges faced by teachers of statistics, which is the wide dispersion of student aptitude for statistics; the final grade distribution is often bimodal.
As compared to a course offered entirely online, the pro-fessor-student relationship within the classroom remains intact with the hybrid model. When Sebastianelli and Tamimi (2011) assessed the quality of quantitative business courses offered entirely online, they found the features involving professor-student interaction to be the most use-ful. Moreover, in terms of learning the quantitative content, they concluded that discussion forums were of limited value, and features involving student-student interaction were the least useful.
The flipped hybrid model may also be cheaper; by halv-ing the amount of F2F time, the cost of faculty and class-rooms can potentially be halved. On the other hand, there may be substantial up-front costs in creating suitable online materials; faculty may not be willing to teach twice as many students, even if contact hours remain unchanged, given the potentially increased traffic during office hours, a heavier burden of grading, and less satisfying relations with students whom one meets only once a week.
Three other considerations are relevant. Changes in tech-nology have made online materials cheaper, better, and more accessible, so the quality of the online part of a hybrid course has improved compared to even a decade ago. Stu-dents, raised in a more virtual world, may be more receptive to online learning than their parents were, and more faculty members may be comfortable teaching in this way. And whether we like it or not, the flipped hybrid course has become fashionable; before rushing to embrace this peda-gogy, we need to evaluate whether it delivers on its promise.
One of the first studies to gain widespread attention on the effectiveness of online instruction was released in 2009 (and updated in 2010) by the U.S. Department of Education (DOE) (Means, Toyama, Murphy, Bakia, & Jones, 2010). This study, a meta-analysis of the then-available research on online learning, found that online courses were more effective at satisfying learning outcomes as compared to F2F courses, with a hybrid format having the largest benefits of all. However, the methodology used by the DOE study has been criticized on a number of fronts: most importantly, none of the studies in the meta-analysis included randomly-assigned students taking a full-term course in settings that could be directly compared (i.e., sim-ilar instructional materials by the same instructor, or a stan-dardized course). Moreover, only seven of the 45 studies in the DOE meta-analysis—already chosen from 1,132 studies published between 1996 and 2008 on the basis of their rigor—involved undergraduate or graduate students
enrolled in semester-long courses, and these seven studies found no significant differences in outcomes between online and F2F formats. A more recent survey by Lack (2013) identified about 30 subsequent relevant and accept-ably rigorous studies, and concluded that “the literature. . . yields little, if any, evidence to suggest that online or hybrid learning, on average, is more or less effective than face-to-face learning” (p. 10).
As noted by Lack (2013), few studies control for pre-existing effects when measuring the impact of online courses. Lam (2009) used regression analysis to assess stu-dent performance in traditional and online formats of an undergraduate computer programming course. She found that delivery mode had no significant effect on student per-formance, and that cumulative grade point average (GPA) was the only significant predictor. Ary and Brune (2011) compared learning outcomes in traditional and online for-mats of a personal finance course. Their regression results suggested that the delivery mode did not significantly influ-ence course averages, but the percentage change in scores between pre- and posttests was significantly higher for the traditional format.
Wilson and Allen (2011) assessed the success rates of F2F and online students in two different business courses. They found that withdrawal rates and failure rates were not significantly different between the two modes of course delivery. They too concluded that cumulative GPA was the greatest predictor of course grade, regardless of delivery mode. Driscoll, Jicha, Hunt, Tichavsky, and Thompson (2012) compared student performance and satisfaction between F2F and online sections of an introductory sociol-ogy course that was taught by one instructor over multiple terms with very little change in course materials and assess-ments. They found no significant difference in student per-formance or student satisfaction between the two different formats. The articles by Lam (2009), Ary and Brune (2011), Wilson and Allen (2014), and Driscoll et al. (2012) all included controls for a number of background character-istics and/or other predictor variables; however, these stud-ies were quasiexperimental in that they did not assign students randomly to F2F or online courses. Randomiza-tion, which would be required to avoid self-selection bias, is difficult to implement on college campuses for a variety of reasons, including Institutional Review Board require-ments, some students’ reluctance to comply with their ran-dom assignments, and logistical issues related to the scheduling of classes.
Figlio, Rush, and Yin (2010) conducted an experiment in which students were randomly assigned to either a F2F or online section of a principles of microeconomics course taught by one instructor. The only difference between these sections was the mode of delivery: students either attended live lectures, or watched these same lectures in an Internet setting. All other ancillaries for the class, such as problem sets and exams, were the same. A simple means comparison
over three exams showed that students performed better in the live setting as opposed to the online setting, but the dif-ferences were not statistically significant. When Figlio et al. controlled for student race–ethnicity, sex, and prior achievement levels, they found that test scores were signifi-cantly higher for Hispanic students, male students, and low-achieving students in the case of live lectures.
In a recent study, Joyce, Crockett, Jaeger, Altindag, ad O’Connell (2014) were successful in randomly assigning 725 students at Baruch College in New York into large hybrid and traditional classes in introductory microeconomics. Two pro-fessors taught both the hybrid and traditional classes, and stu-dents in both types of classes had access to the same online materials and had to take weekly quizzes covering material posted online, so even the traditional classes had strong hybrid elements. Thus the main practical difference was that the stu-dents in the traditional classes had twice as much class time as those in the hybrid sections. The key finding was that students in the hybrid classes scored about 2.5 percentage points less than their peers in the traditional classes, indicating that time in class does matter, although perhaps not by enough to justify the higher cost.
Bowen, Chingos, Lack, and Nygren (2012) conducted an ambitious semirandomized study assigning 605 students on six public college campuses to take either a traditional or hybrid version of an introductory statistics class.1 The hybrid course used a prototype machine-guided mode of instruction developed at Carnegie Mellon University in concert with one F2F meeting each week. The authors found no statistically significant differences in learning out-comes between students in the traditional- and hybrid-for-mat sections.
THE RELEVANCE OF STATS250
The results of the Bowen et al. (2012) study are important and useful, but we are interested in knowing whether they still apply when the online instruction does not use the Carnegie Mellon prototype, when hybrid courses are expanded to a larger proportion of the class, and when hybrid courses become a banal part of the curriculum and the initial novelty wears off. The case of the introductory business statistics course at Suffolk University (STATS250) allows us to address these issues, and thus is relevant for a wide swath of univer-sity-level business statistics courses in the United States.
Every semester, between 250 and 300 students, three fifths of them sophomores, enroll in STATS250. The four-credit course is required of students in business-related dis-ciplines and economics, but attracts significant numbers of students from other fields, and over half of all undergradu-ates take the course at some point.2Up and until the fall semester of 2012, STATS250 was taught in a traditional format, with about 10–12 sections per semester capped at 30 students each. Two flipped hybrid sections were
introduced in the spring of 2013, capped at 25 students each, alongside eight traditional sections; by fall 2013, half of the 12 sections were hybrids. The introduction of flipped hybrid sections provides an opportunity to evaluate their impact, especially as students in all sections—traditional and hybrid—take a common exam at the end of the semes-ter. By summer 2014, over 350 students will have taken the hybrid version of STATS250, a larger group than even the sample studied by Bowen et al. (2012).
Before the start of a semester, students choose to enroll in either a traditional or hybrid section of STATS250. Stu-dents who register for the traditional format may choose a section that meets once a week for 2 hr and 40 min, twice a week for 75 min, or three times a week for 50 minutes. Stu-dents enrolled in the hybrid format meet once a week for 75 min with the instructor. Prior to each weekly meeting, students in all hybrid sections are required to complete the same assigned textbook reading, view some online video clips, and complete a set of conceptual online exercises. These online materials are part of LearnSmart, a component of McGraw-Hill’s Connect product, and accompany the course textbook written by Jaggia and Kelly (2012). At the weekly F2F meeting, students complete the same set of in-class exercises and case studies, and discuss any difficulties with the teacher. Within five days of the class meeting, stu-dents are required to submit the same online homework assignments (which generate questions randomly from a test bank). For those enrolled in the hybrid sections, the LearnSmart and online homework assignments comprise 25% of the course grade. Students in the traditional sections also complete LearnSmart and online homework assign-ments, but these components carry a lesser weight in the overall course grade. In both the hybrid and the traditional sections, all quizzes and exams are administered in a class-room environment.
The introductory business statistics course at Suffolk Uni-versity is a relevant model for many other universities. The material covered by the course is standard, the course uses a textbook from McGraw-Hill, a major publisher, and the level of student preparation is similar to that of hundreds of other institutions. The Carnegie Foundation classifies Suf-folk University’s undergraduate instructional program as having balanced arts and sciences/some graduate coexis-tence, a category that includes 291 universities with 2 million students, or 10% of the national student body (Carnegie Foundation, 2014). A private, coeducational, nonsectarian university located in downtown Boston, Suffolk has about 8,800 students, including 5,800 undergraduates; it is thus slightly larger than the average four-year university in the United States, which has 4,600 students (National Center for Education Statistics, 2014; see tables 301.10 and 317.10). Suffolk University’s Sawyer School of Business is Associa-tion to Advance Collegiate Schools of Business accredited. The average SAT score, for reading and mathematics, of entering undergraduates is 1,050, and the university is
considered to be selective byU.S. News(2014). In addition, in its Regional University North Rankings, Suffolk Univer-sity is ranked 60 out of 135 universities.3The relevance of our study to the teaching of introductory business statistics elsewhere comes from the standard nature of the course con-tent of STATS250, the large sample size, and the representa-tiveness of the students taking the course and the institution in which they are enrolled.
RESEARCH DESIGN
We used four distinct outcome measures in our examination of the impact of flipped hybrid classes. The first is the most straightforward: at the end of every semester, on the same day and at the same time, every student in STATS250 took a common final exam, which allows a comparison of the performance of students in hybrid sections with that of stu-dents in traditional F2F sections.
The final exams used at the end of fall 2012 and spring 2013 were identical—although the students were unaware of this—and so are comparable. Prior to the final, every student was given a sample final that included a one-page formula sheet; students were told that the one-page formula sheet would be provided to them on the day of the final. Students were able to use calculators during the final, but smart-phones were not allowed. Surveillance during the exam was strict, with one proctor for about every 30 students.
For the (identical) finals for fall 2012 and spring 2013, all questions were open-ended. After the final, all instruc-tors met and graded the finals as a group. For the sake of consistency, each instructor was responsible for grading the same two or so questions for every student. The process of grading took an average of 6 hr. A student was able to view his or her final exam after the grades were posted, but was not allowed to keep it, and the economics department kept the final exam papers in a locked cabinet. Due to the burden of grading the final exam, and the likelihood of fewer instructors as the university moves toward more hybrid offerings in STATS250, the final exam in fall 2013 was converted from an open-ended format to a multiple-choice format. Everything else about the final stayed the same: all sections took the exam on the same day and at the same time, and students were given a sample final in advance, to help them prepare for the exam itself.
The second measure of performance is the letter grade on the course, which varies from fail (0 on a 4-point scale) to A (4 on the scale). The semester grade is based on assign-ments, quizzes, and midterms in addition to the common final exam. Different teachers may determine letter grades differently, and this lack of consistency across sections makes this a less compelling outcome measure.
The two other measures of performance are subjective. One is based on student responses to a question that asks, “Overall, how would you rate STATS250 relative to your
other courses?” and records the answers on a 5-point Lik-ert-type scale from 1 (much worse) to 5 (much better). The other is based on student answers to a question that asks, “How much did STATS250 increase your interest in the subject matter?” and again records the answers on a 5-point Likert-type scale from 1 (not at all) to 5 (a great deal). All four measures are designed so that larger numbers are asso-ciated with better outcomes.
The data for the impact evaluation come from three sources:
1. The grades for the final exam, which were compiled by the course coordinator.
2. Information on student attitudes, which was collected using a questionnaire that students were asked to complete immediately after they finished the final exam. Students were asked to provide their ID num-bers, but not name, gender, age, or other distinguish-ing personal identifier. The questionnaire, which may be found via our website (http://web.cas.suffolk.edu/ faculty/jhaughton/), is modeled on the one used by Bowen et al. (2012), suitably adapted to the context of Suffolk University.
3. Final grades and background information on stu-dents, including their cumulative GPA, course load, and admissions ranking, which were obtained from the Registrar’s office.
Permission from the University’s Institutional Review Board was requested, and granted, for this research, given that it involves human subjects.
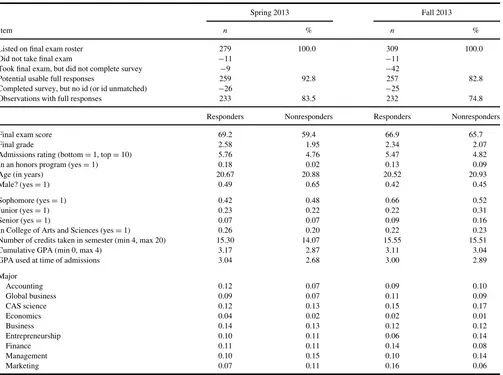
Data from the three sources of information were matched using student ID numbers. Unfortunately, 26 of those who completed the student survey in spring 2013 (and 25 in fall 2013) did not report their ID number, or reported a number that could not be matched elsewhere. A further nine students in spring 2013 (and 42 in fall 2013) did not complete the questionnaire, and in each semester 11 students did not take the final exam. Thus, of the 279 stu-dents listed on the final exam roster in the spring (and 309 in the fall), there were missing data for 46 (16.5%) in the spring and 78 (25.2%) in the fall, as Table 1 shows. This raises the possibility that response bias may be a problem. The lower panel in Table 1 addresses this issue, by compar-ing known information from responders and nonresponders (i.e., those who did not take the final exam, or fill in a questionnaire, or give a usable ID on a completed question-naire). The nonresponders performed less well academi-cally than responders, but in most other respects looked very similar to responders, suggesting that response bias is not likely to be a serious problem.
Baseline summary statistics on the four outcomes are shown in Table 2; these, and all the regression results reported subsequently, were computed using Stata version 12.0 (StataCorp, 2011). There were no statistically
significant differences in grades between fall 2012 and spring 2013, either in the common final exam (67.1% vs. 68.1%) or the semester grade (2.6 vs. 2.5, or just under a B–). If the student responses to the course rat-ing, and to the extent to which the course raised their interest in statistics, are converted to a continuous scale, then there was no discernible difference between fall 2012 and spring 2013. It is interesting that the average course grade was, at about CC, significantly lower in fall 2013 than in previous semesters; the rating of the course, and the interest in statistics that the course engendered, also fell significantly in fall 2013.
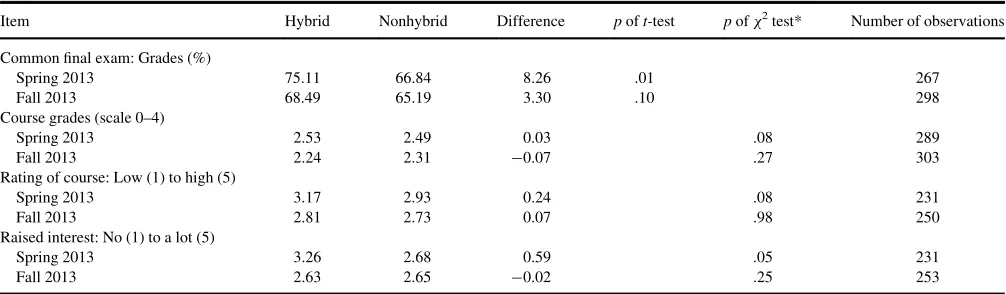
We now examine the average outcomes of hybrid classes, compared to traditional (nonhybrid) classes; the relevant numbers are set out in Table 3. Both in spring 2013 (when two of 10 classes were hybrids) and fall 2013 (when six of 12 classes were hybrids), students in the hybrid classes obtained higher scores on the com-mon final exam, and this difference is statistically sig-nificant at the 10% level. However, course grades were
TABLE 1 Is There Response Bias?
Spring 2013 Fall 2013
Item n % n %
Listed on final exam roster 279 100.0 309 100.0
Did not take final exam ¡11 ¡11
Took final exam, but did not complete survey ¡9 ¡42
Potential usable full responses 259 92.8 257 82.8
Completed survey, but no id (or id unmatched) ¡26 ¡25
Observations with full responses 233 83.5 232 74.8
Responders Nonresponders Responders Nonresponders
Final exam score 69.2 59.4 66.9 65.7
Final grade 2.58 1.95 2.34 2.07
Admissions rating (bottomD1, topD10) 5.76 4.76 5.47 4.82
In an honors program (yesD1) 0.18 0.02 0.13 0.09
Age (in years) 20.67 20.88 20.52 20.93
Male? (yesD1) 0.49 0.65 0.42 0.45
Sophomore (yesD1) 0.42 0.48 0.66 0.52
Junior (yesD1) 0.23 0.22 0.22 0.31
Senior (yesD1) 0.07 0.07 0.09 0.16
In College of Arts and Sciences (yesD1) 0.26 0.20 0.22 0.23
Number of credits taken in semester (min 4, max 20) 15.30 14.07 15.55 15.51
Cumulative GPA (min 0, max 4) 3.17 2.87 3.11 3.04
GPA used at time of admissions 3.04 2.68 3.00 2.89
Major
Accounting 0.12 0.07 0.09 0.10
Global business 0.09 0.07 0.11 0.09
CAS science 0.12 0.13 0.15 0.17
Economics 0.04 0.02 0.02 0.01
Business 0.14 0.13 0.12 0.12
Entrepreneurship 0.10 0.11 0.06 0.14
Finance 0.11 0.11 0.14 0.08
Management 0.10 0.15 0.10 0.14
Marketing 0.07 0.11 0.16 0.06
TABLE 2
Checking Variation in Outcomes Over Time
Item Fall 2012 Spring 2013 Fall 2013
Common final exam: Grades (%)
M 67.07 68.14 66.64
SD 21.98 20.10 17.21
tversus fall 2012 n.a. 0.59 a
Course grades (scale 0–4)
M 2.62 2.50 2.28
SD 1.18 1.24 1.18
tversus fall 2012 n.a. ¡1.20 ¡3.47 Rating of course: Low (1) to high (5)
M 2.99 2.97 2.77
SD 1.19 1.11 1.13
tversus fall 2012 n.a. ¡0.19 –2.12 Raised interest: No (1) to a lot (5)
M 2.93 2.78 2.64
SD 1.28 1.30 1.20
tversus fall 2012 n.a. ¡1.22 ¡2.55
Note:aFinal exam in fall 2013 not strictly comparable with the one given in fall 2012 and spring 2013.
not significantly higher for hybrid sections, and although students in hybrid courses enjoyed statistics, and were turned on by the subject, in spring 2013, there was no such effect in fall 2013.
The simple comparisons in Table 3, although sugges-tive, have a serious flaw: they do not take into account the possibility of selection bias. Students were not randomly assigned to hybrid courses, and it is entirely possible that students who chose to enroll in the hybrid sections were atypical—perhaps they were more self-motivated, or aca-demically stronger, or systematically different from their peers in some relevant way.
ADDRESSING SELECTION BIAS
There are a number of ways to address selection bias, although in the absence of panel data, none are able to deal satisfactorily with the unobservable characteristics that might impel a student to enroll in a hybrid rather than a tra-ditional section of the course (Haughton & Haughton, 2011). If we are willing to assume that, after controlling for observable characteristics of the student, he or she ended up taking the hybrid course randomly, then we have partial randomization, and may apply the techniques of quasi-experimental design.
The most straightforward of these quasi-experimental methods is to estimate a regression where the depen-dent variable is one of the relevant outcomes, and the treatment (i.e., whether a student is enrolled in a hybrid course) is included as a dummy variable on the right hand side (Haughton & Haughton, 2011). Suppose that we may assume, for the treated cases, that the outcome
Yidepends on control variablesXias follows:
YiTDaTCXib T
CvTi
;iD1;. . .;n1 (1)
and, for the non-treated (“comparison” or “control”) cases,
YC
mally distributed with zero means and constant variances; theaandbterms are coefficients to be estimated. Pooling the data for the treatment and comparison samples we get the switching regression:
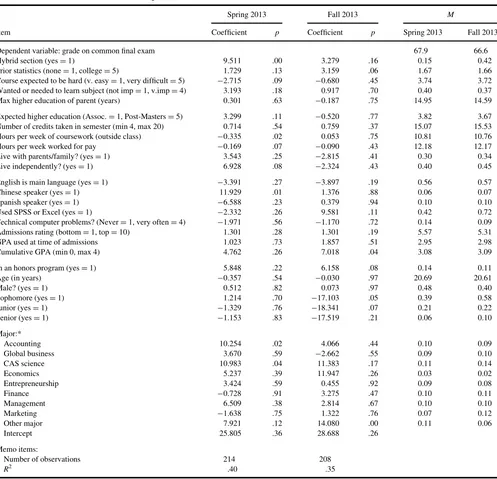
wise. This reduces to the common impact model if we assume, as is often done, thatbTDbC: Estimates of this common impact model are reported in Table 4, for both spring and fall 2013. The dependent vari-able here is the percentage score on the common final exam, and the mean values of the variables are also shown, in order to provide a point of reference.
The regression estimates in Table 4 show clearly that in spring 2013, students in the hybrid sections obtained higher scores on the common final exam, after controlling for a large number of other variables. Indeed the magnitude of this effect, which is statistically highly significant, is slightly larger than the one found in the simple comparison in Table 3. However, the effect was no longer statistically significant in fall 2013.
A number of other features of the regression results in Table 4—which we refer to as the large model because
TABLE 3
Testing for the Impact of Hybrid Courses: Uncontrolled Differences
Item Hybrid Nonhybrid Difference poft-test pofx2test* Number of observations
Common final exam: Grades (%)
Spring 2013 75.11 66.84 8.26 .01 267
Fall 2013 68.49 65.19 3.30 .10 298
Course grades (scale 0–4)
Spring 2013 2.53 2.49 0.03 .08 289
Fall 2013 2.24 2.31 ¡0.07 .27 303
Rating of course: Low (1) to high (5)
Spring 2013 3.17 2.93 0.24 .08 231
Fall 2013 2.81 2.73 0.07 .98 250
Raised interest: No (1) to a lot (5)
Spring 2013 3.26 2.68 0.59 .05 231
Fall 2013 2.63 2.65 ¡0.02 .25 253
Note:Thex2test checks whether the distribution of cells in a cross-tabulation differs between hybrid and traditional classes.
there are fully 35 independent variables—are noteworthy. Students who expected the course to be hard did relatively poorly, as did those who undertook more paid outside work. On the other hand, Chinese speakers, honors stu-dents, and those with a higher cumulative GPA, performed better. Compared to general business majors, students who majored in accounting, sciences, and perhaps economics, did better at the common final exam.
The lack of consistency in the estimated coefficients between the spring and fall versions of these regressions is striking, and may be due in part to underlying
multicollinearity. One common response to the curse of dimensionality is to trim the model, using forward or back-ward stepwise regression; the key results are included in Table 5, and although the test statistics shown here are no longer strictly legitimate, the results for the treatment vari-able—which is our principal interest—are similar to those found with the large model. Thus, multicollinearity is not coloring the measure of the impact of the hybrid classes on outcomes.
The regression estimates do not necessarily eliminate selection bias (Ettner, n.d.); unobserved factors may
TABLE 4
Regression Estimates: Performance on Common Final Exam
Spring 2013 Fall 2013 M
Item Coefficient p Coefficient p Spring 2013 Fall 2013
Dependent variable: grade on common final exam 67.9 66.6
Hybrid section (yesD1) 9.511 .00 3.279 .16 0.15 0.42
Prior statistics (noneD1, collegeD5) 1.729 .13 3.159 .06 1.67 1.66
Course expected to be hard (v. easyD1, very difficultD5) ¡2.715 .09 ¡0.680 .45 3.74 3.72 Wanted or needed to learn subject (not impD1, v.impD4) 3.193 .18 0.917 .70 0.40 0.37
Max higher education of parent (years) 0.301 .63 ¡0.187 .75 14.95 14.59
Expected higher education (Assoc.D1, Post-MastersD5) 3.299 .11 ¡0.520 .77 3.82 3.67 Number of credits taken in semester (min 4, max 20) 0.714 .54 0.759 .37 15.07 15.53 Hours per week of coursework (outside class) ¡0.335 .02 0.053 .75 10.81 10.76
Hours per week worked for pay ¡0.169 .07 ¡0.090 .43 12.18 12.17
Live with parents/family? (yesD1) 3.543 .25 ¡2.815 .41 0.30 0.34
Live independently? (yesD1) 6.928 .08 ¡2.324 .43 0.40 0.45
English is main language (yesD1) ¡3.391 .27 ¡3.897 .19 0.56 0.57
Chinese speaker (yesD1) 11.929 .01 1.376 .88 0.06 0.07
Spanish speaker (yesD1) ¡6.588 .23 0.379 .94 0.10 0.10
Used SPSS or Excel (yesD1) ¡2.332 .26 9.581 .11 0.42 0.72
Technical computer problems? (NeverD1, very oftenD4) ¡1.971 .56 ¡1.170 .72 0.14 0.09
Admissions rating (bottomD1, topD10) 1.301 .28 1.301 .19 5.57 5.31
GPA used at time of admissions 1.023 .73 1.857 .51 2.95 2.98
Cumulative GPA (min 0, max 4) 4.762 .26 7.018 .04 3.08 3.09
In an honors program (yesD1) 5.848 .22 6.158 .08 0.14 0.11
Age (in years) ¡0.357 .54 ¡0.030 .97 20.69 20.61
Male? (yesD1) 0.512 .82 0.073 .97 0.48 0.40
Sophomore (yesD1) 1.214 .70 ¡17.103 .05 0.39 0.58
Junior (yesD1) ¡1.329 .76 ¡18.341 .07 0.21 0.22
Senior (yesD1) ¡1.153 .83 ¡17.519 .21 0.06 0.10
Major:*
Accounting 10.254 .02 4.066 .44 0.10 0.09
Global business 3.670 .59 ¡2.662 .55 0.09 0.10
CAS science 10.983 .04 11.383 .17 0.11 0.14
Economics 5.237 .39 11.947 .26 0.03 0.02
Entrepreneurship 3.424 .59 0.455 .92 0.09 0.08
Finance ¡0.728 .91 3.275 .47 0.10 0.11
Management 6.509 .38 2.814 .67 0.10 0.10
Marketing ¡1.638 .75 1.322 .76 0.07 0.12
Other major 7.921 .12 14.080 .00 0.11 0.06
Intercept 25.805 .36 28.688 .26
Memo items:
Number of observations 214 208
R2 .40 .35
Note:*Omitted major is Business.
contribute to a correlation between the error .ei/in
Equa-tion 4 and the treatment dummy variable.Ti/, leading to a
biased estimate of the treatment effect.aT¡aC/. One prac-tical solution is to use a matching technique; another is to estimate a treatment effects regression, which is effectively a form of instrumental variables regression.
A popular matching technique is propensity score matching (see Haughton & Haughton, 2011; Rosenbaum & Rubin, 1983). First, it is necessary to estimate a probit equation where the binary dependent variable is set to 1 if the student is enrolled in a hybrid section, and the inde-pendent variables reflect existing conditions; the pre-dicted values from this equation are the propensity scores. With nearest-neighbor matching, the next step is to match each treated student with the nontreated student who has
the closest propensity score. The mean difference in out-comes between the treated students and their matches measures the average treatment effect on the treated (ATT). Propensity score matching has two strengths rela-tive to the regression approach: it confines the comparison to observations in the region of common support, which helps reduce selection bias, and it does not rely on distri-butional or parametric assumptions.
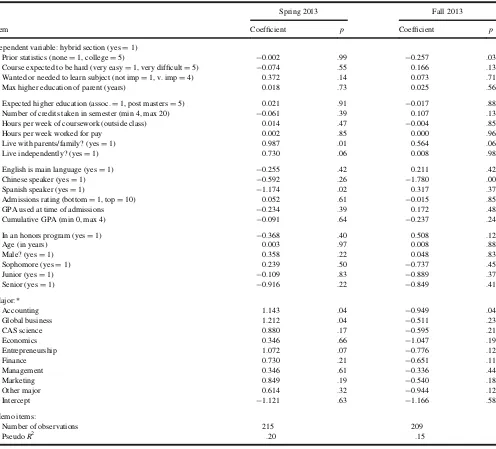
The estimates of the propensity score equations for spring and fall 2013 are shown in Table 6. We see that stu-dents who live independently were more likely to enroll in a hybrid section, while Spanish speakers were less likely to do so. Students in most business-related majors were also more likely to favor a hybrid section. The actual key results of the propensity score matching are given in Table 5, and
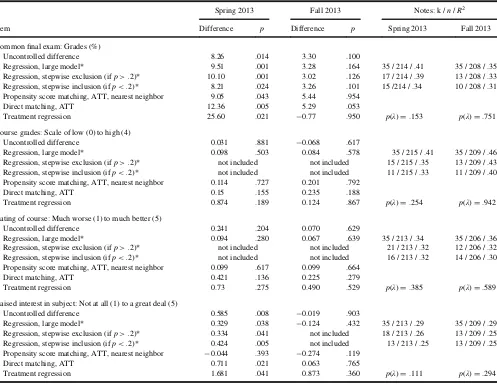
TABLE 5
Alternative Measures of Impact of Hybrid Courses in Statistics
Spring 2013 Fall 2013 Notes: k /n/R2
Item Difference p Difference p Spring 2013 Fall 2013
Common final exam: Grades (%)
Uncontrolled difference 8.26 .014 3.30 .100
Regression, large model* 9.51 .001 3.28 .164 35 / 214 / .41 35 / 208 / .35
Regression, stepwise exclusion (ifp>.2)* 10.10 .001 3.02 .126 17 / 214 / .39 13 / 208 / .33 Regression, stepwise inclusion (ifp<.2)* 8.21 .024 3.26 .101 15 /214 / .34 10 / 208 / .31 Propensity score matching, ATT, nearest neighbor 9.05 .043 5.44 .954
Direct matching, ATT 12.36 .005 5.29 .053
Treatment regression 25.60 .021 ¡0.77 .950 p(λ)D.153 p(λ)D.751
Course grades: Scale of low (0) to high (4)
Uncontrolled difference 0.031 .881 ¡0.068 .617
Regression, large model* 0.098 .503 0.084 .578 35 / 215 / .41 35 / 209 / .46
Regression, stepwise exclusion (ifp>.2)* not included not included 15 / 215 / .35 13 / 209 / .43 Regression, stepwise inclusion (ifp<.2)* not included not included 11 / 215 / .33 11 / 209 / .40 Propensity score matching, ATT, nearest neighbor 0.114 .727 0.201 .792
Direct matching, ATT 0.15 .155 0.235 .188
Treatment regression 0.874 .189 0.124 .867 p(λ)D.254 p(λ)D.942
Rating of course: Much worse (1) to much better (5)
Uncontrolled difference 0.241 .204 0.070 .629
Regression, large model* 0.094 .280 0.067 .639 35 / 213 / .34 35 / 206 / .36
Regression, stepwise exclusion (ifp>.2)* not included not included 21 / 213 / .32 12 / 206 / .32 Regression, stepwise inclusion (ifp<.2)* not included not included 16 / 213 / .32 14 / 206 / .30 Propensity score matching, ATT, nearest neighbor 0.099 .617 0.099 .664
Direct matching, ATT 0.421 .136 0.225 .279
Treatment regression 0.73 .275 0.490 .529 p(λ)D.385 p(λ)D.589
Raised interest in subject: Not at all (1) to a great deal (5)
Uncontrolled difference 0.585 .008 ¡0.019 .903
Regression, large model* 0.329 .038 ¡0.124 .432 35 / 213 / .29 35 / 209 / .29 Regression, stepwise exclusion (ifp>.2)* 0.334 .041 not included 18 / 213 / .26 13 / 209 / .25 Regression, stepwise inclusion (ifp<.2)* 0.424 .005 not included 13 / 213 / .25 13 / 209 / .25 Propensity score matching, ATT, nearest neighbor ¡0.044 .393 ¡0.274 .119
Direct matching, ATT 0.711 .021 0.063 .765
Treatment regression 1.681 .041 0.873 .360 p(λ)D.111 p(λ)D.294
Note:Difference measures score for hybrid sections minus score for nonhybrid sections. Not included means that the variable indicating whether a student was in a hybrid course was not sufficiently statistically significant enough to be included in the final version of the equation. k /n/R2refers to number of included variables, number of observations, andR2, respectively.p(λ) gives thepfor a test of whether a two-equation treatment regression model is preferable to a single-equation model.
aCluster robust estimation.
show that in spring 2013, students in hybrid sections per-formed better on the common final exam (the difference was 9.05,p D.043), but did not differ from their peers on any of the other measures of outcome in the spring semes-ter, or by any measure in the fall.
A related technique for measuring impact is direct matching; each student in a hybrid section is matched with a student in a traditional section by minimizing the Mahala-nobis distance between them—based on the set of variables used in Table 6. Here too we find that in spring 2013, stu-dents in the hybrid sections got higher scores on the com-mon final exam, but their other outcomes were similar to those of students in traditional sections; and again there
were no significant differences between hybrid and tradi-tional classes, by any outcome measure, in fall 2013. The details are shown in Table 5.
We also used a treatment regression approach to measur-ing the impact of hybrid classes. Selection (or endogeneity) bias will occur if the error term in the treatment equation (Equation 4) is correlated with the treatment variable. One solution is to estimate a first-stage equation where treatment
Ti
ð Þis the dependent variable, and then to use the estimated (rather than actual) values of,Tifrom the first-stage
estima-tion in the treatment equaestima-tion. The use of predicted, rather than actual,Ti breaks the correlation between the residual
and the treatment variable (Ettner, undated). The procedure
TABLE 6
Propensity Score Equation Estimates (Probit)
Spring 2013 Fall 2013
Item Coefficient p Coefficient p
Dependent variable: hybrid section (yesD1)
Prior statistics (noneD1, collegeD5) ¡0.002 .99 ¡0.257 .03
Course expected to be hard (very easyD1, very difficultD5) ¡0.074 .55 0.166 .13 Wanted or needed to learn subject (not impD1, v. impD4) 0.372 .14 0.073 .71
Max higher education of parent (years) 0.018 .73 0.025 .56
Expected higher education (assoc.D1, post mastersD5) 0.021 .91 ¡0.017 .88
Number of credits taken in semester (min 4, max 20) ¡0.061 .39 0.107 .13
Hours per week of coursework (outside class) 0.014 .47 ¡0.004 .85
Hours per week worked for pay 0.002 .85 0.000 .96
Live with parents/family? (yesD1) 0.987 .01 0.564 .06
Live independently? (yesD1) 0.730 .06 0.008 .98
English is main language (yesD1) ¡0.255 .42 0.211 .42
Chinese speaker (yesD1) ¡0.592 .26 ¡1.780 .00
Spanish speaker (yesD1) ¡1.174 .02 0.317 .37
Admissions rating (bottomD1, topD10) 0.052 .61 ¡0.015 .85
GPA used at time of admissions ¡0.234 .39 0.172 .48
Cumulative GPA (min 0, max 4) ¡0.091 .64 ¡0.237 .24
In an honors program (yesD1) ¡0.368 .40 0.508 .12
Age (in years) 0.003 .97 0.008 .88
Male? (yesD1) 0.358 .22 0.048 .83
Sophomore (yesD1) 0.239 .50 ¡0.737 .45
Junior (yesD1) ¡0.109 .83 ¡0.889 .37
Senior (yesD1) ¡0.916 .22 ¡0.849 .41
Major:*
Accounting 1.143 .04 ¡0.949 .04
Global business 1.212 .04 ¡0.511 .23
CAS science 0.880 .17 ¡0.595 .21
Economics 0.346 .66 ¡1.047 .19
Entrepreneurship 1.072 .07 ¡0.776 .12
Finance 0.730 .21 ¡0.651 .11
Management 0.346 .61 ¡0.336 .44
Marketing 0.849 .19 ¡0.540 .18
Other major 0.614 .32 ¡0.944 .12
Intercept ¡1.121 .63 ¡1.166 .58
Memo items:
Number of observations 215 209
PseudoR2 .20 .15
Note:Omitted major is Business.
works best if there are variables that are expected to affect whether one is treated (here, in a hybrid course) but do not affect the outcomes (such as final exam grades). We identi-fied three such variables for spring 2013: whether a student is living at home, whether the student expressed a strong desire to learn statistics, and gender.
The relevant results of the treatment regression model for spring 2013 are shown in Table 5. By this measure, final exam scores for the hybrid classes were substantially higher than for traditional classes in spring 2013 (but not in the fall). However, the value ofλ, which is defined as the
prod-uct of the correlation of the residuals of the two equations times the standard error of the outcome regression, was not significantly different from zero, suggesting that a single-equation method would have served adequately. The treat-ment regression results show no effect of hybrid classes on semester grade or the perceived course rating, but do indi-cate that students in the hybrid sections were more likely to show a greater interest in statistics after having taken the course (in spring 2013).
In the regression and matching exercises it is assumed (implicitly) that the introduction of hybrid sections does not affect the performance of traditional sections, but this assumption may be wrong. The use of hybrid sections econ-omizes on the use of teachers—six teachers taught a total of 10 sections in fall 2012 and again in spring 2013, but only five teachers were needed for the 12 sections taught in fall 2013, half of which were hybrids. If teachers are hired in order of merit, the use of hybrid courses could allow one to avoid hiring the weakest instructors, thereby raising the average quality of instruction both for hybrid and tradi-tional courses.
It is difficult to measure such an effect because it is rarely possible to construct a good counterfactual, because we do not usually know who might have been hired if there were fewer hybrid and more traditional sections. However, the following thought experiment is useful: in fall 2013 there were six hybrid sections of STATS250, and if these were taught as traditional sections, then three additional instructors (each teaching one section) would have been required. Most of the adjunct teachers of statistics at Suf-folk are students in the PhD program in economics, and we are able to identify who would likely have been hired. These three graduate students had taught STATS250 before in fall 2012 or spring 2013, and we know how their students performed on the final exam and rated the course, for those semesters. Applying these relative outcomes, we are able to simulate the effect on overall outcomes in fall 2013: the mean score on the final exam would have fallen from 66.6% to 65.9%, due in part to the lower performance of the students taught by the marginal hires (64.8%), and in part to the lower weight on the scores of the high-perform-ing teachers (who would now teach fewer students). The difference is not statistically significant, however, and the other measures of performance (course grade, student
evaluation of the course, and changed interest in statistics) would barely change. This exercise is hardly conclusive, but does suggest that the pool of effective statistics teachers may often be sufficiently deep that the indirect effect of hybrid courses, via an increase in the average quality of instructors, is of secondary importance.
CONCLUSIONS, CAVEATS, AND RECOMMENDATIONS
The introductory business statistics course (STATS250) at Suffolk University was taught in 22 sections in 2013, of which eight followed a flipped hybrid model. Based on data from a common final exam, an end-of-the-semester ques-tionnaire completed by students, and matched data from the Registrar’s office, and using a variety of techniques, some of which sought to correct for selection bias, we were able to assess whether hybrid sections were associated with bet-ter outcomes.
The results are clear and consistent. Controlling for other observable factors, students in the hybrid courses per-formed better on the common final exam only in spring 2013; however, their semester grades, rating of the course, and newfound enthusiasm for statistics did not differ signif-icantly from those of their peers in traditional classes in that semester.
The evidence of stronger outcomes for hybrid sections was weaker in fall 2013 (when half of the sections were taught in this manner) than in spring 2013: none of the outcome measures were significantly different between hybrid and traditional classes. It is not clear why the results differed between spring and fall 2013; the demo-graphics of the fall and spring classes are very similar (see Table 1), although the proportion of freshmen was somewhat higher in the spring than the fall. Nor did the size of hybrid classes change much (24 students per sec-tion in the spring, 23 in the fall), although the size of tra-ditional sections did grow (from 26 in the spring to 32 in the fall). One possible explanation is that the teacher of the hybrid section in spring 2013 was highly experienced, and although she also taught four of the six hybrid sec-tions in the fall, the remaining hybrids were taught by a graduate student instructor. It may also be the case that students in the hybrid sections in spring 2013 were excited by the (still) innovative teaching style, but the novelty had worn off by the time the fall cohort of stu-dents enrolled in the course. A third possibility is that our techniques have not fully controlled for selection bias; once hybrid sections were extended to half the class, a greater proportion of those enrolled in the hybrids may not have been particularly keen to be there. Given the wider coverage of students and faculty, we consider the fall 2013 results to be more plausible as a guide to what one might expect in the future.
Our best assessment is that hybrid sections in intro-ductory business statistics do no harm, at least as mea-sured by a relatively standard set of outcomes, but they do not yield better outcomes than traditional courses either. These results are consistent with those of Terry (2007) who compared student performance in traditional, online, and hybrid formats of graduate master of business administration courses. He found that the hybrid format maintains the high quality and student satisfaction associ-ated with traditional F2F instruction. It is possible to argue that in the not-so-distant future the hybrid format may outperform the traditional format as faculty gain experience in this type of environment, and as further technological advances improve mode efficiency.
Cost Savings?
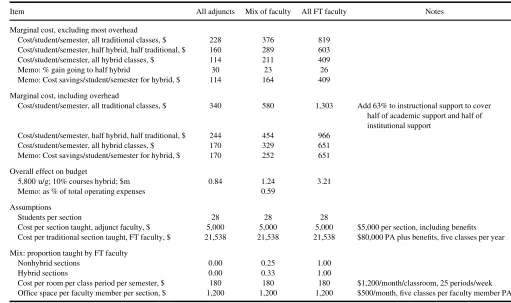
If the outcomes of hybrid sections are not demonstrably better than those of traditional sections, the case for using the hybrid model rests entirely on the potential for cost sav-ings. We have assembled some indicative numbers in Table 7.
The assumptions are set out at the bottom panel of the table. The most important cost drivers are the number of
students per section (28), the cost of adjunct faculty (total of $5,000 per course per semester), the cost of full-time fac-ulty ($80,000 per year, plus benefits including sabbaticals, and a five-course teaching load per year), and the mix of adjunct and full-time faculty. The middle column approxi-mates the situation at Suffolk University, where costs are probably in line with many mid-range universities in the United States, especially those that employ a mix of part-and full-time faculty.
We estimate the marginal cost of teaching introductory business statistics to one student for one semester to be $376 in traditional classes, $289 if half the courses are hybrids, and $211 if all the sections are taught in hybrid for-mat. The savings from moving to hybrids calculated here (i.e., $164 per student per course) include lower salaries and benefits, but also reductions in the cost of providing classroom and office space. The totals here may look low— the average instructional cost per student of a course at Suf-folk University is just over $1,000, and about $2,800 when support and overhead costs are factored in—but the modest unit costs reflect the relatively high average class size and substantial use of adjunct faculty in introductory business statistics classes. Note that we assume that the move from traditional to hybrid courses would be associated with a
TABLE 7
Illustrative Cost Savings From Using Hybrid Courses in Statistics
Item All adjuncts Mix of faculty All FT faculty Notes
Marginal cost, excluding most overhead
Cost/student/semester, all traditional classes, $ 228 376 819 Cost/student/semester, half hybrid, half traditional, $ 160 289 603 Cost/student/semester, all hybrid classes, $ 114 211 409
Memo: % gain going to half hybrid 30 23 26
Memo: Cost savings/student/semester for hybrid, $ 114 164 409
Marginal cost, including overhead
Cost/student/semester, all traditional classes, $ 340 580 1,303 Add 63% to instructional support to cover half of academic support and half of institutional support
Cost/student/semester, half hybrid, half traditional, $ 244 454 966 Cost/student/semester, all hybrid classes, $ 170 329 651 Memo: Cost savings/student/semester for hybrid, $ 170 252 651
Overall effect on budget
5,800 u/g; 10% courses hybrid; $m 0.84 1.24 3.21
Memo: as % of total operating expenses 0.59
Assumptions
Students per section 28 28 28
Cost per section taught, adjunct faculty, $ 5,000 5,000 5,000 $5,000 per section, including benefits Cost per traditional section taught, FT faculty, $ 21,538 21,538 21,538 $80,000 PA plus benefits, five classes per year
Mix: proportion taught by FT faculty
Nonhybrid sections 0.00 0.25 1.00
Hybrid sections 0.00 0.33 1.00
Cost per room per class period per semester, $ 180 180 180 $1,200/month/classroom, 25 periods/week Office space per faculty member per section, $ 1,200 1,200 1,200 $500/month, five classes per faculty member PA
Note:FT: full time; PA: per annum.
higher proportion of full-time faculty teachers, up from 25% to 33% in our illustrative example; this reflects the practice of asking full-time faculty first to teach hybrid sections.
Over time, the introduction of hybrids may also lead to savings in some of the costs of academic and institutional support—the human resources office could be smaller, fewer security personnel may be needed, heating and light-ing costs would be lower, and so on. Based on publicly-available financial data, and assuming that half of academic support and institutional support costs are adjustable in this way, we estimate these costs to be 63% of instructional costs at Suffolk University, and this is reflected in our mar-ginal cost including overhead panel in the middle of Table 7. If ten percent of undergraduate courses at Suffolk University were taught as hybrids rather than in the tradi-tional manner, the estimated annual savings would be $1.2 million annually, or 0.6% of total operating expendi-tures—certainly a worthwhile saving, but not an over-whelming one. Ironically, the potential savings are substantially greater in institutions that rely almost exclu-sively on full-time faculty to teach introductory courses such as STATS250.
In our computations we assume that there are 28 students per section, whether it is conventional or hybrid. This may not be entirely appropriate: in 2013, the mean hybrid sec-tion at Suffolk University had 23.5 students, compared to 28.9 students for conventional sections. The smaller size of the hybrid classes is not accidental: it was felt that these classes needed to be kept small enough to allow for active discussion. If we were to assume that conventional sections had 30, and hybrid sections 25, students each, then the sav-ings from a shift of 10% of undergraduate classes at Suffolk University toward hybrids would be substantially smaller, at about $0.86 million instead of $1.2 million annually.
Based on our findings, it is reasonable to recommend that hybrid courses be used in teaching introductory busi-ness statistics: hybrids do no harm, are sustainable, may be attractive to some students, and reduce costs somewhat. But not every student thrives on the flipped hybrid model, so there is a strong case for continuing to offer a mix of tra-ditional and hybrid courses.
NOTES
1. Students were first invited to participate in the Bowen et al. (2012) study, which provided monetary or other incentives; if they agreed, they were assigned ran-domly to F2F or hybrid sections of the course. Thus the randomization was conditional on students agree-ing to participate. Of the 3,046 students enrolled in the course at the six campuses, 605 participated in the study, and of these, 292 were assigned to tradi-tional sections and the remaining 313 to hybrid
classes. The selection of instructors to teach the hybrid sections was not random either.
2. The catalog description of STATS250 is as follows: Application of statistical analysis to real-world busi-ness and economic problems. Topics include data pre-sentation, descriptive statistics including measures of location and dispersion, introduction to probability, discrete and continuous random variables, probability distributions including binomial and normal distribu-tions, sampling and sampling distribudistribu-tions, statistical inference including estimation and hypothesis testing, simple and multiple regression analysis. The use of computers is emphasized throughout the course. Nor-mally offered each semester.
Before enrolling in the course, students must have suc-cessfully completed a course in college-level mathematics.
3. Using the Carnegie classification, regional universi-ties offer a full range of undergraduate programs and some master’s programs, but few doctoral programs.
REFERENCES
Ary, E. J., & Brune, C. W. (2011). A comparison of student learning out-comes in traditional and online personal finance courses.MERLOT Jour-nal of Online Learning and Teaching,7, 465–474.
Bowen, W. G., Chingos, M. M., Lack, K. A., & Nygren, T. I. (2012, May 22). Interactive learning online at public universities: Evidence from randomized trials.Ithaka SCR. Retrieved from http://www.sr. ithaka.org/research-publications/interactive-learning-online-public-universities-evidence-randomized-trials
Carnegie Foundation. (2014). Summary tables: Undergraduate instruc-tional program classification. Retrieved from http://classifications. carnegiefoundation.org/summary/ugrad_prog.php.
CUNY Hybrid Initiative. (2014).Flipping the classroom. Retrieved from http://hybrid.commons.gc.cuny.edu/teaching/additional-resources/ flipping-the-classroom/.
Driscoll, A., Jicha, K., Hunt, A. N., Tichavsky, L., & Thompson, G. (2012). Can online courses deliver in-class results? A comparison of stu-dent performance and satisfaction in an online versus a face-to-face introductory sociology course.Teaching Sociology,40, 312–331. Ettner, S. (n.d.).Methods for addressing selection bias in observational
studies. Los Angeles, CA: Division of General Internal Medicine and Health Services Research, UCLA.
Figlio, D. N., Rush, M., & Yin, L. (2010).Is it live or is it Internet? Experi-mental estimates of the effects of online instruction on student learning. National Bureau of Economic Research Working Paper No. 16089. Cambridge MA: National Bureau of Economic Research.
Haughton, D., & Haughton, J. (2011).Living standards analytics:
Devel-opment through the lens of household survey data. New York, NY:
Springer.
Jaggia, S., & Kelly, A. (2012).Business statistics: Communicating with
numbers. New York, NY: McGraw-Hill/Irwin.
Joyce, T. J., Crockett, S., Jaeger, D. A., Altindag, O., & O’Connell, S.D. (2014).Does classroom time matter? A randomized field experiment of hybrid and traditional lecture formats in economics. National Bureau of Economic Research Working Paper no. 20006. Cambridge MA: National Bureau of Economic Research.
Lack, K A. (2013, March 21). Current status of research on online learning in postsecondary education.Ithaka SCR. Retrieved from http://www.sr. ithaka.org/research-publications/current-status-research-online-learning-postsecondary-education
Lam, M, (2009). Effectiveness of web-based courses on technical learning. Journal of Education for Business,6, 323–331.
Means, B., Toyama, Y., Murphy, R., Bakia, M., & Jones, K. (2010). Evalu-ation of evidence-based practices in online learning: A meta-analysis and review of online learning studies. Washington, DC: U.S. Depart-ment of Education, Office of Planning, Evaluation, and Policy Development.
National Center for Education Statistics. (2014).Digest of Education Sta-tistics2013. Washington, DC: U.S. Department of Education, Institution of Education Sciences. Retrieved from http://nces.ed.gov/programs/ digest/.
Rosenbaum, P., & Rubin, D. (1983). The central role of the propensity score in observational studies for causal effects.Biometrika,70, 41–55. Sebastianelli, R., & Tamimi, N. (2011). Business statistics and
manage-ment science online: Teaching strategies and assessmanage-ment of student learning.Journal of Education for Business,86, 317–325.
StataCorp. (2011). STATA statistics/data analysis(version 12.0, special edition). College Station, TX: Author.
Terry, N. (2007). Assessing instruction modes for master of business administration (MBA) courses.Journal of Education for Business,4, 220–225.
U.S. News.(2014). College compass. Retrieved from http://colleges.usnews. rankingsandreviews.com/best-colleges/suffolk-university-2218
Wilson, D., & Allen, D. (2014). Success rates of online versus traditional college students, Research in Higher Education, 14, 1–8. Retrieved from http://www.aabri.com/manuscripts/11761.pdf