Monte Carlo Simulation of the Nematic-Isotropic Phase Transition of Liquid
Crystals under Magnetic Field
Warsono
1,2, Yusril Yusuf
1, Pekik Nurwantoro
1, Kamsul Abraha
11
Department of Physics, Faculty of Mathematics and Natural Science, Gadjah Mada University, 55281 Yogyakarta, Indonesia
2
Department of Physics Education, Faculty of Mathematics and Natural Science, Yogyakarta State University, 55281 Yogyakarta, Indonesia
Abstract—The effect of magnetic field on the nematic-isotropic phase transition of liquid crystal was studied by Monte Carlo simulation. The classical spin lattice model was used to describe the liquid crystal systems and the Lebwohl-Lasher potential model. We calculate the energy per spin, the orientational order parameter, and specific heat of subtances and then study their phase diagrams as a function of temperature for various magnetic fields and as a function of magnetic field for various temperatures. In the absence of magnetic field, the nematic-isotropic phase transition is a weak first order transition. If the magnetic field is increased, then the minimum value of the spin energy will drop, the minimum value of the order parameter will increase, and the peak value of the specific heat is going down. We find that the magnetic field shifts the nematic-isotropic phase transition and induces an isotropic phase into a paranematic phase.
Keywords – Monte Carlo simulation, spin lattice model, Lebwohl-Lasher model, liquid crystal, nematic-isotropic phase transition, magnetic field
I. INTRODUCTION
Liquid crystals are excellent materials that they exhibit intermediate state between liquid and solid (crystal). They possess some typical properties of liquid as well as solid states. Crystalline materials or solids are materials characterized by strong positional order and orientational order. The positional and orientational orders have low values for liquids. The liquid crystal phase is a mesophase, which occurs in the transition from solid to liquid (isotropic). As a result, positional order and orientational order of liquid crystals have values between solids and liquids [1-7]. There are three distinct types of liquid crystals: thermotropic, lyotropic and polymeric. The most widely used liquid crystals, and extensively studied are thermotropic liquid crystals [8], in which the phases can be controlled by temperature. The three main classes thermotropic liquid crystals are: nematic, smectic and cholesteric. The nematic phase is the simplest phase of thermotropic liquid crystal. In this phase the molecules
maintain a preferred orientational direction as they diffuse throughout the sample. In this system, there exists orientational order, but no positional order [9]. The orientation of nematic liquid crystals can be controlled by an external fields, particularly electric or magnetic fields [10, 11]. If an external field is applied on the nematic liquid crystals, then the evolution of order parameter can be occurred [12]. So, it is important to understand how is the effect of magnetic field on phase transition of nematic liquid crystals.
In recent years rapid advances in the speed of computers has led to the increased use of molecular simulation as a tool to understand complex systems. In the complex systems, such as liquid crystals, simulation is often difficult, with subtle changes in intermolecular forces leading to changes in phase behavior. Moreover, in the case of liquid crystals many properties of interest arise from specific ordering of molecules (or parts of molecules) in the bulk; and so can only be studied by simulation of many molecules. Despite these difficulties the progress in molecular simulation has been rapid [13]. In computer simulation, a very popular method to solve the complex system under equilibrium states is Monte Carlo method. This method is applicable for complex systems with characteristics: large number of components, many interactions, large parameter space, uncertainty in value of parameters, and uncertainty in outcomes, while deterministic method is failed.
A number of different types of simulation model have been developed for modeling liquid crystal systems, i.e. lattice models, coarse-grained single site models based on hard and soft interaction potentials, atomistic models and multi-site coarse-grained models [13]. Possibly the simplest model is a lattice model. This model is based on the spin-models of classical physics. Here, a molecule director or local director is assumed as a classical spin. Its component has three directions in Cartesian axes, i.e. x, y, and z
directions. These can be used to represent a molecule (or cluster of molecules), which interact with neighboring spins through a simple interaction potential, especially Lebwohl – Lasher potential. Although, a lattice model is the simplest, but some researchers have been used it in some liquid crystal systems models [14-17].
In this paper, we want to study the effect of magnetic field on nematic-isotropic phase transition of liquid crystal. We use Metropolis Monte Carlo technique to calculate and plot phase diagrams of energy per spin, orientational order parameter, and specific heat as function of temperature in various magnetic fields. From the plots, we can unambiguously determine the change of phase transition.
II. RESEARCH METHOD
Figure 1. Schematic representation of the local director
n
ˆ
i and thedirector
n
ˆ
of liquid crystal in classical spin lattice model.In this simulation, the classical spin lattice model used to describe the liquid crystal molecules which occupy lattice points in three-dimensional space .In this model, we consider L x L x L cubic lattice with each lattice sites indexed by number i. Each lattice site holds a molecule director or local director, called spin, denoted by a unit vector
n
ˆ
i.The average of all local directors that indicates a liquid crystal alignment, usually called director, is denoted by a unit vector
n
ˆ
(see Fig. 1). Each a unit vectorn
ˆ
i has threecomponents, namely:
n
ˆ
ix
-in the x direction,n
ˆ
i
y
- in the ydirection and
n
ˆ
i
z
- in the z direction, as shown in Fig. 2 [8, 18].The three components of the vector
n
ˆ
i are expressed by:(1)
n
i
cos
θ
θ
sin
φ
sin
θ
sin
φ
cos
n
n
n
ˆ
iz
iy
ix
where
θ
0
:
π
is zenithal angle andφ
0
:
2
π
is azimuthal angle. The degree of liquid crystal alignment for aset of vector spins,
n
ˆ
i, is measured via an order parameter [13, 15]:)
(
)
n
n
(
i
2
2
ˆ
.
ˆ
P
S
where
P
2
(x)
3
x
2
1
2
1
is the second Legendrepolynomial and ... is an average all the spins .
Figure 2. Three components of
n
ˆ
i
, i.e :ˆ
n
i
x
,n
ˆ
i
y
andˆ
n
i
z
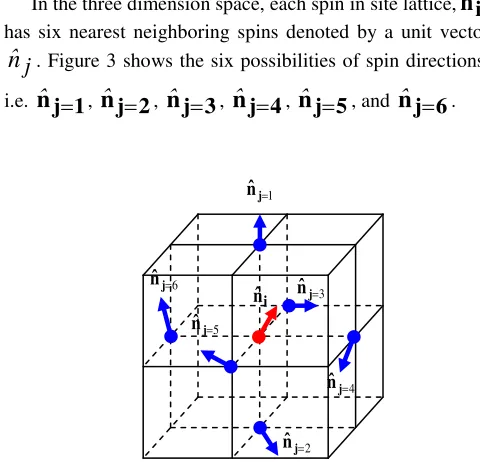
In the three dimension space, each spin in site lattice,
n
ˆ
i
, has six nearest neighboring spins denoted by a unit vectorj
n
ˆ
. Figure 3 shows the six possibilities of spin directions,i.e.
n
ˆ
j
1
,ˆ
n
j
2
,n
ˆ
j
3
,n
ˆ
j
4
,n
ˆ
j
5
, andn
ˆ
j
6
.Figure 3.The six possibilities of nearest neighboring spin.
The energy of interaction between spin on site and their nearest neighboring spins is modeled by Lebwohl-Lasher [10, 12, 15]:
)
(
)
n
n
(
i
j
3
2
ˆ
ˆ
P
J
E
ij
n
where
J
0
is the strength of interaction andij
indicates nearest neighbors only.As liquid crystals are also anisotropic diamagnets, they can be aligned in magnetic field. The energy of interaction between spin clusters
n
ˆ
i
(molecular director of liquid crystals) and magnetic field is modeled by [8, 19]:)
(
)
n
n
(
)
H
n
(
m
i
i
4
χ
1
2
1
2
2
1
ˆ
ˆ
h
ˆ
E
N
i
N
i
a
m
where
χ
a
χ
||
χ
is a positive diamagneticanisotropy,
2
2
1
χ
H
h
a
, andn
ˆ
m
is a unit vectorparallel to
H
. From the equation (3) and (4), the total energy of the systems (liquid crystals under magnetic field) is:
)
(
)
n
n
(
)
n
n
(
i
j
i
m
5
1
2
2
ˆ
.
ˆ
h
ˆ
.
ˆ
P
J
E
N
i
ij
From thermodynamics, we know that the specific heat associated with the energy of the system, it is expressed by:
)
(
6
dT
E
d
C
V
According to the fluctuation-dissipation theorem of statistical mechanics, the variance of the energy is related to the specific heat [20, 21]:
)
(
7
2
2
T
k
E
C
B
V
Δ
where
Δ
E
2
E
2
E
2
.The Monte Carlo method is a technique for analyzing phenomena by means of computer algorithms that employ, in an essential way, the generation of random numbers [22, 23]. In our Monte Carlo simulation, we used Metropolis algorithm to compute the energy per spin (E), order parameter (S) and specific heat (Cv) as function of temperature in the magnetic field variations. We also calculate these quantities as a function of magnetic field at some temperature variations. The procedures of calculating are summarized as follow:
1.Determine the parameter constants : N (number of lattice size), J (strength of interaction) , kB (Boltzmann’s constant)
2.for h (magnetic field) loops and T (temperature) loops , do:
a.determine the initial configuration of spin in zenithal angle
θ
and azimuthal angleφ
as shown in equation (1)b.for the Monte Carlo loops, do:
1).calculate the six nearest-neighbors spins of each spin in a site of lattice
2).calculate the change of spin energy
E
3).determine the transition probabilities:
,exp E/k T
min
p 1
B4).use the transition probabilities to determine a new configuration
5).calculate the variables of
E
,S
, andC
v
c. calculate the average ofE
,S
, andC
v
3.display diagrams ofE
,S
, andC
v
versus T and h At the final calculation, we use some quantity as follow: N = 403, J = 1, kB = 1, h = 0 : 0.15 : 0.75, T = 0.01 : 0.005 : 0.5, and NMC= 500 (NMC = number of Monte Carlo loops). We also use this procedure to make a graph in 3D. In this simulation, the magnetic field was chosen parallel to the director alignment.III. RESULTS AND DISCUSSION
A. The Effects of Magnetic Fields on Interaction Energy
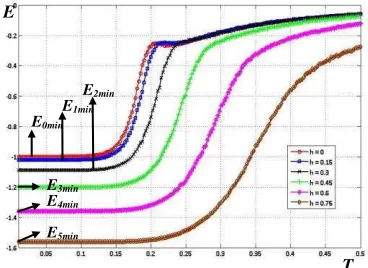
Figure 4. Energy per spin, E, as a function of temperature, T , for various values of the magnetic fields, h.
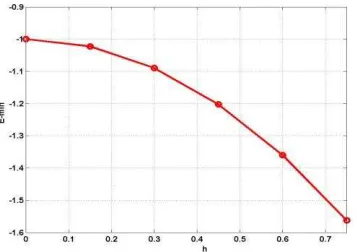
Fig. 4 shows the interaction energy per spin E as a function of temperatures T, for various values of magnetic fields h. The existence of magnetic fields change the interaction energy of spin, including the minimum energy. The minimum energy associated with the value of the magnetic field h0= 0.00; h1 = 0.15; h2 = 0.3; h3 = 0.45; h4 = 0.60; and h5 = 0.75; are E0min = -1.0000; E1min = -1.0225; E2min = -1.0900; E3min = -1.2025; E4min = -1.3600; and E5min = -1.5625. This relationship is shown in
Fig.5.
In general, the increase of the magnetic field causes a decrease in the energy of the spin. This is accordance with equation (5). Physically, this means that the choice of a magnetic field parallel to the director led to the arrangement of liquid crystal molecules become more orderly or
stabilize the anisotropic phase [24]. Based on the diagram, we need more energy to change their phases or need high temperature.
Figure 5. Minimum Energy of spin Emin as a function of magnetic field h
Fig. 6 shows the variation of energy with magnetic field for different values of temperature. In low temperatures (under critical temperature), giving the magnetic field does not cause a sharp change in energy, it means that there is no phase transition, whereas at high temperatures (greater than the transition temperature), changes in the magnetic field causes the energy drop drastically. In 3D, the graph of E versus h and T shown in Fig. 7.
Figure 6. Energy per spin, E, as a function of magnetic field, h, for various values of temperature, T.
Figure 7. Energy per spin E as a function of magnetic field h and temperature T in 3D.
B. The Effects of Magnetic Fields on Order Parameter
Fig. 8 depicts orientational order parameter S as a function of temperature for various values of h. In absence of magnetic field (h = 0), the order parameter S jumps drastically, but in small range above the critical point (Tc) the order parameter not equal to zero, so the transition is called the weak first order transition [25].
Figure 8. Orientational order parameter S, as a function of temperature T,
for various values of the magnetic field h.
By applying a magnetic field, the order inside the system is considerably changed. At the same temperature, the increase in the magnetic field causes an increase in the order parameter [24]. This means that the magnetic field increases the regularity in the system [26].
Figure 9. Minimum Order Parameter Smin, at T = 0.5, as function of magnetic field h.
Magnetic field also causes the value of minimum order parameter above zero. For the example, at T =0.5, the value of order paramater assosiated with the value of magnetic fields h0= 0; h1 = 0.15; h2 = 0.3; h3 = 0.45; h4 = 0.60; and h5 = 0.75 are S0=0, S1=0.098, S2=0.111, S3=0.146,
S4=0.219, and S5=0.387 as shown in Fig. 9. It means that the
S
T
S0
S3
S4
S5
Tc
E
h
S1
S2
Smin
magnetic field induce isotropic phase to paranematic phase [6,8].
Figure 10. Order Parameter, S, as a function of magnetic field, h, for various values of temperature, T.
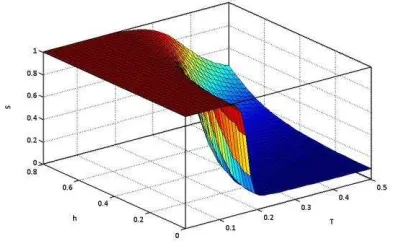
Fig. 10 describes the order parameter S as a function of magnetic field h for various values of temperature T. At low temperature, the magnetic field can not change the order parameter because at this temperature the arrangement of the molecules are in order, but at high temperatures (greater than the transition temperature), changes in the magnetic field caused the order parameter increase drastically. The relationship between S, h and T in 3D shown in Fig. 11.
Figure 11. Order Parameter S as a function of magnetic field, h, and temperature, T, in 3D.
C. The Effects of Magnetic Fields on Specific Heat
The specific heat Cv obtained from differentiation of energy E with respect to temperature T. Therefore, the specific heat associated with the slope of the graph in the relationship between energy with temperature, as shown in Fig. 4. The sharpness of the slope shows the magnitude of the specific heat. The relationship between specific heat with temperature in various of magnetic fields is shown in Fig. 12. At h = 0, the value of the specific heat peak is the highest and steepest compared to other h values. This shows that the magnetic field reduce the peak of specific heat and
shift the first order transition to the second order [27] as shown in Fig. 13.
Figure 12. Specific heat, CV, as a function of temperature, T, for various values of the magnetic field, h.
Figure 13. Maximum Specific Heat Cvmaks as a function of magnetic field, h at critical temperature Tc
Figure 14. Specific heat CV , as a function of magnetic field h, for various values of temperature T.
S
h
Cv
T
Tc0=0.180
Tc1=0.185
Tc3=0.241
Tc4=0.291
Tc5=0.350
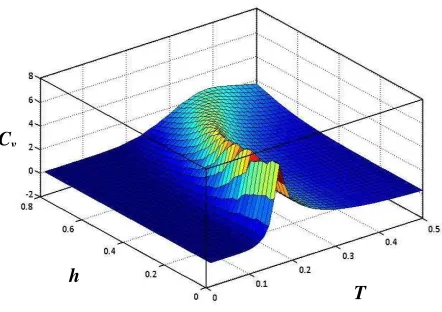
The relationship between the specific heat and the magnetic field is shown in Fig. 14. At low temperatures (under critical temperature), the magnetic field does not significantly affect the specific heat changes. In 3D, the relationship between Cv, h and T shown in Fig. 15
Figure 15. Specific heat Cv , as a function of magnetic field h, and
temperature T, in 3D.
IV. CONCLUSIONS
We have used Monte Carlo simulation by employing spin lattice model and Lebwohl-Lasher model to study the influence of magnetic field on nematic-isotropic phase transition of liquid crystals. In the absence of magnetic field, the nematic-isotropic phase transition is a weak first order transition. The applied of magnetic field on liquid crystal changes the energy per spin, the order parameter and the specific heat. This is shown in phase diagrams involving energy per site, order parameter and specific heat as function of temperature for the various values of magnetic field and as function of magnetic field in the temperature variations.
If the magnetic field is increased, then the minimum value of the spin energy will drop, the minimum value of the order parameter will increase, and the peak value of the specific heat is going down. We find that the magnetic field shifts the nematic-isotropic phase transition and induces an isotropic phase into a paranematic phase.
REFERENCES
[1] X. J. Wang and Q. F. Zhou. Liquid Crystalline Polymers. Singapore : World Scientific Publishing Co. Pte. Ltd., 2004.
[2] G. Germano and F. Schmid, “Simulation of Nematic-Isotropic Phase Coexistence in Liquid Crystals under Shear”, Julich : John von Neumann Institute for Computing, NIC Symposium 2004, Proceedings, 2004, pp. 311.
[3] D. Adrienko. Introduction to Liquid Crystals. Bad Marienberg: International Max Planck Research School, 2006, pp. 2.
[4] H. J. Syah. Engineered Interfaces for Liquid Crystal Technology. Drexel : Faculty Of Drexel University. , 2007, pp. 6.
[5] L.K. Omray, “Liquid Crystals As Novel Vesicular Delivery System: A Review”. Current Trends in Technology and Science, Vol. II, Issue : VI, 2013, pp.347-353
[6] P.P. Gaikwad and M.T. Desai, “Liquid Crystalline Phase and Its Pharma Applications”,International Journal of Pharma Research & Review, Dec 2013; 2(12):40-52
[7] R.A. Gharde and S.A. Mani, “Thermal Characterization of Nematic Liquid Crystal Elastomer”, Asian Journal of Applied Science and Engineering, Vol. 3, No.2, 2014; pp.114-118
[8] I.C. Khoo. Liquid Crystals, 2ndedition. Hoboken : John Wiley & Sons, Inc. , 2007, pp. 6-7.
[9] S. Singh,”Phase Transitions in Liquid Crystals”, Physics Reports. Oxford, Vol. 324, 2000, pp. 114.
[10] G. Skaĉej and C. Zannoni, “External field-induced switching in nematic elastomers : Monte Carlo Study”. The European Physical Journal E., Vol.20, 2006, pp. 289-298.
[11] J.Y. Kim and S.O. Kim, “Electric fields line up graphene oxide”
Nature Materials, Vol. 13, April 2014; pp.325-326
[12] M.Warner and E. M. Terentjev. Liquid Crystal Elastomers. Oxford : Clarendon Press, 2003.
[13] M.R. Wilson, “Molecular simulation of liquid crystals: progress towards a better understanding of bulk structure and the prediction of material properties (Tutorial Review)”. The Royal Society of Chemistry, Vol.36, 2007, pp. 1881-1888.
[14] [14] P.A. Lebwohl and G. Lasher, “Nematic-Liquid Crystal Order-A Monte Carlo Calculation”,Physical Review A, Vol.6, July 1972, pp. 426-429.
[15] P. Pasini, G. Skaĉej and C. Zannoni, “A microscopic lattice model for liquid crystal elastomers”,Chemical Physics Letters, Vol.413, 2005, pp. 463-467.
[16] G. Skaĉej and C. Zannoni, “Biaxial liquid-crystal elastomers: A
lattice model”,The European Physical Journal E, Vol.25, 2008, pp. 181-186.
[17] D. Jayasri, N. Satyavathi, V.S.S. Sastry and K.P.N. Murthy, “Phase transition in liquid crystal elastomers—A Monte Carlo study employing non-Boltzmann sampling”, Physica A : Statistical Mechanics and Its Applications, Vol.388, 15 February 2009, pp. 385-391.
[18] R.H. Chen. Liquid Crystal Displays, Fundamental Physics and Technology. Hoboken : John Wiley & Sons, Inc., 2011, pp. 91. [19] P.G. de Gennes and J. Prost. The Physics of Liquid Crystals. Oxford:
Oxford University Press, 1993, pp. 119.
[20] N. J. Giordano. Computational Physics. Upper Saddle River: Prentice Hall Inc., 1997, pp. 220-221.
[21] D.P. Landau and K. Binder. A Guide to Monte Carlo Simulations in Statistical Physics, Second Edition. Cambridge: Cambridge University Press, 2000, pp. 11.
[22] R.Y. Rubinstein. Simulation and the Monte Carlo Method. New York: John Wiley and Sons, 1981, pp. 11.
[23] R.W. Shonkwiler and F. Mendivil. Exploration in Monte Carlo Methods. Springer: Springer Science + Business Media, LLC, 2009, pp. 1.
[24] D. Demus, J. Goodby, G.W. Gray, H.-W. Spiess and V. Vill.
Handbook of Liquid Crystals, Vol.1:Fundamentals. Hoboken : Wiley-VCH, 1998, pp. 480.
[25] F. Duan and J. Guojun. Introduction to Condensed Matter Physics, Vol.1. Singapore : World Scientific Pub. Co. Pte. Ltd, 2005 pp. 415. [26] J. Aramaki, “Magnetic field-induced stability of a speci_c
con_guration and the asymptotic behavior of minimizers in nematic liquid crystals”, Turkish Journal of Mathematics, Vol. 13, 2013; pp.1001-1021.
[27] W.H. de Jeu. Liquid Crystal Elastomers : Materials and Applications. Heidelberg : Springer-Verlag, 2012, pp. 155.
Cv
h