DIFFERENCES IN DISASTER RESPONSE DUE TO VARYING DATA AVAILABILITY A SERIOUS GAME FOR FLOODING DISASTER
RESEARCH IN SURAKARTA, INDONESIA
Muhammad Syukril
Regional Development Planning Agency of Southeast Sulawesi Province
M. Pramono Hadi
Department of Environmental Geography, Faculty of Geography, Gadjah Mada University
Menno W. Straatsma
straatsma@itc.nl
Faculty of Geo-information and Earth Observation, University of Twente, Enschede, The Netherlands
ABSTRACT
This research aims to propose a method to study the effect of data availability in disaster-response study. This research focused on how to quantify the relation between data availability and actions taken by decision maker. The more specific topic is represented as disaster response due to varying data availability using Serious Game method in the Public Works Unit Surakarta. The serious game provide scenario to gather data about several issues. Digital elevation model, flood alert stage decision making, and damage prediction information were needed. This research also could promote as a complement the other method for collecting data and decision-making training program for flood manager. The result of analysis has shown that there are differences of responses based on the data availability. Better responses can be achieved by the improvement of data availability. It also proves that the number of correct decision was raised by the improvement of data availability.
Keywords : disaster response, data availability, spatial information, serious game, flash.
INTRODUCTION
Within the framework of flood risk management, several aspects need to be considered to mitigate the flood risk, most influential are the cycle of flood and the response against it. The response may vary and influenced by many factors, including the availability of the data. This relationship, the influence of varying degree of data availability toward response, requires a better understanding that could be achieved through the research.
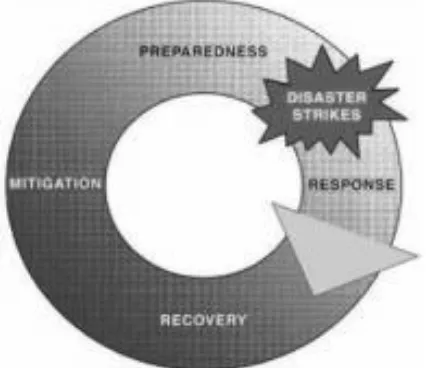
[image:2.612.200.413.188.372.2]Figure 1. Disaster management cycle (Committee on Planning for Catastrophe 2007)
Fig. 1 illustrates the response phase in disaster management cycle, which covers all actions taken just before, during, or just after a disaster, the main activities are on providing basic needs of the affected people until comprehensive solutions can be provided [Warfield, 2010]. In this phase, information about disaster events, risk, vulnerability and risk indicators are essential to provide a better response.
In flooding situation, the data of flood extent, number of affected population, victims and damaged facilities are important for decision maker, but usually it takes too much time to get and the accuracy sometimes does not good enough. Research is needed to study the usability of spatial information to enhance the response action during disaster. Serious game in scientific and experimental approach developed from user need assessment to make an evaluation of what kind of information actually needed in the response activity.
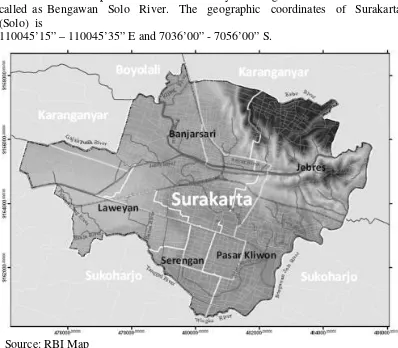
The Eastern part of Surakarta meet by the longest river on Java Island, called as Bengawan Solo River. The geographic coordinates of Surakarta (Solo) is
110045’15” – 110045’35” E and 7036’00” - 7056’00” S.
[image:3.612.106.504.83.431.2]Source: RBI Map
Figure 2. Central Java Province and Surakarta City
THE METHODS
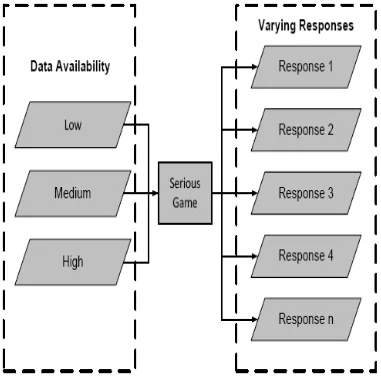
For local government especially flood defense unit in Public works, geographical information loses value if it adds nothing to the decision making or when there are barriers to accessing the right information, at the right time [Hayes-Roth, 2005; Langkamp, 2005; Vreugdenhil, 2009]. The participatory approach was used as a main method to measure differences of response. A serious game was developed and run by each of many participants. The game provides several scenarios, each scenario supplemented by options to be chooses by user. Various scenarios illustrate various degree of data availability: low, moderate and high (Fig. 4). Responses of each person were recorded and further analyzed to explore the difference of response due to varying data availability.
The serious game was developed by combining ArcGIS shape file from many sources such as RBI map scale 1: 250.000 from BAKOSURTANAL, contour map (Scale 1:10.000) provided by Public Works of Surakarta in 1991, fieldwork data from Geographic FKIP Faculty UNS 2008 in [Setiyarso, 2009].
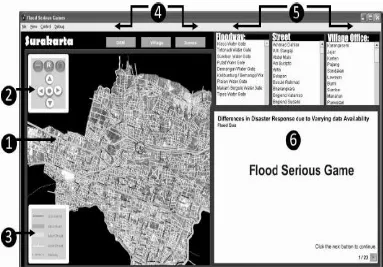
[image:6.612.114.497.142.409.2]
Figure 5. User Interface of Serious Game
Interaction toolbox provided Adobe/Macromedia http://www.adobe.com in [Gowin, 2002] combined with idea and technique developed in http://om4gus.-blogspot.com. Within the serious game, there were six scenarios with three level data availability provided for user:
a. Difference in disaster response from early warning data.
b. Difference in disaster response from information during flooding. c. Difference in disaster response in quick response to find a location. d. Difference in Disaster Response in Flood Alert Stage Decision Making. e. Difference in Disaster Response from Digital Elevation Model usability. f. Difference in Disaster Response from Damage Prediction information.
Table 1. Profile of participants of serious game
Work Familiar with Surakarta area Familiar on using Map
Public Works Yes No Yes No
Bapermas 15 2 10 7
Kesbang Linmas 6 1 3 4
Kesbang Linmas 7 3 4 6
Sub Total 28 6 17 17
Total 34 34
The recorded responses were then analyzed in statistical approach to draw conclusion. Several aspects being studied were:
a. Maximum response selected for detemining the biggest number of selected response from the player.
b. Minimum response selected for detemining the smallest number of selected response fro the player.
c. Stay the same response is the non changing response for different data availability.
d. Changing response is the changing response for different data availability e. Cross tabulation : is a joint frequency distribution of cases based on two or
more categorical variables.
f. Chi Square analysis : test is used to determine whether there is a significant difference between the expected frequencies and the observed frequencies in one or more categories.
RESULT AND DISCUSSION
Analysis of the recorded responses of participants has shown some result as highlighted below.
Content of information (When, Where, Why) the flooding happening
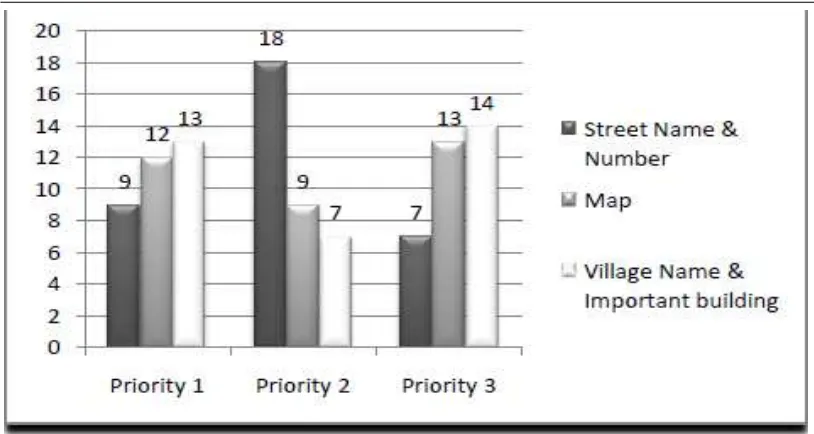
[image:8.612.109.506.208.459.2]Hierarchy of preferred content of information from the most important to the least important are time content (when), spatial content (where) and causal content (why), as shown at Fig. 6.
Figure 6. Priority content of flood information
Figure 7. Response on preferred method for locating incidents and address
Difference in disaster response from early warning data
As shown by Table 2, at low availability, most participants ask for more information (28 of 66 ~ 42,42%); at medium availability, response is directed to go to flood post (23 of 78 ~ 29,49 %); while at high availability, most participants (27 of 89 ~ 30,34%) confidently taking action: prepare sand bag and water pump.
Table 2. Difference in disaster response from early warning data
Data Availability
Low Medium High Ask for more information Response 1 28 19 14 Go to flood post Response 2 22 23 12 Prepare sand bag and water pump Response 3 6 16 27 Repair flood infrastructure Response 4 6 2 19 Issue a flood warning Response 5 4 18 17
Total Response 66 78 89
Difference in disaster response from information during flooding “Flood Extent and Magnitude”
[image:9.612.113.500.435.540.2]Table 3. Summary of response taken during flooding
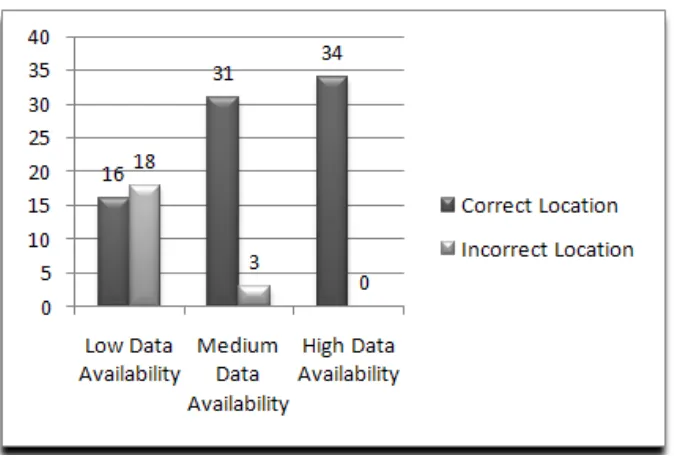
Difference in disaster response in quick response to find a location
As shown at Fig. 8, the influence of data availability is clear, more data improve the accuracy of response to find a location. At low level, less than half respondent found a location correctly, at medium level, approximately 90% found correct location; at high data availability, all respondent found the site correctly.
Figure 8. Summary of responses to find a location
Difference in Disaster Response in Flood Alert Stage Decision Making
As shown at Table 4, at minimal data level, only with information of water height, only 35% respondent took correct decision. With additional data, number of correct response increase to 88%. When supply with damage report showing condition of levee, the correct response are 62%.
Low Medium High
Ask for more information Response 1 28 19 14 Go to flood post Response 2 22 23 12 Prepare sand bag and water pump Response 3 6 16 27 Repair flood infrastructure Response 4 6 2 19 Issue a flood warning Response 5 4 18 17
[image:10.612.138.475.293.523.2]Table 4. Alert stage responses
Additional Data & Scenario
Water Height Level Flood Alert Procedure Demage Report
Correct Decision 12 30 21
Incorect Decision 22 4 13
Total 34 34 34
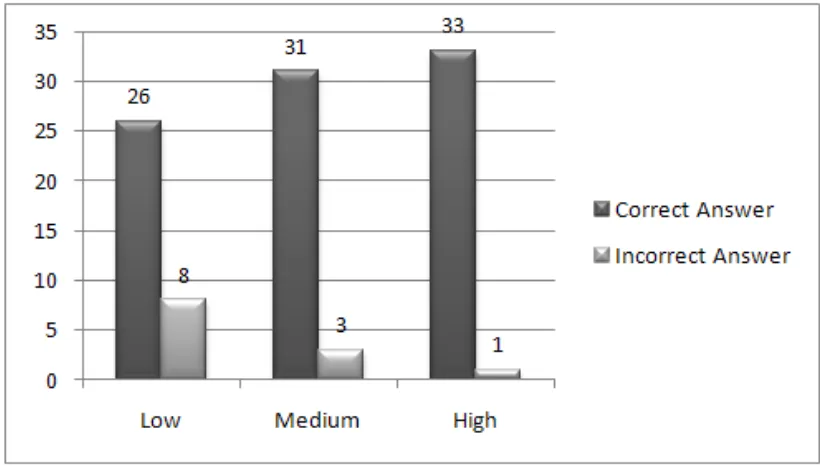
Difference in Disaster Response from Digital Elevation Model usability
As shown at Fig. 9, the usability of DEM is justified. More data availability increase the correctness of response, from 76% at Low to 97% at high.
[image:11.612.105.515.238.471.2]
Figure 9. Summary responses of DEM Usability
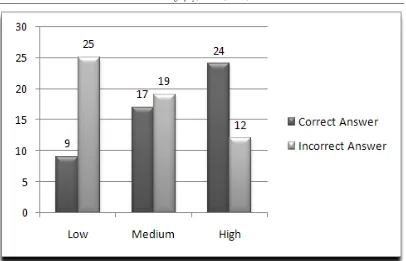
Difference in Disaster Response from Damage Prediction information
Figure 10. Summary responses from damage prediction information
CONCLUSION
Several conclusions can be drawn from the experimental flood serious game:
a. The more accurate data and its completeness can help decision maker produce more accurate decision and confident action.
b. To address specific issues during disaster, it is important to adopt one procedure and common term to avoid miss interpretation about data and disaster situation.
c. Specific information can lead to specific decisions, which produce effective and efficient response.
d. Geographical information could give benefit if it provided in time when it needed and used by the capable decision maker.
e. Some data continuously needed during disaster and some data only needed once.
f. Several data need to simplify before it delivered to the decision maker. g. Type of information can influence decision maker although it contain the
The result of analysis has shown that there are differences of responses based on the data availability:
a. For early information (see table 2), at low availability, the decision makers ask for more information (28 of 66 ~ 42,42%); at medium availability, response is directed to go to flood post (23 of 78 ~ 29,49 %); while at high availability, most decision makers (27 of 89 ~ 30,34%) confidently taking action: prepare sand bag and water pump
b. For Flood extent and magnitude, better responses can be achieved by the improvement of data availability. Number of correct decision raised significantly by the improvement of data availability: 47,06% at low availability, 91,17% at medium availability, 100% at high data availability (see Table 3). Results presented at table 34 and table 37 provide similar conclusion.
RECOMMENDATION
To provide effective flood information for response action the recommendations to the Public Works of Surakarta are:
a. To make a standard protocol and format for flood information inside of each institution and among institution.
b. The procedure should provide standard minimal information in timely manner.
c. When using spatial data, there should be only one base data used in the common operation.
d. Combination of radio communication, printed document and spatial data needed to enhance response action
For serious game development, researcher suggests several points to consider:
To make a serious gaming could be done in various platforms. The realistic scenario and good preparation of visualization data would determine its performance. The other factor is how the player interact with the game environment is also important.
REFFERENCE
Committee on Planning for Catastrophe (2007), A Blueprint for Improving Geospatial Data, Tools, and Infrastructure, National Research Council, Successful Response Starts with a Map: Improving Geospatial Support for Disaster Management. Washington, D.C., The National Academy of Sciences.
Gowin, S. (2002), Using a Macromedia Flash MX quiz template.
Hayes-Roth, F. (2005), Model-based Communication Networks and VIRT: Filtering Information by Value to Improve Collaborative Decision-Making. 10th International Command and Control Research and Technology Symposium: The Future of C2. McLean, VA.
Langkamp, E. J., L.R. Wentholt., B.E. Pengel., C. Gooijer and J.J. de, Flikweert (2005), NOAH, the right in-formation at the right time at the right place. Third International Flood Defence Sym-posium, Nijmegen, The Netherlands.
Setiyarso, B. (2009), Studi Reaksi Manusia Terhadap Bahaya Banjir Kota Surakarta. Surakarta, Education Science Faculty, Sebelas Maret University.(in bahasa)
Vreugdenhil, H. (2009), FLIWAS, the right information at the right place at the right time for the right persons to take the right decision. Utrech, The Netherlands.