Summary The use of potential transpiration models to simu-late transpiration rates in areas prone to soil water deficits leads to overestimates of water use as the soil dries. Therefore, I carried out studies on Eucalyptus grandis W. Hill ex Maiden. trees subjected to soil drying at two field sites in the Mpu-malanga province of South Africa to determine the relation between transpiration rate and soil water availability. I hy-pothesized that, with this relationship defined, simple model-ing of the soil water balance could be used to predict what fraction of potential transpiration was taking place at a given time.
Site 1 supported a stand of 3-year-old E. grandis trees, whereas 9-year-old trees were growing on Site 2, situated 2 km away. At each site, plastic sheeting was laid over the ground to prevent soil water recharge and thereby allow the roots in the soil to induce a continuous progressive depletion of soil water. Measurements of predawn xylem pressure potential, leaf area index, growth and sap flow rates revealed that prevention of soil water recharge resulted in only moderate drought stress. At Site 1, the trees abstracted water down to 8 m below the surface, whereas trees at Site 2 obtained most of their water from depths below 8 m. I found that modeling the water balance of deep rooting zones is impractical for the purpose of simulating nonpotential transpiration rates because of uncer-tainties about the depth of the root system, the soil water recharge mechanism and the water retention characteristics of the deep subsoil strata. I conclude that predicting the occur-rence and severity of soil water deficits from the soil water balance is not feasible at these sites.
Keywords: drought stress, sap flow, soil water abstraction, transpiration.
Introduction
A large proportion of the surface water resources of South Africa emanates from relatively small catchment areas concen-trated along east- and south-facing escarpments and mountain slopes. These catchments were originally largely montane grassland, but today, many have been converted to forest plan-tations, chiefly pines and eucalypts. There is concern that these forest plantations may have an excessively high water use. To obtain a better understanding of the water relations of these forest plantations, the Division of Forest Science and Technol-ogy, CSIR, is developing models to simulate transpiration rates
of the major plantation species. Models to predict potential transpiration by well-watered Eucalyptus grandis W. Hill ex Maiden. trees have been developed for five different age classes of trees (Olbrich 1994). However, these models over-estimate transpiration rates in water-stressed trees. One ap-proach to simulating below-potential transpiration rates is to determine the relationship between transpiration rate and available soil water within the rooting zone. Modeling the water balance in the soil profile would then permit prediction of what fraction of potential transpiration is taking place at a given time (cf. Dunin and Aston 1984, Calder 1992).
Materials and methods Site descriptions and treatments
Two experimental sites were chosen in Frankfort State Forest (24°49′ S, 30°43′ E) in the Mpumalanga (formerly Eastern Transvaal) province of South Africa to investigate the relation-ship between soil water availability and transpiration rates by plantations of E. grandis. In June 1992, plastic sheeting was laid out at each site to cover an area of approximately 900 m2. At Site 1, the plastic sheeting was left in place for 13 months, whereas the plastic sheeting was removed after 7 months (January 15, 1993) at Site 2. The sheeting prevented soil water recharge, and thereby allowed tree roots to progressively de-plete soil water. Both sites were located on relatively flat ridge tops to minimize the possibility of lateral flow of water into or out of the sites. Site 1 supported a stand of 3-year-old trees, whereas 9-year-old trees were growing on Site 2, situated 2 km away. The soils at both sites are deep rhodic ferralsols (FAO 1974) of granitic origin. The 20-year mean annual rainfall recorded in Frankfort State Forest is 1459 mm. Details of the sample trees are listed in Table 1.
Sap flow measurement
The heat pulse velocity (HPV) technique was used to monitor hourly sap flow rates in four adjacent trees at the center of each site. At Site 1, four probe sets per tree were implanted, and the thermistors were positioned to depths of 5, 13, 23 and 35 mm below the cambium. These depths were chosen to place ther-mistors within the sapwood (determined by staining cross sections of trees of similar size with methyl orange), and to be 5 mm from the sapwood/cambium and sapwood/heartwood interface. Probes were repositioned in January 1993 to adjust
Response of
Eucalyptus grandis
trees to soil water deficits
P. J. DYE
Division of Forest Science and Technology, CSIR, Private Bag X11227, Nelspruit 1200, South Africa
Received March 2, 1995
for the diameter growth of the trunks. At Site 2, eight probe sets per tree were implanted, two each at depths of 5, 11, 19 and 27 mm beneath the cambium. Three vertically aligned holes were drilled radially into the sapwood at each position, with a 1.85-mm drill bit. A line heater was inserted into the central hole, and temperature-sensing probes were implanted 10 mm above and 5 mm below the heater. The line heater consisted of a steel tube with an outside diameter of 1.8 mm. Temperature probes consisted of a single thermistor sealed within a Teflon tube of similar diameter. Each sensor probe thus gave a point estimate of sapwood temperature. Each thermistor pair was connected in a Wheatstone bridge configuration and automat-ically adjusted to zero output before each heat pulse initiation. The logger was programed to apply a current of 30 amps for 0.5 s to each of the eight heaters. Heat pulse velocity was measured for each probe set by the compensation technique (Huber and Schmidt 1937, Swanson 1974). At the end of each experiment, trunk segments containing the drilled holes were removed to measure probe separation distances (to the nearest 0.1 mm) at the original thermistor insertion depth, and the size of the wound at each probe set location was measured (to the nearest 0.1 mm) with a 7X scale loupe. The wound measure-ments were taken midway between the line heater position and both the upper and lower thermistors. Swanson and Whitfield’s (1981) wound correction coefficients were used to derive cor-rected heat pulse velocities. The corcor-rected heat pulse velocities were converted to sapwood-specific sap flow (v) using the following equation (Marshall 1958):
v = ρb(mc + cdw)u, (1)
where ρb is the dry wood density, mc is the moisture fraction of sapwood, cdw is the specific heat of dry wood, assumed con-stant at 0.33 (Dunlap 1912), and u is the wound-corrected HPV. Wood density was calculated as dry weight per volume of a freshly excised section of sapwood. Volume was determined in the field by immersing the fresh wood sample in water and applying Archimedes’ principle. The moisture fraction, which was calculated as (fresh weight − dry weight)/dry weight, was
assumed to be constant.
Sap flow recorded at each probe depth was considered to be representative of a ring of sapwood with limits defined by the midpoint between successive probe depths or by the interface with cambium or heartwood (Olbrich 1994). Total sap flow was calculated as the sum of these partial areas multiplied by their associated sap flows. Measurements of sap flow were recorded at hourly intervals from June 1992 to June 1993 at Site 1, and from September 1992 to June 1993 at Site 2. Hourly sap flow rates were summed over the daylight hours each day to calculate daily water use. Tree densities at each site were recorded to permit conversion of sap flow per tree to mm equivalent depth of water. Mean ground area per tree was 13.5 and 31.8 m2 at Sites 1 and 2, respectively.
Predawn xylem pressure potential
Predawn xylem pressure potential (XPP) was measured with a Scholander pressure chamber. One leaf was taken at mid-canopy position from each of five trees at each site. One sample leaf was also taken from each of four trees growing outside Site 1 where normal soil water recharge occurred. Leaf area index
Leaf area index (LAI) was measured with an LAI-2000 plant canopy analyzer (Li-Cor Inc., Lincoln, NE) under cloudy skies. Measurements involved an initial above-canopy reading, followed by 10 below-canopy readings and a final above-can-opy reading. The below-canabove-can-opy readings were taken with the sensor positioned directly above each of the 10 access tubes, and the data from the two outermost rings were discarded to ensure that the LAI calculation was based on the canopy characteristics of trees close to the center of the study sites. Trunk growth
Heights and diameters at 1.3, 4, 8 and 11 m above the ground were measured on the four sample trees at Site 1 and on four trees growing outside the site where water recharge was unhin-dered. Trunk volumes were calculated by assuming that the portion of the trunk from ground level to 1.3 m was a cylinder with a diameter equal to that recorded at 1.3 m. The volumes of segments between 1.3 and 4 m, 4 and 8 m, and 8 and 11 m were calculated by assuming the segments to be frustums of a cone. The last segment between 11 m and the top of the tree was assumed to be a cone. The cumulative increments in both height and stem volume since the time of the first measure-ments were plotted to assess the trunk growth rates of the trees. Slow trunk growth rates and the difficulty of measuring heights accurately precluded a similar analysis at Site 2.
Soil water depletion
At each site, 10 aluminum access tubes were installed to a depth of 8.5 m. The access tubes were sited in a 15 × 15 m area centered on the four sample trees at each site. A CPN 503 hydroprobe (Campbell Pacific Nuclear Corp., Pacheco, CA) was used to take neutron counts (60-s recording periods) at depths of 0.25, 0.5, 0.75, 1, 1.25, 1.5, 1.75, 2, 3, 4, 5, 6, 7 and 8 m below the surface every 2 weeks. Counts were expressed
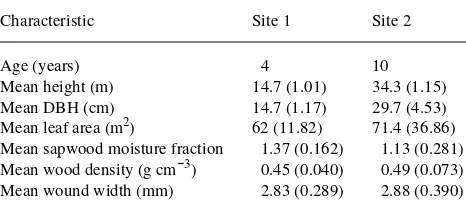
Table 1. Summary of age, height, diameter at breast height (DBH), leaf area, sapwood water fraction, sapwood density and wound width of four sample trees recorded at each site at the end of the study in July 1993. Standard deviations appear in parentheses. Mean leaf areas were estimated by stripping all leaves from the sample trees and estimating total area from total mass based on a relationship determined from a subsample of leaves.
Characteristic Site 1 Site 2
Age (years) 4 10
Mean height (m) 14.7 (1.01) 34.3 (1.15)
Mean DBH (cm) 14.7 (1.17) 29.7 (4.53)
as a ratio of a standard count recorded in the field just before the start of measurements.
Soil water retention characteristics
At the end of the experiment and after two summers of soil water recharge, soil samples were augered from positions within 15 cm of each access tube. Neutron probe counts were recorded immediately before the start of augering. Three ac-cess tubes were sampled in June 1994 and seven in October 1994, after 4 months of dry weather. Soil samples from each neutron probe measurement depth were removed down to 5 m and analyzed for texture and water content. A bulk density sampler was used to retrieve a sample of fixed volume at each depth to determine bulk density. The available water capacity of each soil horizon was estimated with models developed by Hutson (1984) based on a regression analysis of a wide spec-trum of soil types (Schulze et al. 1985).
Results
Sap flow measurement
A summary of various tree characteristics relating to the cal-culation and interpretation of sap flow is shown in Table 1. The mean daily water use of four sample trees at Site 1 is shown in Figure 1. Daily water use averaged approximately 30 l day−1 during the 1992 winter, but rose markedly in the spring in response to increased vapor pressure deficits. Peak daily water use exceeded 90 l day−1 on hot dry days in midsummer and then declined during the fall as temperatures decreased and the photoperiod shortened. There was no indication that water use declined during the study period as a result of increasing soil water deficits.
Daily water use of trees at Site 2 averaged approximately 70 l day−1 between September 1992 and January 1993 (Figure 2). A noticeable increase in daily water use was evident soon after the plastic sheeting was removed from this site on January 15, 1993, suggesting that soil water recharge resulted in a rapid increase in transpiration rate.
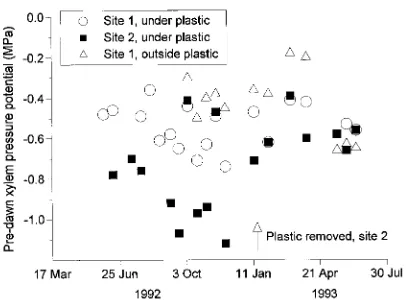
Predawn xylem pressure potential
The trees at Site 1 exhibited a weak annual oscillation in predawn XPP (Figure 3). Least negative potentials occurred in February--April, after which predawn XPP became progres-sively more negative as the rainless winter progressed (cf. Dye and Olbrich 1991). Because soil water recharge was prevented there, trees at Site 1 exhibited more negative predawn XPP values than trees growing outside the site (Figure 3); however, the difference disappeared in May--June 1993 as dry winter conditions developed.
Trees at Site 2 had more negative predawn XPP than trees at Site 1, but predawn XPP followed a similar trend over time. The two data points that depart from the trend were recorded on days when the leaves were wet as a result of a rainfall during the night. The predawn XPP values became less negative when the plastic sheeting was removed on January 15, 1993, as a result of the resumption of rainfall infiltration, indicating that the trees experienced water stress before the plastic sheeting was removed.
Figure 1. Mean daily sap flow (n = 4) at Site 1 for the period June 1992 to June 1993.
Figure 2. Mean daily sap flow (n = 4) at Site 2 for the period September 1992 to June 1993. Zero values in April 1993 indicate missing data.
Leaf area index
There was little change in LAI of trees at Site 1 over the study period (Figure 4), indicating that the trees did not respond to increasing soil water deficits by reducing their leaf area. The LAI of trees at Site 2 was lower than that of trees at Site 1, as a result of the stand having been thinned. The variability in LAI measurements at Site 2 was likely caused by changes in solar irradiance during the greater time interval between above- and below-canopy readings at this site compared with Site 1.
Trunk growth
At Site 1, both height and volume growth increments of the trees declined relative to the growth increments of trees grow-ing outside the site (Figure 5). The final growth measurements on June 16, 1993, suggested a marked reduction in height growth (but not volume growth) in both groups of trees. Al-though the predawn XPP of trees growing outside the site were more negative in June 1993 than earlier in the year, the pre-dawn XPP of trees at Site 1 were higher than the values recorded between August and November 1992 when relatively fast height growth rates were measured. Thus, the decline in
height growth rate cannot be attributed entirely to increasing soil water deficits and likely reflects a seasonal pattern in growth rates.
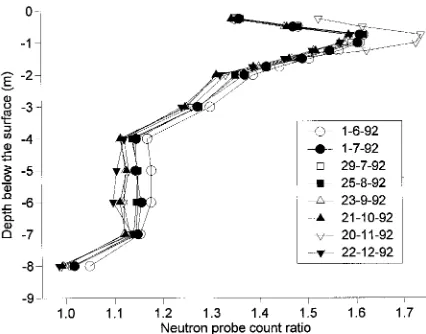
Soil water abstraction
Based on the changes in neutron probe count ratios at Site 1, it is evident that significant soil water uptake was occurring, particularly at depths between 2 and 8 m (Figure 6), and that uptake from deeper soil layers increased after November 1992, presumably as available soil water in the upper strata became depleted. The sharp change in count ratio between soil depths of 1 and 2 m can be attributed to soil textural changes.
There was relatively little change in soil water uptake with increasing soil depths to 8 m at Site 2 (Figure 7), indicating that the trees obtained most of their water from depths below 8 m. The large change in water content of the surface soil (0.25 to 1.25 m) on November 20, 1992, was caused by soil water recharge as a result of damage to the plastic sheeting.
Figure 4. Seasonal trends in leaf area index at Sites 1 and 2.
Figure 5. Comparison of mean height and stem volume growth incre-ments of trees at Site 1 and trees grown under conditions of normal soil water recharge.
Figure 7. Changes in measured neutron probe count ratios (mean of 10 access tubes) at different soil depths at Site 2.
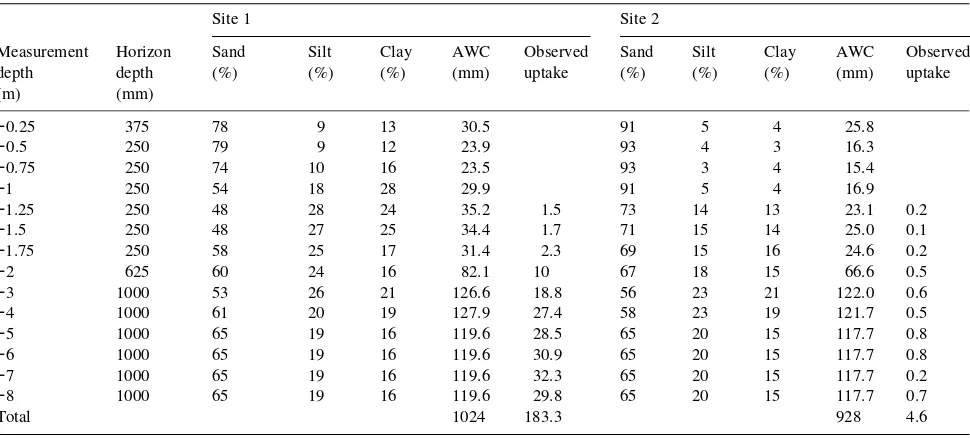
Soil water retention characteristics
Based on the assumption that the available water capacity at a soil depth of 5 m is representative of the soil down to a depth of 8 m, the total available water capacity of the 8-m soil profile was 1024 mm at Site 1 and 928 mm at Site 2. It was impossible to calibrate the soil at each measurement depth from the available data, because changes in volumetric soil water con-tent between June and October 1994 were too small to satis-factorily describe the slope of the calibration line.
The neutron probe count ratio patterns in Figures 6 and 7 suggest that the deeper horizons provided a large proportion of the total water abstracted from the 8-m profile. Because of the uniform texture and low organic matter content of these hori-zons at each site, I estimated a single calibration relationship for the subsoil by grouping the data from the different subsoil depths. Figure 8 shows the relation between mean volumetric soil water content and mean neutron probe count ratio for subsoil strata (1.25--5 m) at the two sites. Volumetric soil water contents varied sufficiently at different depths to reveal the slope of the calibration relation. The outlying data point at the 5-m sampling depth at Site 1 was associated with subsoil material that was particularly friable and difficult to access, so it may have undergone considerable drying during retrieval. Consequently, this value was excluded from the regression analysis. The calibration lines were used to convert differences in count ratios at the start and end of the period during which the plastic sheeting prevented soil water recharge to equivalent changes in volumetric soil water content. Estimated reduction in water content from each subsoil measurement depth during the period when soil water was not recharged is shown in Table 2. At Site 1, a total of 183 mm was abstracted, which represents 14% of the recorded sap flow over the same period. At Site 2, only 4.5 mm was abstracted, amounting to 1.6% of recorded sap flow over the same period.
Discussion and conclusions
The soil water deficits did not cause severe stress in trees at either site, even though the study commenced at a time of severe drought following a particularly dry 1991--92 summer (approximately 700 mm rainfall). At Site 1, the plastic sheeting prevented soil water recharge for 13 months, which included the entire duration of the following 1992--93 summer. The annual pattern of daily sap flow displayed seasonal changes, but exhibited no progressive decline that could be attributed to increasing soil water deficit. Leaf area index remained rela-tively constant and the minimum predawn XPP values re-corded barely declined below −0.7 MPa. Unpublished data from other studies of E. grandis in the region have shown that predawn XPP may reach −1.5 to −2 MPa before symptoms of severe stress occur. Although prevention of soil water recharge resulted in more negative water potentials in trees growing at the experimental sites than in trees growing outside the sites,
Figure 8. Subsoil calibration curves for Sites 1 and 2.
Table 2. Soil texture, available water capacity (AWC) and measured soil water uptake at Sites 1 and 2.
Site 1 Site 2
Measurement Horizon Sand Silt Clay AWC Observed Sand Silt Clay AWC Observed
depth depth (%) (%) (%) (mm) uptake (%) (%) (%) (mm) uptake
(m) (mm)
−0.25 375 78 9 13 30.5 91 5 4 25.8
−0.5 250 79 9 12 23.9 93 4 3 16.3
−0.75 250 74 10 16 23.5 93 3 4 15.4
−1 250 54 18 28 29.9 91 5 4 16.9
−1.25 250 48 28 24 35.2 1.5 73 14 13 23.1 0.2
−1.5 250 48 27 25 34.4 1.7 71 15 14 25.0 0.1
−1.75 250 58 25 17 31.4 2.3 69 15 16 24.6 0.2
−2 625 60 24 16 82.1 10 67 18 15 66.6 0.5
−3 1000 53 26 21 126.6 18.8 56 23 21 122.0 0.6
−4 1000 61 20 19 127.9 27.4 58 23 19 121.7 0.5
−5 1000 65 19 16 119.6 28.5 65 20 15 117.7 0.8
−6 1000 65 19 16 119.6 30.9 65 20 15 117.7 0.8
−7 1000 65 19 16 119.6 32.3 65 20 15 117.7 0.2
−8 1000 65 19 16 119.6 29.8 65 20 15 117.7 0.7
the greatest difference in predawn XPP values only amounted to about −0.3 MPa. Thus, we conclude that the trees growing at Site 1 experienced only mild stress.
At Site 2, there was no progressive decline in daily sap flow during the 7-month period when soil water recharge was vented. However, an increase in both daily sap flow and pre-dawn XPP occurred after the plastic sheeting was removed midway through the 1992--93 summer (January 15, 1993), implying that soil water deficits were sufficient to cause some physiological responses in the trees, although the minimum predawn XPP of −1.1 MPa indicates that the stress was not severe.
The failure of the trees to respond to the imposed soil water deficits can be attributed to the ability of the trees to abstract soil water to a depth of at least 8 m. At Site 1, abstraction from soil depths between 1 and 8 m was estimated to be 183 mm (14% of measured sap flow), indicating that most water was obtained from deeper soil water reserves. Deep drilling at this site revealed a permeable, stone-free, uniform profile extend-ing down to 38 m (the maximum drillextend-ing depth). The 9-year-old trees at Site 2 appeared to obtain almost their entire water requirement from depths below 8 m. At Site 2, abstraction between 1 and 8 m was estimated to be only 4.5 mm (1.6% of sap flow). Deep drilling at Site 2 revealed live roots at 28 m below the surface.
Given the importance to the species of water deep in the soil profile, a crucial question is whether it can be recharged during continuous Eucalyptus cropping. Although net soil water gain can be anticipated in the first 12--18 months after planting, before the canopies close and leaf areas maximize, in the long-term, it seems likely that abstraction will be greater than recharge, because a net infiltration of 1000 mm would only bring the first 8 m of a dry profile up to field capacity (Table 2). Thus, the probability of soil water recharge below 8 m, even in years of high rainfall, appears small. This would be particu-larly so in short-rotation, unthinned Eucalyptus plantations grown for pulp, where LAI (and hence water use) remains high throughout the rotation. However, the possibility of nonuni-form infiltration down the profile, particularly along old or current root channels, could lead to rapid recharge of deep subsoil water in the presence of trees, permitting high transpi-ration rates to be sustained under continuous cropping (Dell et al. 1983).
I conclude that a simple water balance simulation at these
sites is impractical because of uncertainty in the depth of the root system, soil water recharge mechanisms and water reten-tion characteristics of heterogeneous deep subsoil strata. Pre-diction of the occurrence and severity of soil water deficits from a running soil water balance is therefore not feasible.
Acknowledgments
This work was funded by the Water Research Commission of South Africa. I thank T. Poulter, S. Soko and D. Maphanga for their excellent technical assistance.
References
Calder, I.R. 1992. A model of transpiration and growth of Eucalyptus
plantation in water-limited conditions. J. Hydrol. 130:1--15. Dell, B., J.R. Bartle and W.H. Tacey. 1983. Root occupation and root
channels of Jarrah forest subsoils. Aust. J. Bot. 31:615--627. Dunlap, F. 1912. The specific heat of wood. USDA For. Serv. Bull. No.
110, 28 p.
Dunnin, F.X. and A.R. Aston. 1984. The development and proving of models of large scale evapotranspiration: an Australian study. Agric. Water Manage. 8:305--323.
Dye, P.J. and B.W. Olbrich. 1991. A transpiration model applicable to six-year-old Eucalyptus grandis trees growing under conditions of sufficient soil water availability. CSIR Int. Rep., Pretoria, 29 p. Food and Agricultural Organization of the United Nations (FAO).
1974. Legend to the soil map of the World. UNESCO, Paris, 119 p. Huber, B. and E. Schmidt. 1937. Eine kommpensationsmethode zur thermoelektrischen messung langsamer saftströme. Die Berliner Deutsche Botanische Geselschaft. 55:514--529.
Hutson, J.L. 1984. Estimation of hydrological properties of South African soils. Ph.D. Diss. Univ. Natal, Dept. Soil Sci. Agrome-teorol., Pietermaritzburg, 232 p.
Marshall, D.C. 1958. Measurement of sap flow in conifers by heat transport. Plant Physiol. 33:385--396.
Olbrich, B.W. 1994. The application of the heat pulse velocity tech-nique to the study of transpiration from Eucalyptus grandis. Ph.D. Thesis. Univ. Natal, Durban, South Africa, 120 p.
Schulze, R.E., J.L. Hutson and A. Cass. 1985. Hydrological charac-teristics and properties of soils in Southern Africa 2: soil water retention models. Water SA 11:129--136.
Swanson, R.H. 1974. A thermal flowmeter for estimating the rate of xylem sap ascent in trees. In Flow----Its Measurement and Control in Science and Industry. Ed. R.B. Dowdell. Instrument Soc. Am., Pittsburgh, PA, pp 647--652.