Summary Exposure to ozone (O3) and changes in soil fertil-ity influence both the metabolism of plant roots and their interaction with rhizosphere organisms. Because one indica-tion of altered root metabolism is a change in belowground respiratory activity, we used specially designed measurement chambers to assess the effects of O3 and nutrient availability on belowground respiratory activity of potted three-year-old pon-derosa pine (Pinus ponderosa Dougl. ex Laws.). Seedlings were exposed to a factorial combination of three O3 treatments and three fertilization treatments in open-top O3 exposure chambers.
Ozone exposure decreased and high nutrient supply in-creased total plant dry weight, but root/shoot ratios were not affected. In general, exposure to O3 increased rates of below-ground O2 uptake and CO2 release and the respiratory quotient (RQ, CO2/O2), although seasonal differences were detected. In October, following the second season of O3 exposure, rates of belowground O2 uptake and CO2 release and RQ were in-creased in trees in the high-O3 exposure treatment by 22, 73 and 32%, respectively, over values in control trees in charcoal-filtered air. Increasing nutrient supply resulted in decreasing rates of belowground O2 uptake and CO2 release but it had little effect on RQ. In the high-nutrient supply treatment, rates of belowground O2 uptake and CO2 release were decreased by 38 and 39%, respectively, compared with rates in the low-nutrient supply treatment. At the end of the second growing season, the high-nutrient supply treatment had decreased lateral root total nonstructural carbohydrates by 22% compared with the low-nutrient supply treatment.
Nutrient availability altered the belowground respiratory response to O3, such that the response to O3 was greatest in the low-nutrient supply treatment. Significant O3 effects on below-ground respiratory activity were apparent before any reduction in total plant growth was found, suggesting that roots and rhizosphere organisms may be early indicators of physiologi-cal dysfunction in stressed seedlings.
Keywords: carbon dioxide, microbial respiration, nutrient availability, respiration quotient, root respiration, soil fertility.
Introduction
Tropospheric ozone (O3) adversely affects the growth of trees (Hogsett et al. 1985a, Miller 1987, Taylor et al. 1994). In most studies, emphasis has been placed on understanding the rela-tionship between tree photosynthesis and growth in response to O3 (Coyne and Bingham 1981, Clark et al. 1995). However, because 20 to 50% of the carbon fixed in photosynthesis may be translocated belowground (Cheng et al. 1993, Hendrick and Pregitzer 1993) and as much as 25% lost through belowground respiration (Snellgrove et al. 1982, Schumacher and Smucker 1985, Cheng et al. 1993, Rygiewicz and Andersen 1994), it is important to understand how O3 affects belowground respiration.
Because O3 pollution and low nutrient supply often co-occur in the field, various combinations of O3 stress and low nutrient availability have been studied in several plant species; how-ever, no consistent pattern of response has been observed (Greitner and Winner 1989). Tjoelker and Luxmoore (1991) found that current-year needle biomass was reduced by O3 in loblolly pine (Pinus taeda L.) grown at high N concentrations, but not at low N concentrations, whereas Pääkkönen and Holopainen (1995) found the opposite response in birch (Betula pendula Roth.). Similarly, Heagle (1979) found that soybean plants were more sensitive to O3 at low fertilization rates than at high fertilization rates. In aspen (Populus tremu-loides Michx.), Greitner et al. (1994) found no significant interaction between N and O3 on photosynthesis, whereas Pell et al. (1995) found that N limitation decreased biomass losses due to O3.
In many plant species, O3 reduces root growth more than shoot growth (Horsman et al. 1980, Reinert and Gray 1980, Hogsett et al. 1985a, Cooley and Manning 1987, Nouchi et al. 1991). Although decreased photosynthetic rates resulting from O3 exposure reduce the amount of carbon available to both aboveground and belowground plant processes, this does not necessarily require a concomitant decrease in the proportion of total carbon lost as CO2 through belowground respiratory processes. A few studies have observed O3-induced decreases in root respiration (Hofstra et al. 1981, Ito et al. 1985, Edwards
Nutrient availability alters belowground respiration of ozone-exposed
ponderosa pine
CHRISTIAN P. ANDERSEN
1and CAROLYN F. SCAGEL
2,31 U.S. EPA National Health and Environmental Effects Research Laboratory, Western Ecology Division, 200 SW 35th St., Corvallis, OR 97333, USA
2
Mantech Environmental Research Services Corporation, 1600 SW Western Blvd., Corvallis, OR 97333, USA 3
Present address: USDA-ARS, Horticultural Crops Research Laboratory, Corvallis, OR 97333, USA
Received March 15, 1996
1991), and C-allocation to roots (Gorissen et al. 1991, An-dersen and Rygiewicz 1995); however, most of these studies were of short duration and none included simultaneous meas-urements of rates of O2 uptake and CO2 release.
Estimates compiled by Wiant (1967) suggest that root respi-ration makes up at least 33% of total soil CO2 evolution in forests, and represents a significant proportion of carbon fixed annually. Despite the importance of nutrient supply and O3 on belowground fluxes of carbon, there is little information on the interaction of these two stresses. If O3 decreases photosynthe-sis, but also changes belowground respiratory patterns, the effect of O3 on forest productivity could be even greater than indicated solely by reductions in photosynthesis. We report a three-year study examining the combined influences of O3 exposure and soil fertility on belowground respiration of pon-derosa pine (Pinus ponderosa Dougl. ex Laws.). We tested the hypothesis that nutrient availability alters the respiratory re-sponse to ozone of the belowground system of ponderosa pine.
Materials and methods
Seedling culture
Ponderosa pine (Pinus ponderosa) seedlings, grown from seed originating in Butte County, CA (Zone 521, USDA Forest Service) at an elevation of 769--923 m, were obtained from the California Department of Forestry as one-year-old container-grown stock in December 1990. Seedlings were transplanted to 7 × 25 cm pots filled with perlite supplemented with 3 g of slow-release fertilizer (17,6,10 N,P,K plus micronutrients) and grown in a nursery for one year.
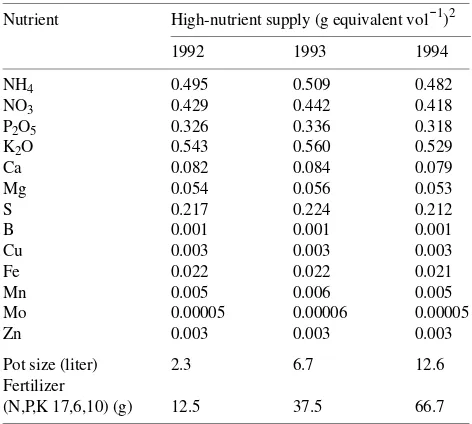
In April 1992, seedlings were transplanted to PVC pipe pots (10-cm diameter × 30-cm depth) containing a 1/1 (v/v) mixture of a commercial growing medium and perlite amended with either 12 g (full rate), 8 g (2/3 rate) or 4 g (1/3 rate) of slow-release fertilizer (17,6,10 N,P,K plus micronutrients). Calculated nutrient concentrations for these fertilization rates are given in Table 1. Plants were grown for two months in an open nursery before being placed in O3-exposure chambers for four months (June to October 1992). The plants were then moved to an open nursery to overwinter.
In December 1992, plants were transplanted to PVC pipe pots (15-cm diameter × 40-cm depth) containing the same growing medium supplemented with either 37, 25 or 12 g of slow-release fertilizer. Nutrient application rates and maxi-mum calculated concentrations are given in Table 1. Plants were grown for five months in an open nursery before being subjected to a second four-month exposure to O3 (May to October 1993). In November 1993, plants were transplanted to large PVC pipe pots (20-cm diameter × 40-cm depth) and supplemented with either 66.7, 44.5, or 22.2 g of slow-release fertilizer (Table 1). Plants were subsequently moved to the open nursery for the winter. Subsets of plants were harvested in September 1992 after one O3 exposure season, October 1993 after the second O3 exposure season and September 1994 after one season of growth without O3. Throughout the study, seed-lings were watered as needed, generally at 3--5 day intervals, based on the gravimetric measurement of a subset of plants.
Pesticides were applied as needed to control aphids and spider mites.
Ozone exposures
Seedlings were exposed to O3 for a total of 122 days during 1992 (June 1 to September 30, 1992) in six modified open-top fumigation chambers in Corvallis, OR. During 1993, plants were exposed to O3 for a total of 142 days (May 15 to Septem-ber 30, 1993) in nine open-top chamSeptem-bers. Plants not harvested after the second year of exposure (1993) were not exposed to O3 in 1994. Fumigations were monitored and controlled by an automated gaseous pollutant exposure system (Hogsett et al. 1985b). Ozone treatment profiles were developed to reflect ambient regional air quality for the Midwest United States (Lefohn et al. 1986, 1987) and consisted of episodic patterns (EP) of varying daily peak concentrations on 28-day cycles as described by Clark et al. (1995).
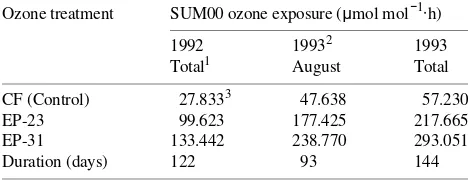
Three treatments were replicated two (1992) or three (1993) times: CF (control, charcoal-filtered air), EP-23 (23 µmol mol−1 O3 per cycle) and EP-31 (31 µmol mol−1 O3 per cycle). Total O3 exposure values (SUM00) were calculated for each chamber by summing the hourly mean concentrations for 122 days in 1992 and 142 days for 1993 (Table 2).
Morphological measurements
Total plant height (H) and root collar diameter (D) were meas-ured at the same time as belowground measurements were taken. Total aboveground plant size, calculated as D2H, was used to estimate root biomass to adjust gas exchange measures when plants were not destructively harvested. Subsets of plants
Table 1. Nutrient concentration of the high-nutrient supply treatment based on pot volume for each year from 1992 to 1994.1
Nutrient High-nutrient supply (g equivalent vol−1)2
1992 1993 1994
NH4 0.495 0.509 0.482
NO3 0.429 0.442 0.418
P2O5 0.326 0.336 0.318
Pot size (liter) 2.3 6.7 12.6 Fertilizer
(N,P,K 17,6,10) (g) 12.5 37.5 66.7
1 Assuming release for 8 to 9 months at a soil temperature of 20 °C. 2
were harvested in September 1992 and October 1993. At harvest, plants were partitioned into needle, stem, taproot and lateral root components and oven-dried weights obtained.
Root respiration instrumentation
Specially designed PVC pot enclosures similar to those de-scribed by Edwards (1991) were used to measure CO2 and O2 fluxes from the soil surface with a Micro-Oxymax 4.2 System with CO2 and O2 sensors (Columbus Instruments, Columbus, OH). The Micro-Oxymax System is a closed system designed to detect low amounts of O2 uptake and CO2 release and to calculate the respiratory quotient (RQ) of sequential samples. Air in the enclosed headspace above the soil surface was pumped through the gas sensors and returned to the pot enclo-sure where gas fractions were meaenclo-sured periodically and changes in the amounts were used to compute O2 uptake and CO2 release (normalized to 0 °C and 760 mm Hg). A reference chamber was used to recalibrate the sensors before each meas-urement. The oxygen sensor operated as an oxygen battery (fuel cell) measuring O2 percentage directly, and the CO2 sensor was a single-beam nondispersive infrared device. The system was fully automated and computerized for the sequen-tial measurement of up to 20 plants at one time.
To make measurements, PVC enclosures were attached to pots containing trees by encircling the stem of the tree with enough closed-cell foam to create a tight seal between the stem and the hole in the center of the top of the PVC enclosure. Closed-cell foam seams on the top of the PVC enclosures were pressed together and attached to the base of the PVC enclosure with spring-loaded clamps that encircled the top of the pot. Two small hose connectors on the top of the PVC enclosure were used to connect the enclosure to the Micro-Oxymax System. Sampling volume of each pot was measured automat-ically.
Belowground respiration measurements
Measurements of CO2 release and O2 uptake, and respiratory quotient (RQ, CO2/O2; Minchin and Witty 1990) from the soil
surface of pots were obtained for a subset of plants in Septem-ber 1992 (after the first exposure season), April 1993 (before the second exposure season), August 1993 (after full expansion of four-year-old needles), October 1993 (after the second ex-posure season) and April 1994. Soil temperature and soil water content were monitored at the time of measurement. Also, at each harvest date (September 1992 and October 1993), rates of CO2 release and O2 uptake and RQ were measured on a subset of plants, the plants were detopped and pots containing roots and soil were kept at 5 °C. After seven days at 5 °C, rates of CO2 release and O2 uptake and RQ were remeasured to provide an estimate of basal respiration rates (Marshall and Perry 1987).
Root carbohydrate analyses
Fine roots were sampled in the fall of 1993 after the second O3 exposure season and in 1994 after shoot elongation was com-pleted. All samples removed for carbohydrate analyses were frozen at −70 °C and lyophilized within 72 h of harvest. Lyophilized tissue samples were weighed, ground in a Wiley mill (40 mesh), bottled, and redried before removing a subsam-ple for carbohydrate analysis. Samsubsam-ples were extracted and concentrations of tissue starch, glucose, sucrose, fructose and monosaccharides were determined as described previously (Wilson et al. 1995).
Statistical analyses
We used a split-plot design with whole-plot treatments of three O3 concentrations randomized within two (1992) or three (1993) chambers per O3 treatment. Subplot treatments in-cluded three nutrient supply rates with five (1992) or four (1993) plants per nutrient supply treatment per chamber, for a total of 90 (1992) or 108 (1993) plants. Data were log trans-formed (i.e., y=loge(y+ 1)) to reduce the heterogeneity of variances between treatment groups that was detected by Bar-tlett’s Test (Bartlett 1937).
Analysis of variance (ANOVA) was performed on rates of belowground CO2 release and O2 uptake and RQ, morphologi-cal, harvest and root carbohydrate data separately for each of the measurement dates. Orthogonal polynomial contrasts based on the SUM00 O3 were used to test for trends in the effects of O3 on plant response. Polynomial contrasts based on nutrient supply rate (full, 2/3 and 1/3 rates) were used to test for trends in fertilized plants. Differences in mean response between the control treatment (CF at full-rate fertilization) and other treatment combinations were tested by Bonferroni’s mean separation test (Miller 1981).
Repeated measurements of rates of belowground O2 uptake and CO2 release and RQ taken at pre-harvest and post-harvest dates were analyzed by multivariate ANOVA (MANOVA) to test for O3 and nutrient supply effects and their interaction. Post-MANOVA tests included orthogonal polynomial con-trasts for O3 and fertilization main effects to detect linear and quadratic trends in plant response.
Table 2. Total O3 exposure (SUM00) and duration of fumigation
periods for each year of the ponderosa pine study. Ozone treatments were: CF = charcoal-filtered air; EP-23 = 23 µmol mol−1 O3 per cycle;
and EP-31 = 31 µmol mol−1 O3 per cycle.
Ozone treatment SUM00 ozone exposure (µmol mol−1⋅h)
1992 19932 1993 Total1 August Total
CF (Control) 27.8333 47.638 57.230 EP-23 99.623 177.425 217.665 EP-31 133.442 238.770 293.051 Duration (days) 122 93 144
1
Period in exposure chamber per exposure season. Total = all season; August = until Exposure Day 93 in August.
2 The 1993 values are cumulative over both exposure years. 3 Values are averaged over chamber replicates (2 for 1992 and 3 for
Results
Morphological responses to O3 and soil fertility
By the end of the first season of growth in September 1992, low-nutrient supply had caused a significant linear reduction in total plant biomass (Table 3). After two seasons of growth with the low-nutrient supply, there was a significant reduction in the biomass of all seedling components (Table 4). Ozone exposure did not significantly reduce biomass during the first
season of exposure (Table 3); however, during the second season, O3 reduced the biomass of all seedling components (Table 4). Both O3 and nutrient main effects were significant after the second exposure season, but there were no interac-tions between the treatments.
Premature needle senescence of the oldest foliage age classes was observed in the EP-23 and EP-31 O3 treatments by the end of the study in 1994. Control plants retained approxi-mately 76% of their 3-year-old needles, whereas seedlings in the EP-23 and EP-31 O3 treatments retained 43 and 0%,
re-Table 3. Summary of ANOVA for ponderosa pine biomass responses to O3 exposure and nutrient supply in September 1992 after one season of
exposure to O3. Ozone treatments were: CF = charcoal-filtered air; EP-23 = 23 µmol mol−1 O3 per cycle; and EP-31 = 31 µmol mol−1 O3 per cycle.
Factor Ozone Nutrient Needle1 Stem Above- Total Total Root:
supply ground Root Plant Shoot
LS Means of CF (Control) 1/3 20.40 20.58 40.71 24.30 65.51 0.59 biomass (gdw) 2/3 18.77 18.47 37.25 19.38 57.51 0.51
Full 20.18 17.91 37.69 23.12 61.38 0.59 EP-23 1/3 13.71* 19.67 32.32 24.93 58.73 0.76*
2/3 16.10 20.41 35.25 36.06 62.86 0.71* Full 21.61 22.48* 43.46 25.96 70.38 0.58 EP-31 1/3 12.59* 17.99 30.61 21.16 52.15 0.57 2/3 16.52 22.91* 38.79 26.76 66.79 0.65 Full 22.33 21.96* 41.87 24.55 69.78 0.56
P > F O3 0.504 0.311 0.759 0.346 0.849 0.181
SUM00-Linear2 0.300 0.171 0.518 0.298 0.698 0.164 SUM00-Quadratic 0.705 0.608 0.808 0.306 0.712 0.180 Fertility 0.003 0.483 0.042 0.855 0.154 0.007 Fertility-Linear 0.001 0.269 0.012 0.578 0.055 0.002 Ferility-Quadratic 0.372 0.629 0.858 0.980 0.871 0.767 O3× Fertility 0.184 0.069 0.105 0.293 0.190 0.031 1 An asterisk indicates that LS means were significantly (P < 0.05) different from CF controls in the high-nutrient supply treatment.
2 Where SUM00 refer to contrasts based on exposure indices given in Table 2.
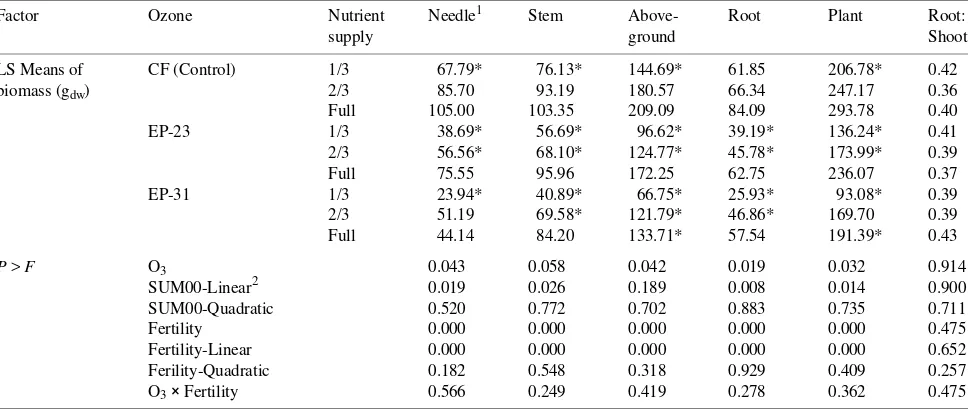
Table 4. Summary of ANOVA for ponderosa pine biomass responses to O3 exposure and nutrient supply in October 1993 after two seasons of
exposure to O3. Ozone treatments were: CF = charcoal-filtered air; EP-23 = 23 µmol mol−1 O3 per cycle; and EP-31 = 31 µmol mol−1 O3 per cycle.
Factor Ozone Nutrient Needle1 Stem Above- Root Plant Root:
supply ground Shoot
LS Means of CF (Control) 1/3 67.79* 76.13* 144.69* 61.85 206.78* 0.42 biomass (gdw) 2/3 85.70 93.19 180.57 66.34 247.17 0.36
Full 105.00 103.35 209.09 84.09 293.78 0.40 EP-23 1/3 38.69* 56.69* 96.62* 39.19* 136.24* 0.41 2/3 56.56* 68.10* 124.77* 45.78* 173.99* 0.39 Full 75.55 95.96 172.25 62.75 236.07 0.37 EP-31 1/3 23.94* 40.89* 66.75* 25.93* 93.08* 0.39 2/3 51.19 69.58* 121.79* 46.86* 169.70 0.39 Full 44.14 84.20 133.71* 57.54 191.39* 0.43
P > F O3 0.043 0.058 0.042 0.019 0.032 0.914
SUM00-Linear2 0.019 0.026 0.189 0.008 0.014 0.900 SUM00-Quadratic 0.520 0.772 0.702 0.883 0.735 0.711 Fertility 0.000 0.000 0.000 0.000 0.000 0.475 Fertility-Linear 0.000 0.000 0.000 0.000 0.000 0.652 Ferility-Quadratic 0.182 0.548 0.318 0.929 0.409 0.257 O3× Fertility 0.566 0.249 0.419 0.278 0.362 0.475 1
An asterisk indicates that LS means were significantly (P < 0.05) different from CF controls in the high-nutrient supply treatment.
spectively, of their 3-year-old needles by the end of the study in August 1994 (data not shown). The loss of foliar biomass due to early senescence was reflected in the October 1993 harvest (Table 4).
Root carbohydrate responses to O3 and soil fertility
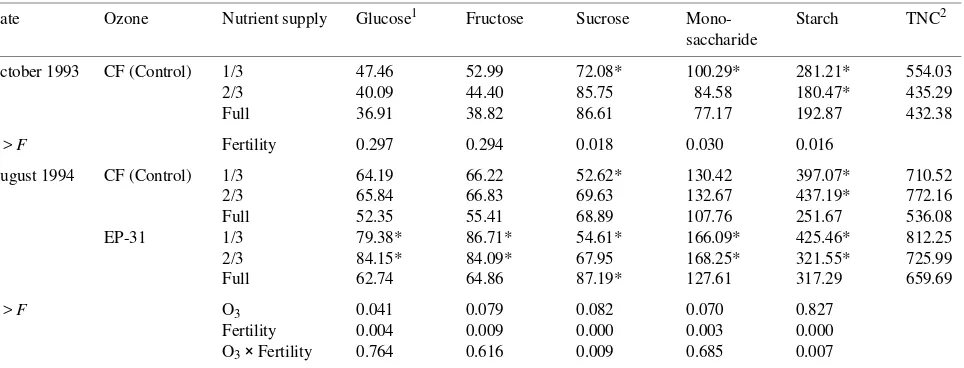
High nutrient supply significantly increased sucrose concen-trations and decreased starch concenconcen-trations of lateral roots after the second season (October 1993) (Table 5). Although lateral root glucose, fructose and monosaccharide concentra-tions were not significantly influenced by nutrient supply, total nonstructural carbohydrates (TNC) decreased with increasing nutrient availability.
To follow the carry-over effect of O3 exposure, a harvest was conducted in August 1994, the year following the second exposure season (Table 5). Lateral root glucose, fructose and monosaccharide concentrations all decreased significantly with increasing nutrient availability (Table 5). Lateral root TNC, glucose, fructose, sucrose, monosaccharides and starch concentrations were all significantly higher in O3-exposed plants than in control plants.
Respiration responses to O3 and soil fertility
On all sample dates, O3 significantly increased the rate of belowground O2 uptake expressed per m2 soil surface area (Table 6). In April, August and October 1993, the rate of belowground O2 uptake generally showed a linear increase with increasing exposure to O3. The rate of belowground CO2 release, expressed per m2 soil surface, was significantly af-fected by O3 in September 1992, and April and August 1993. In general, increased exposure to O3 resulted in increased RQ; however, the effect was only significant on the October 1993 sampling date (Figure 1). The nutrient supply treatments sig-nificantly affected the rates of belowground O2 uptake and CO2
release in April and August 1993, but did not alter RQ ratios at any date. Belowground respiratory rates were lower in the high-nutrient supply treatment than in the low-nutrient supply treatment in April 1993 and 1994, whereas in August 1993, belowground respiratory rates were higher in the high-nutrient supply treatment than in the low-nutrient supply treatment. There were significant interactions between O3 and nutrient availability on three sample dates for rate of belowground O2 uptake, and two sample dates for rate of belowground CO2 release. There was no apparent interaction between O3 and nutrient availability on RQ values (Figure 1).
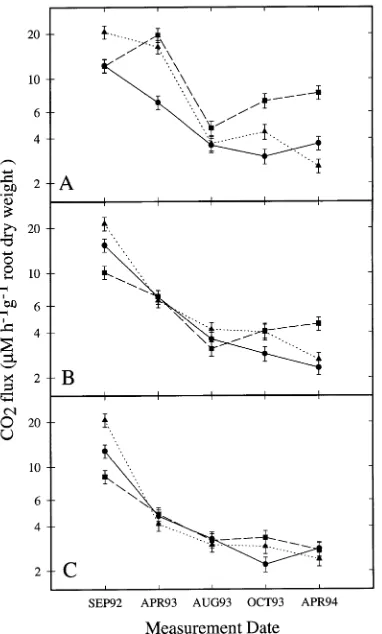
The O3 and low-nutrient supply treatments significantly increased belowground O2 uptake rates on four of five sample dates when the data were expressed on a root dry weight basis (Table 7). The rate of belowground CO2 release was also significantly greater in O3-exposed plants than in control plants on three of the five sample dates, and the low-nutrient supply treatment significantly increased the rate of below-ground CO2 release on three of the five sample dates (Figure 2, Table 7). Significant interactions between O3 and nutrient availability on the rate of belowground CO2 release were observed in April 1993 and 1994. In general, there were linear increases in the rates of belowground O2 uptake and CO2 release with increasing exposure to O3 (Figures 2 and 3, Ta-ble 7). On all measurement dates, belowground respiratory rates were higher in the low-nutrient supply treatment than in the high-nutrient supply treatment (Figures 2 and 3).
Comparison of pre- and post-harvest respiration
Immediately following the respiration measurements in Sep-tember 1992 and October 1993, plants were detopped and soil gas exchange was remeasured after 5 days at 5 °C to estimate basal metabolic rates. Ozone had significant effects on changes in the rates of pre- versus post-harvest belowground O2 uptake
Table 5. Summary of ANOVA of effects of O3 exposure and nutrient supply on ponderosa pine lateral root carbohydrate concentrations in October
1993 and August 1994. Ozone treatments were: CF = charcoal-filtered air; EP-23 = 23 µmol mol−1 O3 per cycle; and EP-31 = 31 µmol mol−1 O3
per cycle.
Date Ozone Nutrient supply Glucose1 Fructose Sucrose Mono- Starch TNC2 saccharide
October 1993 CF (Control) 1/3 47.46 52.99 72.08* 100.29* 281.21* 554.03 2/3 40.09 44.40 85.75 84.58 180.47* 435.29 Full 36.91 38.82 86.61 77.17 192.87 432.38
P > F Fertility 0.297 0.294 0.018 0.030 0.016
August 1994 CF (Control) 1/3 64.19 66.22 52.62* 130.42 397.07* 710.52 2/3 65.84 66.83 69.63 132.67 437.19* 772.16 Full 52.35 55.41 68.89 107.76 251.67 536.08 EP-31 1/3 79.38* 86.71* 54.61* 166.09* 425.46* 812.25 2/3 84.15* 84.09* 67.95 168.25* 321.55* 725.99 Full 62.74 64.86 87.19* 127.61 317.29 659.69
P > F O3 0.041 0.079 0.082 0.070 0.827
Fertility 0.004 0.009 0.000 0.003 0.000 O3× Fertility 0.764 0.616 0.009 0.685 0.007 1
An asterisk indicates LS means significantly (P < 0.05) different from CF controls in high-nutrient supply treatment.
and CO2 release in September 1992 (Figure 4). In September 1992, plants that received the EP-23 O3 treatment showed large declines in rates of belowground O2 uptake and CO2 release following detopping, whereas plants in the EP-31 O3 treatment showed opposite responses (Figure 4). Control plants showed no change in rates of belowground O2 uptake and CO2 release in response to detopping. After detopping, RQ increased in plants exposed to the EP-23 O3 treatment, whereas RQ de-creased in plants exposed to the EP-31 O3 treatment.
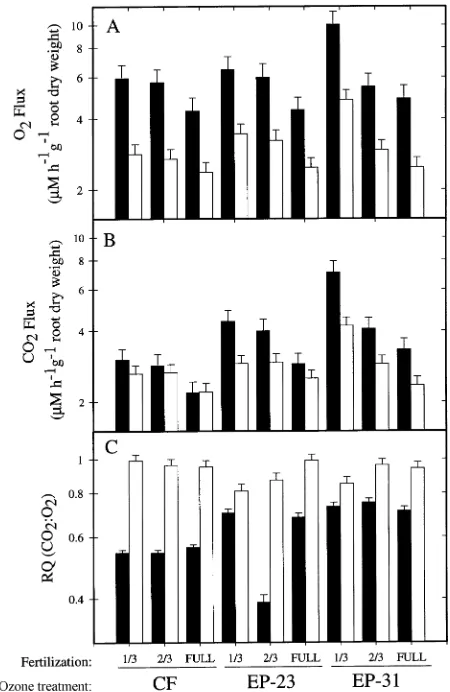
By October 1993, changes in the rates of belowground O2 uptake and CO2 release and RQ in response to detopping were significantly affected by both nutrient availability and O3 (Fig-ure 5). Rates of belowground O2 uptake decreased in all O3 treatments following detopping in October 1993 (Figure 5). Although the rate of belowground CO2 release tended to de-crease following detopping, the rates were not significantly different from those of intact plants (Figure 5). Changes in the rates of belowground CO2 release and O2 uptake resulted in RQ values of control plants increasing dramatically following de-topping, whereas plants exposed to the EP-31 O3 treatment showed relatively small increases in RQ following detopping (Figure 5).
Discussion
There was a significant reduction in the biomass of all plant components after two seasons of exposure to O3 (Table 4). In the EP-31 O3 treatment, total plant biomass was reduced by 55% in response to low-nutrient supply compared with 35% in response to high nutrient supply, although no significant inter-actions were detected (Table 4). Although there have been other studies of tree responses to a combination of O3 stress
Figure 1. Respiratory quotient of soil surrounding roots of ponderosa pine grown at (A) 1/3, (B) 2/3 or (C) full fertilization and exposed to either EP-31 (31 µmol mol−1 O3 per cycle) (j), EP-23 (23 µmol
mol−1 O3 per cycle) (m) or charcoal-filtered air (d). Geometric LS
means and standard errors plotted on a log10y-axis.
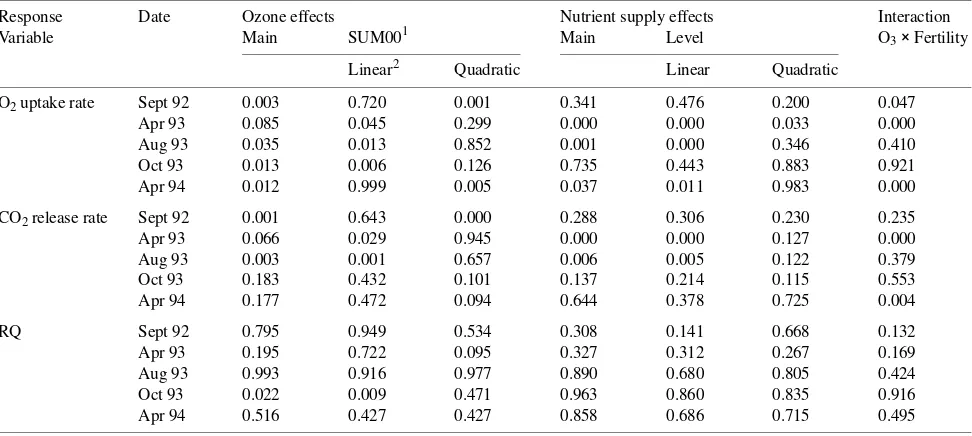
Table 6. Summary of ANOVA for ponderosa pine respiratory responses (µM m−2 h−1) to O3 exposure and nutrient supply. RQ = respiratory
quotient.
Response Date Ozone effects Nutrient supply effects Interaction Variable Main SUM001 Main Level O3× Fertility
Linear2 Quadratic Linear Quadratic
O2 uptake rate Sept 92 0.003 0.720 0.001 0.341 0.476 0.200 0.047
Apr 93 0.085 0.045 0.299 0.000 0.000 0.033 0.000 Aug 93 0.035 0.013 0.852 0.001 0.000 0.346 0.410 Oct 93 0.013 0.006 0.126 0.735 0.443 0.883 0.921 Apr 94 0.012 0.999 0.005 0.037 0.011 0.983 0.000
CO2 release rate Sept 92 0.001 0.643 0.000 0.288 0.306 0.230 0.235
Apr 93 0.066 0.029 0.945 0.000 0.000 0.127 0.000 Aug 93 0.003 0.001 0.657 0.006 0.005 0.122 0.379 Oct 93 0.183 0.432 0.101 0.137 0.214 0.115 0.553 Apr 94 0.177 0.472 0.094 0.644 0.378 0.725 0.004
RQ Sept 92 0.795 0.949 0.534 0.308 0.141 0.668 0.132 Apr 93 0.195 0.722 0.095 0.327 0.312 0.267 0.169 Aug 93 0.993 0.916 0.977 0.890 0.680 0.805 0.424 Oct 93 0.022 0.009 0.471 0.963 0.860 0.835 0.916 Apr 94 0.516 0.427 0.427 0.858 0.686 0.715 0.495
1 Where SUM00 refer to contrasts based on exposure indices given in Table 2. 2
and nutrient availability, no consistent pattern has been ob-served across species or treatments (Greitner and Winner 1989). Tjoelker and Luxmoore (1991) found that O3 reduced
the biomass of current-year needles of loblolly pine grown at high N concentrations but not at low N concentrations, and suggested that loblolly was more sensitive to O3 at high N
Figure 3. O2 consumption of soil surrounding roots of ponderosa pine
grown at (A) 1/3, (B) 2/3 or (C) full fertilization and exposed to either EP-31 (31 µmol mol−1 O3 per cycle) (j), EP-23 (23 µmol mol−1 O3
per cycle) (m) or charcoal-filtered air (d). Geometric LS means and
standard errors plotted on a log10y-axis.
Figure 2. CO2 production of soil surrounding roots of ponderosa pine
grown at (A) 1/3, (B) 2/3 or (C) full fertilization and exposed to either EP-31 (31 µmol mol−1 O3 per cycle) (j), EP-23 (23 µmol mol−1 O3
per cycle) (m) or charcoal-filtered air (d). Geometric LS means and
standard errors plotted on a log10y-axis.
Table 7. Summary of ANOVA for ponderosa pine respiratory responses to O3 and nutrient supply on a root dry weight basis (µM h−1 g−1 root dry
weight). Means for CO2 and O2 are shown in Figures 2 and 3, respectively.
Response Date Ozone effects Nutrient supply effects Interaction Variable Main SUM001 Main Level O3× Fertility
Linear2 Quadratic Linear Quadratic
O2 Flux Sept 92 0.005 0.425 0.002 0.405 0.514 0.243 0.117
Apr 93 0.089 0.043 0.042 0.000 0.000 0.025 0.000 Aug 93 0.948 0.783 0.884 0.039 0.011 0.989 0.339 Oct 93 0.051 0.025 0.329 0.000 0.000 0.616 0.010 Apr 94 0.025 0.054 0.017 0.000 0.000 0.076 0.000
CO2 Flux Sept 92 0.005 0.188 0.002 0.317 0.262 0.308 0.241
Apr 93 0.112 0.051 0.932 0.000 0.000 0.084 0.000 Aug 93 0.927 0.716 0.935 0.109 0.036 0.847 0.281 Oct 93 0.025 0.011 0.602 0.000 0.000 0.974 0.225 Apr 94 0.028 0.048 0.022 0.000 0.000 0.023 0.001
1 Where SUM00 refer to contrasts based on exposure indices given in Table 2.
2 Where Linear and Quadratic denote linear and quadratic constants, respectively, for the O
concentrations. Pääkkönen and Holopainen (1995) found the opposite response in leaf biomass and root dry weight in birch (Betula pendula Roth.), with increased resistance to O3 with increasing N concentration. Greitner et al. (1994) did not find a significant interaction between N and O3 on leaf area or photosynthesis in aspen, but hypothesized that a lower N treatment might have been necessary to detect a significant O3 by N interaction. Heagle (1979) found that soybean plants exposed to O3 were more sensitive at low-nutrient supply rates than at high-nutrient supply rates. In hybrid poplar, fertiliza-tion with one-half the recommended rate of N,P,K fertilizer was associated with increased O3-induced foliar injury com-pared with unfertilized plants or those receiving the full fertili-zation treatment (Harkov and Brennan 1980). We found that the effects of O3 and nutrient availability on ponderosa pine biomass were additive, although there was a trend of greater O3 response at low-nutrient supply.
Ponderosa pine showed increased rates of belowground CO2 release and O2 uptake when exposed to O3, and the effect of O3 was greatest at low-nutrient supply (Figures 2 and 3). In-creased belowground respiration in O3-treated ponderosa pine may reflect altered root metabolism and fine root production (Temple et al. 1993), as well as accelerated rates of root turnover and associated decomposition by free-living soil or-ganisms. Other studies have shown decreased or increased rates of belowground respiration, depending on the species examined, the duration of the ozone exposure, and the ap-proach used to measure respiration. Using a technique similar to the approach employed here, Edwards (1991) found that O3 exposure reduced root respiration of loblolly pine (P. taeda L.) seedlings. Gorissen et al. (1991) found that 14C release from root plus soil respiration was significantly reduced in Pseudot-suga menziesii (Mirb.) Franco during the first one to two weeks after exposure to O3, followed by a recovery period during which respiratory release rates returned to control values.
An-Figure 5. Comparison of October 1993 pre-harvest (filled) and post-harvest (open) O2 consumption (A), CO2 production (B), and RQ (C)
of soil surrounding roots of ponderosa pine grown at 1/3, 2/3 or full fertilization and exposed to either EP-31 (31 µmol mol−1 O3 per
cycle), EP-23 (23 µmol mol−1 O3 per cycle) or charcoal-filtered air
(CF). Geometric LS means and standard errors plotted on a log10 y-axis.
Figure 4. Comparison of September 1992 pre-harvest (filled) and post-harvest (open) O2 consumption (A), CO2 production (B), and
respiratory quotient (RQ) (C) of soil surrounding roots of ponderosa pine grown at 1/3, 2/3 or full fertilization and exposed to either EP-31 (31 µmol mol−1 O3 per cycle), EP-23 (23 µmol mol−1 O3 per cycle) or
dersen and Rygiewicz (1995) found that, although total below-ground respiration was not significantly altered by short-term exposure to O3, the maximum rate of allocation to and respira-tory release of 14C by ponderosa pine roots was decreased. In rice (Orzya sativa L.), Nouchi et al. (1991) reported that a one-week exposure to 0.1 ppm O3 reduced root respiration by 16%, whereas a 3- to 7-week period of exposure to O3 resulted in elevated root respiration. The physiological mechanisms underlying increased or decreased respiration rates of roots and associated soil organisms of O3-exposed plant systems have not been fully elucidated.
Although O3 does not penetrate the soil beyond a few centi-meters, several studies have shown indirect effects of O3 on rhizosphere organisms. Reddy et al. (1991) observed an inter-action between soil pH and O3 on rhizosphere enzymes. Shafer (1988) found an interaction between O3 and simulated acid rain on numbers of fungal propagules in the rhizosphere of sorghum. We obtained preliminary evidence that O3 exposure of ponderosa pine shoots can increase the active fungal and bacterial populations in the rhizosphere (Andersen and Scagel 1995). Ozone also alters the symbiotic associations of mycor-rhizal fungi (Reich et al. 1986, Stroo et al. 1988, Simmons and Kelly 1989, Meier et al. 1990). Although our belowground respiration data included fauna, microbial respiration and root respiration, we estimate that non-root respiration of CO2 and O2 accounted for less than 20% of the total flux (unpublished results). Furthermore, our data are comparable to values ob-tained by direct measurements (Ledig et al. 1976, Cropper and Gholz 1991). If O3 increases root turnover and stimulates soil decomposition processes, then the contribution of free-living soil organisms to the total soil flux may be greater under conditions of elevated O3.
Although we used a containerized system, our rates of CO2 flux from the pot surface of 2 to 20 µmol m−2 s−1 were comparable to in situ gas-exchange measures taken from field soils (Table 6). Hanson et al. (1993) found CO2 fluxes of 0.8 to 5.7 µmol m−2 s−1 from an oak forest soil. Early studies employ-ing gas-exchange chamber techniques (Reiners 1968, Garrett and Cox 1973, Edwards 1975, Edwards and Harris 1977) yielded seasonal minimum and maximum values of 1.1 and 7.6 mol m−2 s−1, and studies employing CO2 absorption techniques (Froment 1972, Anderson 1973, Larkin and Kelly 1987) gave seasonal minimum and maximum values of 0.7 and 9.2. Han-son et al. (1993) found distinct seaHan-sonal trends in rates of soil CO2 release that followed variations in soil temperature and were related to soil water content and coarse fraction. We have also observed seasonality in gas flux, with high rates of CO2 release and O2 uptake during periods of high root activity in the spring and fall (Scagel and Andersen 1997).
Plant detopping eliminates the source of current photosyn-thate for roots, inhibits protein synthesis, and has been used to estimate maintenance and basal respiration rates in roots (Mar-shall and Perry 1987). Changes in ponderosa pine root meta-bolism following seedling detopping may reflect patterns of root growth occurring at the time of detopping. In 1992, below-ground RQ increased following detopping in the EP-23 O3 treatment, whereas seedlings in the EP-31 O3 treatment
showed a decrease in belowground RQ following detopping (Figure 4). One possible explanation for the pattern observed is that, at the time of detopping in 1992, root growth was occurring in the EP-23 O3 treatment but not in the EP-31 O3 treatment. Detopping would disrupt belowground respiratory activity to a greater extent in seedlings undergoing active root growth than in seedlings with slow root growth. Nonautotro-phic CO2 fixation in roots is thought to provide carbon skele-tons for amino acid synthesis in roots (Vuorinen et al. 1992), and in other tissues, as much as 20% of the carbon used for protein synthesis may be derived from nonautotrophic CO2 fixation (Hunt and Fletcher 1976). Decreased CO2 fixation associated with decreased root growth in response to detop-ping may partly explain the increase in belowground RQ in seedlings exposed to the EP-23 O3 treatment.
In October 1993, patterns of respiration following detopping were similar among treatments, suggesting synchronized root phenology at the time of detopping (Figure 5). In most cases, rates of belowground CO2 release and O2 uptake decreased or did not change following detopping. Decreased respiration and increased RQ following detopping in 1993 are consistent with a reduction in root growth and associated protein synthesis. Respiratory quotient in all treatments approached 1 following detopping, consistent with the hypothesis that detopping re-duced non-autotrophic CO2 refixation by the root (Minchin and Witty 1990, Vuorinen et al. 1992).
In summary, belowground respiration was more sensitive to O3 in the low-nutrient supply treatment than in the high-nutri-ent supply treatmhigh-nutri-ent. Ozone-induced increases in the rates of belowground CO2 release and O2 uptake may have resulted in part from increased root turnover and decomposition by soil organisms. The effects of O3 and nutrient supply rate on root carbohydrate concentrations generally paralleled the effects of these treatments on belowground respiration rates. Values of RQ suggested that basal root metabolism was altered by expo-sure to ozone; however, additional studies will be necessary to determine the mechanisms involved. Because forest soils are often nutrient deficient, the significant interactions between soil fertility and O3 must be considered when assessing the impact of O3 on ponderosa pine.
Acknowledgments
We acknowledge the California Department of Forestry, L.A. Moran Reforestation Center, Davis, CA for supplying seedlings used in this study. The authors are grateful to Milt Plocher, Fred Senecal, Craig Hendricks and Pete Ziminski for maintaining the plants and exposure system and assisting in data collection. Rose Wilson performed bio-chemical analyses of tissues for carbohydrate data. Dr. Steve Broich and Dr. Henry Lee provided statistical analyses.
References
Andersen, C.P. and C.F. Scagel. 1995. Nutrient availability alters below-ground respiratory response of ponderosa pine to ozone. Ecol. Soc. Amer. Ann. Meeting. (Abstr.), Snowbird, UT, p 297. Anderson, J.M. 1973. Carbon dioxide evolution from two temperate,
deciduous woodland soils. J. Appl. Ecol. 10:361--378.
Bartlett, M.S. 1937. Some examples of statistical methods of research in agriculture and applied biology. Suppl. J. Royal Stat. Soc. 4:137--183.
Cheng, W., D.C. Coleman, C.R. Carroll and C.A. Hoffman. 1993. In situ measurement of root respiration and soluble C concentrations in the rhizosphere. Soil Biol. Biochem. 25:1189--1196.
Clark, C.S., J.A. Weber, E.H. Lee and W.E. Hogsett. 1995. Accentua-tion of gas-exchange gradients in flushes of ponderosa pine exposed to ozone. Tree Physiol. 15:181--189.
Cooley, D.R. and W.J. Manning. 1987. The impact of ozone on assimilate partitioning in plants: A review. Environ. Pollut. 47:95--113.
Coyne, P. and G. Bingham. 1981. Comparative ozone dose response of gas exchange in a ponderosa stand exposed to long term fumiga-tions. J. Air Pollut. Cont. Assoc. 31:38--41.
Cropper, W.P., Jr. and H.L. Gholz. 1991. In situ needle and fine root respiration in mature slash pine (Pinus elliottii) trees. Can. J. For. Res. 21:1589--1595.
Edwards, N.T. 1975. Effects of temperature and moisture on carbon dioxide evolution in a mixed deciduous forest floor. Soil Sci. Soc. Am. J. 39:361--365.
Edwards, N.T. 1991. Root and soil respiration responses to ozone in
Pinus taeda L. seedlings. New Phytol. 118:315--321.
Edwards, N.T. and W.F. Harris. 1977. Carbon cycling in a mixed deciduous forest floor. Ecology 58:431--437.
Froment, A. 1972. Soil respiration in a mixed oak forest. Oikos 23:273--277.
Garrett, H.E. and G.S. Cox. 1973. Carbon dioxide evolution from the floor of an oak--hickory forest. Soil. Sci. Soc. Am. Proc. 37:641--644.
Gorissen, A., N.N. Joosten and A.E. Jansen. 1991. Effects of ozone and ammonium sulphate on carbon partitioning to mycorrhizal roots of juvenile Douglas-fir. New Phytol. 119:243--250. Greitner, C.S. and W.E. Winner. 1989. Nutrient effects on responses of
willow and alder to ozone. In Transactions: Effects of Air Pollution on Western Forests. Eds. R.K. Olsen and A.S. Lefohn. Air Waste Manage. Assoc., Pittsburgh, PA, pp 493--511.
Greitner, C.S., E.J. Pell and W.E. Winner. 1994. Analysis of aspen foliage exposed to multiple stresses: ozone, nitrogen deficiency and drought. New Phytol. 127:579--589.
Hanson, P.J., S.D. Wullschleger, S.A. Bohlman and D.E. Todd. 1993. Seasonal and topographic patterns of forest floor CO2 efflux from
an upland oak forest. Tree Physiol. 13:1--15.
Harkov, R. and E. Brennan. 1980. The influence of soil fertility and water stress on the ozone response of hybrid poplar trees. Phy-topathology 70:991--994.
Heagle, A.S. 1979. Effects of growth media, fertilizer rate and hour and season of exposure on sensitivity of four soybean cultivars to ozone. Environ. Pollut. 18:313--322.
Hendrick, R.L. and K.S. Pregitzer. 1993. Dynamics of fine root length, biomass and nitrogen content in two northern hardwood forest ecosystems. Can. J. For. Res. 23:2507--2520.
Hofstra, G., A. Ali, R.T. Wukasch and R.A. Fletcher. 1981. The rapid inhibition of root respiration after exposure of bean (Phaseolus vulgaris L.) plants to ozone. Atmos. Environ. 15:483--487. Hogsett, W.E., M. Plocher, V. Wildman, D.T. Tingey and J.P. Bennett.
1985a. Growth response of two varieties of slash pine seedlings to chronic ozone exposures. Can. J. Bot. 63:2369--2376.
Hogsett, W.E., D.T. Tingey and S.R. Holman. 1985b. A programmable exposure control system for determination of the effects of pollutant exposure regimes on plant growth. Atmos. Environ. 19:1135--1145. Horsman, D.C., A.O. Nicholls and D.M. Calder. 1980. Growth re-sponses of Dactylis glomerata, Lolium perenne and Phalaris aqua-tica to chronic ozone exposure. Aust. J. Plant. Physiol. 7:511--517. Hunt, L. and J.S. Fletcher. 1976. Estimated drainage of carbon from the tricarboxylic acid cycle for protein synthesis in suspension culture of Paul’s scarlet rose cells. Plant Physiol. 57:304--307. Ito, O., K. Okano, M. Kuroiwa and T. Totsuka. 1985. Effects of NO2
and O3 alone or in combination on kidney bean plants (Phaseolus vulgaris L.): growth, partitioning of assimilates and root activities. J. Exp. Bot. 36:652--662.
Larkin, R.P. and J.M. Kelly. 1987. Influence of elevated ecosystem S levels on litter decomposition and mineralization. Water Air Soil Pollut. 34:415--428.
Ledig, F.T., A.P. Drew and J.G. Clark. 1976. Maintenance and con-structive respiration, photosynthesis, and net assimilation rate in seedlings of pitch pine (Pinus rigida Mill.). Ann. Bot. 40:289--300. Lefohn, A.S., W.E. Hogsett and D.T. Tingey. 1986. A method for developing ozone exposures that mimic ambient conditions in agri-cultural areas. Atmos. Environ. 20:361--366.
Lefohn, A.S., W.E. Hogsett and D.T. Tingey. 1987. The development of sulfur dioxide and ozone exposure profiles that mimic ambient conditions in the rural southeastern United States. Atmos. Environ. 21:659--669.
Marshall, J.D. and D.A. Perry. 1987. Basal and maintenance respira-tion of mycorrhizal and nonmycorrhizal root systems of conifers. Can. J. For. Res. 17:872--877.
Meier, S., L.F. Grand, M.M. Schoeneberger, R.A. Reinert and R.I. Bruck. 1990. Growth, ectomycorrhizae and nonstructural carbohy-drates of loblolly pine seedlings exposed to ozone and soil water deficit. Environ. Pollut. 64:11--17.
Miller, J.E. 1987. Effects of ozone and sulfur dioxide stress on growth and carbon allocation in plants. Recent Adv. Phytochem. 21:55--100.
Miller, R.G., Jr. 1981. Simultaneous statistical inference. Springer-Verlag, New York, 299 p.
Minchin, F.R. and J.F. Witty. 1990. Effects of acetylene and external oxygen concentration on the respiratory quotient (RQ) of nodulated roots of soybean and white clover. J. Expt. Bot. 41:1271--1277. Nouchi, I., O. Ito, Y. Harazono and K. Kobayashi. 1991. Effects of
chronic ozone exposure on growth, root respiration and nutrient uptake of rice plants. Environ. Pollut. 74:149--164.
Pääkkönen, E. and T. Holopainen. 1995. Influence of nitrogen supply on the response of clones of birch (Betula pendula Roth.) to ozone. New Phytol. 129:595--603.
Pell, E.J., J.P. Sinn and C.V. Johansen. 1995. Nitrogen supply as a limiting factor determining the sensitivity of Populus tremuloides
Michx. to ozone stress. New Phytol. 130:437--446.
Reddy, G.B., R.A. Reinert and G. Eason. 1991. Enzymatic changes in the rhizosphere of loblolly pine exposed to ozone and acid rain. Soil Biol. Biochem. 23:1115--1119.
Reich, P.B., A.W. Schoettle, H.F. Stroo and R.G. Amundson. 1986. Acid rain and ozone influence mycorrhizal infection in tree seed-lings. JAPCA 36:724--726.
Reiners, W.A. 1968. Carbon dioxide evolution from the floor of three Minnesota forests. Ecology 49:471--483.
Reinert, R.A. and T.N. Gray. 1980. The response of radish to nitrogen dioxide, sulfur dioxide and ozone, alone and in combination. J. En-viron. Qual. 10:240--243.
Scagel, C.F. and C.P. Andersen. 1997. Seasonal changes in root and soil respiration of ozone-exposed ponderosa pine grown in different substrates. New Phytol. In press.
Schumacher, T.E. and A.J.M. Smucker. 1985. Carbon transport and root respiration of split root systems of Phaseolus vulgaris sub-jected to short-term localized anoxia. Plant Physiol. 78:359--364. Shafer, S.R. 1988. Influence of ozone and simulated acidic rain on
microorganisms in the rhizosphere of sorghum. Environ. Pollut. 51:131--152.
Simmons, G.S. and J.M. Kelly. 1989. Effects of acidic precipitation, O3, and soil Mg status on throughfall, soil and loblolly pine seedling
nutrient concentrations. Water Air Soil Pollut. 43:199--210. Snellgrove, R.C., W.E. Splittstoesser, D.P. Stribley and P.B. Tinker.
1982. The distribution of carbon and the demand of the fungal symbiont in leek plants with vesicular-arbuscular mycorrhizae. New Phytol. 92:75--87.
Stroo, H.F., P.B. Reich, A.W. Schoettle and R.G. Amundson. 1988. Effects of ozone and acid rain on white pine (Pinus strobus) seed-lings grown in five soils. II. Mycorrhizal infection. Can. J. Bot. 66:1510--1516.
Taylor, G.E., Jr., D.W. Johnson and C.P. Andersen. 1994. Air pollution and forest ecosystems: A regional to global perspective. Ecol. Appl. 4:662--689.
Temple, P.J., G.H. Reichers, P.R. Miller and R.L. Lennox. 1993. Growth responses of ponderosa pine to long-term exposure to ozone, wet and dry acidic deposition and drought. Can. J. For. Res. 23:59--66.
Tjoelker, M.G. and R.J. Luxmoore. 1991. Soil nitrogen and chronic ozone stress influence physiology, growth and nutrient status of
Pinus taeda L. and Liriodendron tulipifera L. seedlings. New Phy-tol. 119:69--81.
Vuorinen, A.H., E.M. Vapaavuori, O. Raatikainen and S.P. Lapinjoki. 1992. Metabolism of inorganic carbon taken up by roots in Salix
plants. J. Expt. Bot. 43:789--795.
Wiant, H.V., Jr. 1967. Has the contribution of litter decay to forest ‘‘soil respiration’’ been overestimated? J. For. 65:408--409.